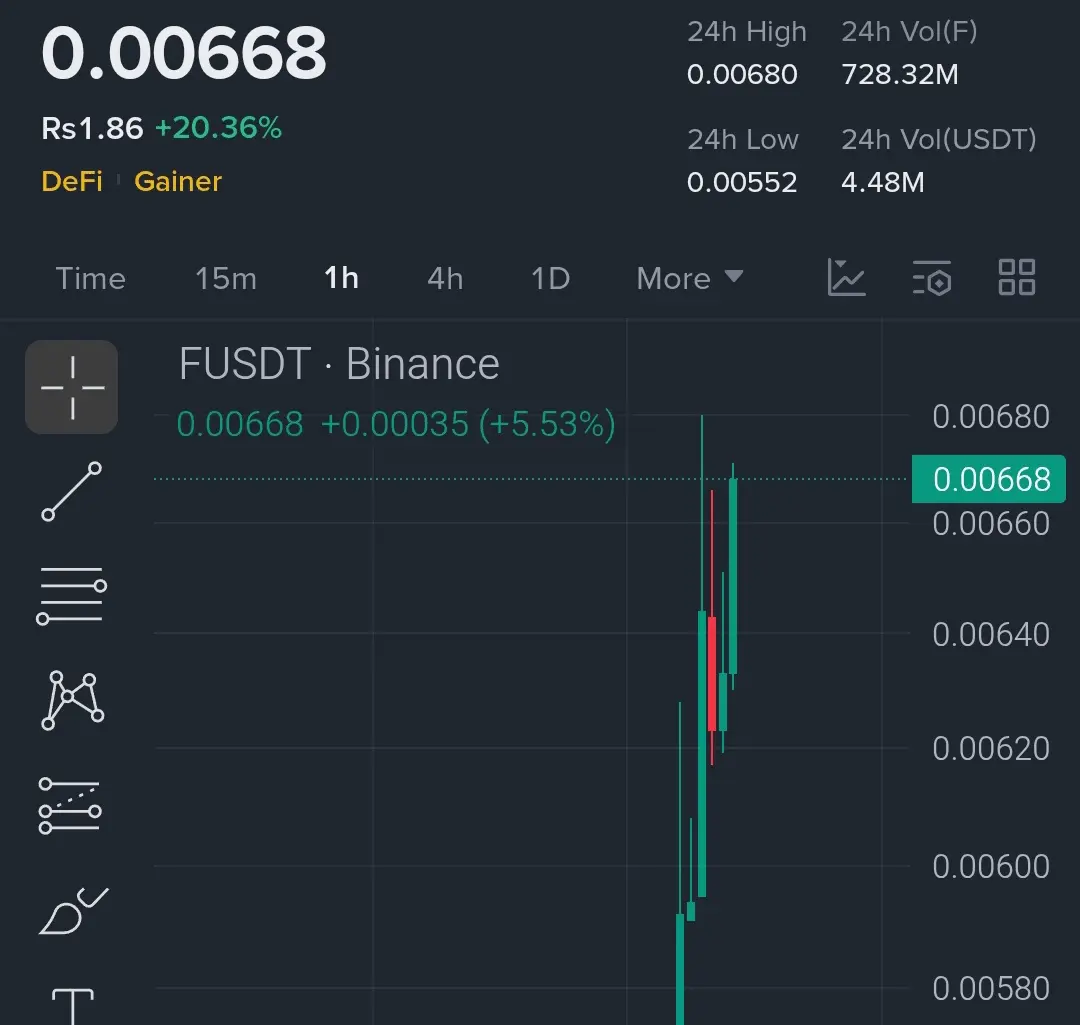
眨眼间你就會錯過這一步…$F 動量剛剛爆發。
$F 做多 🚀
進場:0.0063 – 0.0066
止損:0.0059
目標價1:0.0070
目標價2:0.0075
目標價3:0.0081
乾淨的突破 + 強勁的成交量飆升顯示激進買家介入。
如果價格堅守在0.0062上方…延續腿可能會非常劇烈。
查看原文$F 做多 🚀
進場:0.0063 – 0.0066
止損:0.0059
目標價1:0.0070
目標價2:0.0075
目標價3:0.0081
乾淨的突破 + 強勁的成交量飆升顯示激進買家介入。
如果價格堅守在0.0062上方…延續腿可能會非常劇烈。
- 讚賞
- 按讚
- 留言
- 轉發
- 分享
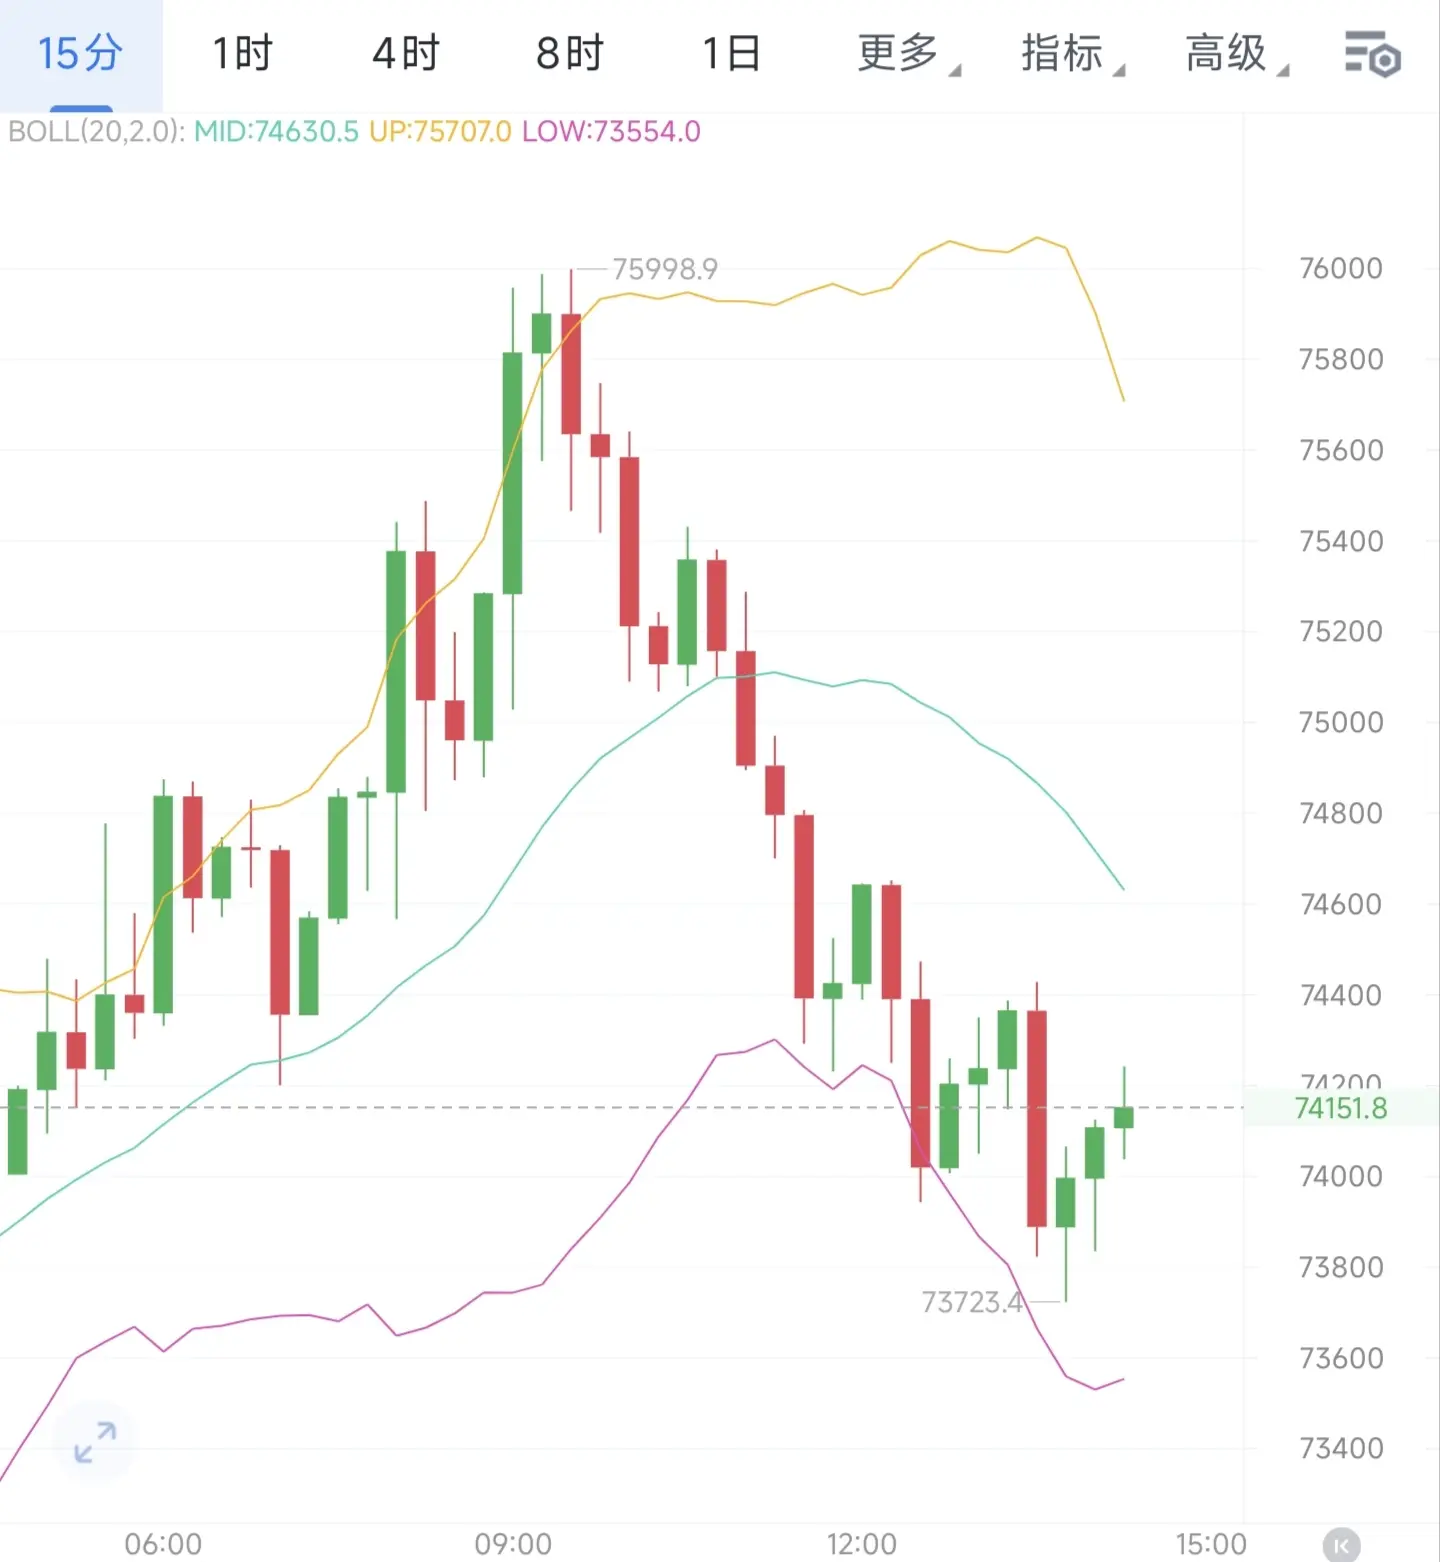
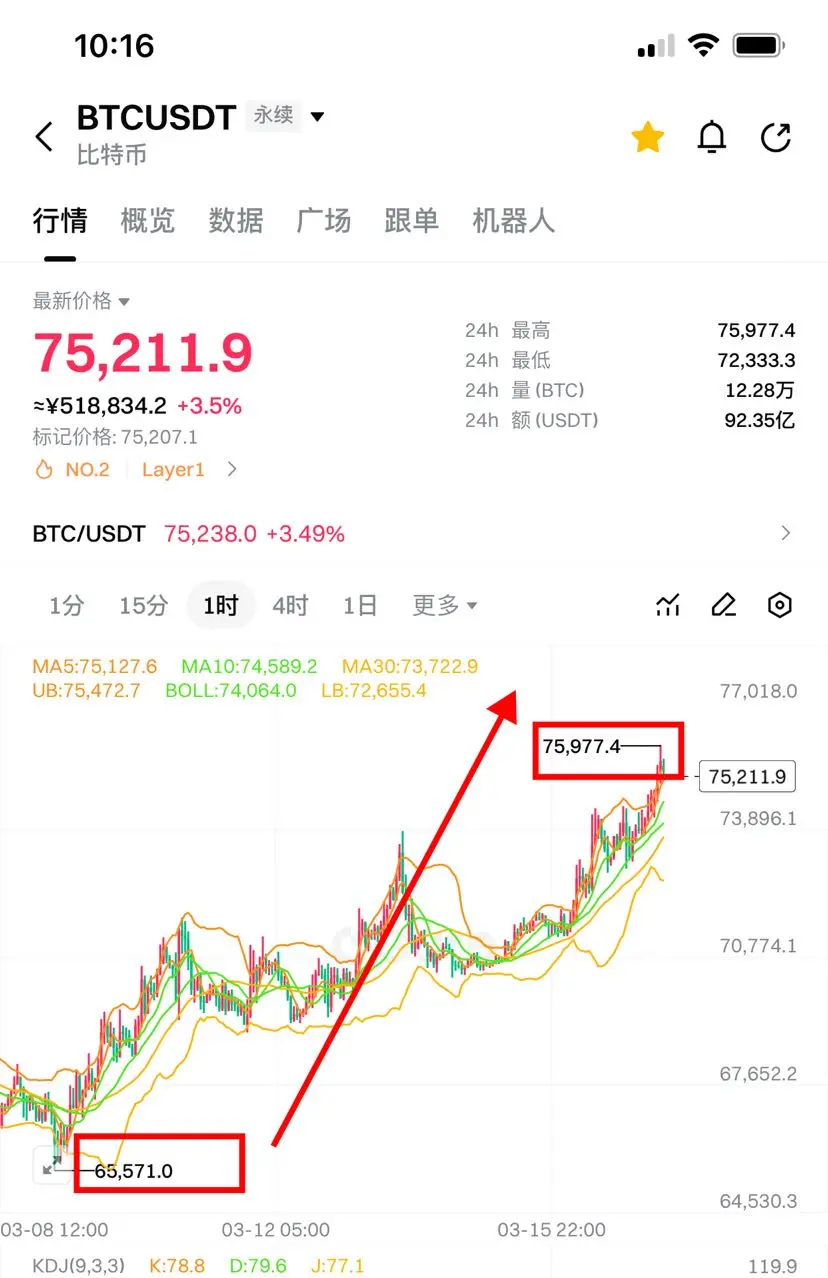
3.17 Bitcoin Midday Analysis
Bitcoin's daily chart showed 9 consecutive positive days, surging to 75,998 before closing with a bearish candle. The bullish momentum is rapidly weakening, and a high-level pullback pattern has essentially formed.
Price has broken below the MA7 moving average, facing pressure below the Bollinger Band midline. The KDJ indicator has formed a death cross pointing downward and entered the oversold zone, with clear short-term correction signals.
From a funding perspective, profit-taking at high levels shows obvious signs of escape, with declining prices accompanied by
BTC1.22%
- 讚賞
- 按讚
- 留言
- 轉發
- 分享
ymhy
阳明海运
創建人@GateUser-16202bc4
認購進度
0.00%
市值:
$0
更多代幣

- 讚賞
- 2
- 留言
- 轉發
- 分享
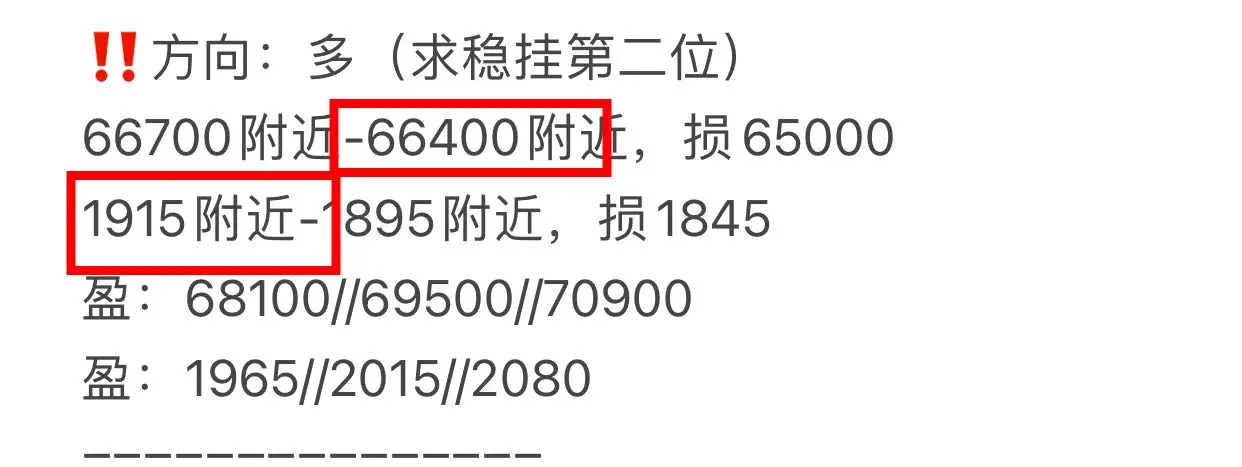
‼️第二單👇
‼️多單第二支撐開單位(第一開單位見置頂貼)
===============
70600附近-70300附近,損68900
2130附近-2110附近,損2060
#Gate广场AI测评官
查看原文‼️多單第二支撐開單位(第一開單位見置頂貼)
===============
70600附近-70300附近,損68900
2130附近-2110附近,損2060
#Gate广场AI测评官
- 讚賞
- 1
- 留言
- 轉發
- 分享

🚀 比特幣大漲並非源自 FOMO
10x Research 指出比特幣最近的漲勢並非來自新資金流入,而主要由看跌期權平倉推動。
⭐ 背後機制:
🟢 大量看跌期權在 $55K–$60K 區域被平倉
🟢 做市商被迫購買 BTC 進行對沖
🟢 形成買盤壓力 → 推動價格大幅上漲
⭐ 結果:
🟢 BTC 突破 $73,750 – $74,400 阻力區
🟢 一度接近 $76,000
⭐ 重要點:尚未出現大額看漲期權資金流 → 即市場還未出現真正的看漲情緒
➡ 結論:當前漲勢更多具有技術性、由對沖推動,而非可持續趨勢 → 需對調整行情保持謹慎。
10x Research 指出比特幣最近的漲勢並非來自新資金流入,而主要由看跌期權平倉推動。
⭐ 背後機制:
🟢 大量看跌期權在 $55K–$60K 區域被平倉
🟢 做市商被迫購買 BTC 進行對沖
🟢 形成買盤壓力 → 推動價格大幅上漲
⭐ 結果:
🟢 BTC 突破 $73,750 – $74,400 阻力區
🟢 一度接近 $76,000
⭐ 重要點:尚未出現大額看漲期權資金流 → 即市場還未出現真正的看漲情緒
➡ 結論:當前漲勢更多具有技術性、由對沖推動,而非可持續趨勢 → 需對調整行情保持謹慎。
BTC1.22%
- 讚賞
- 2
- 留言
- 轉發
- 分享

- 讚賞
- 4
- 1
- 轉發
- 分享
HighAmbition :
:
祝你在馬年 🐴 大發財馬币火
Malaysian Ringgit
創建人@Crypto King2026
上市進度
100.00%
市值:
$2033.91
更多代幣
大家早安 ☀️
祝大家塔可星期二快樂 🌮
查看原文祝大家塔可星期二快樂 🌮

- 讚賞
- 按讚
- 留言
- 轉發
- 分享

- 讚賞
- 2
- 留言
- 轉發
- 分享
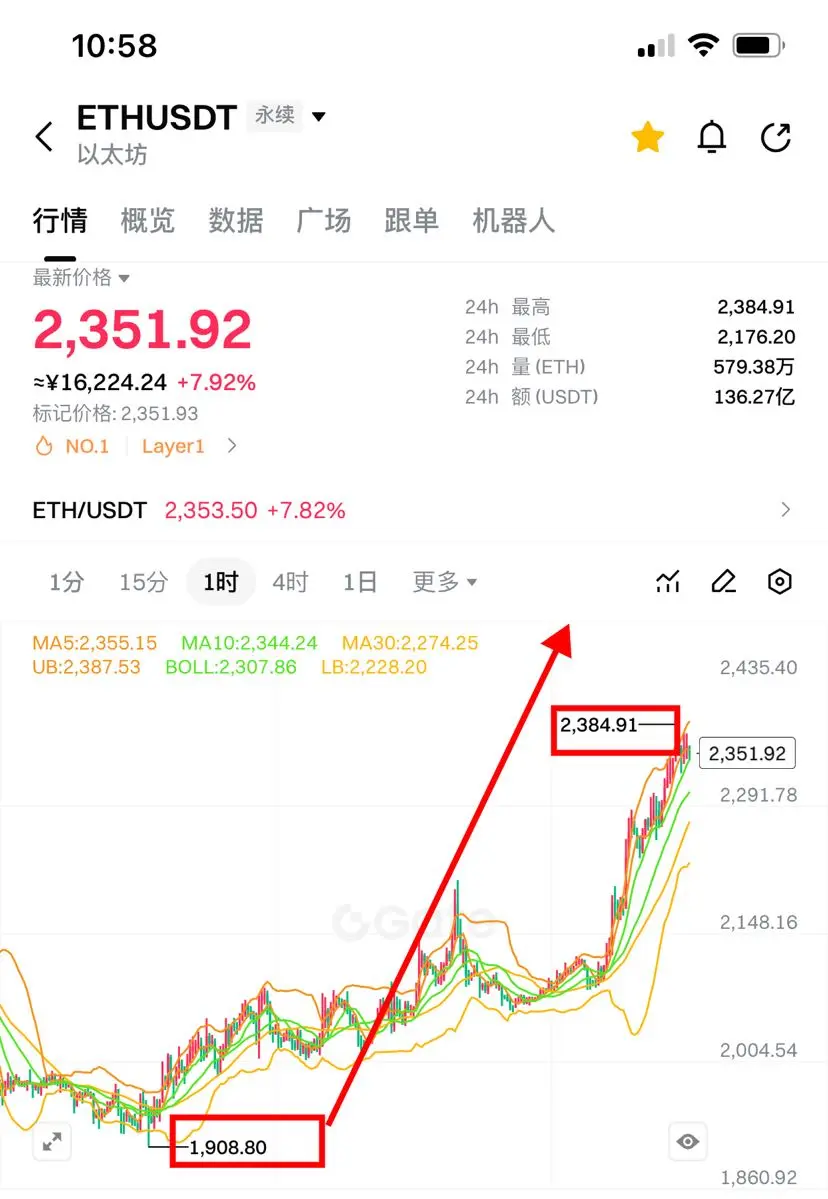
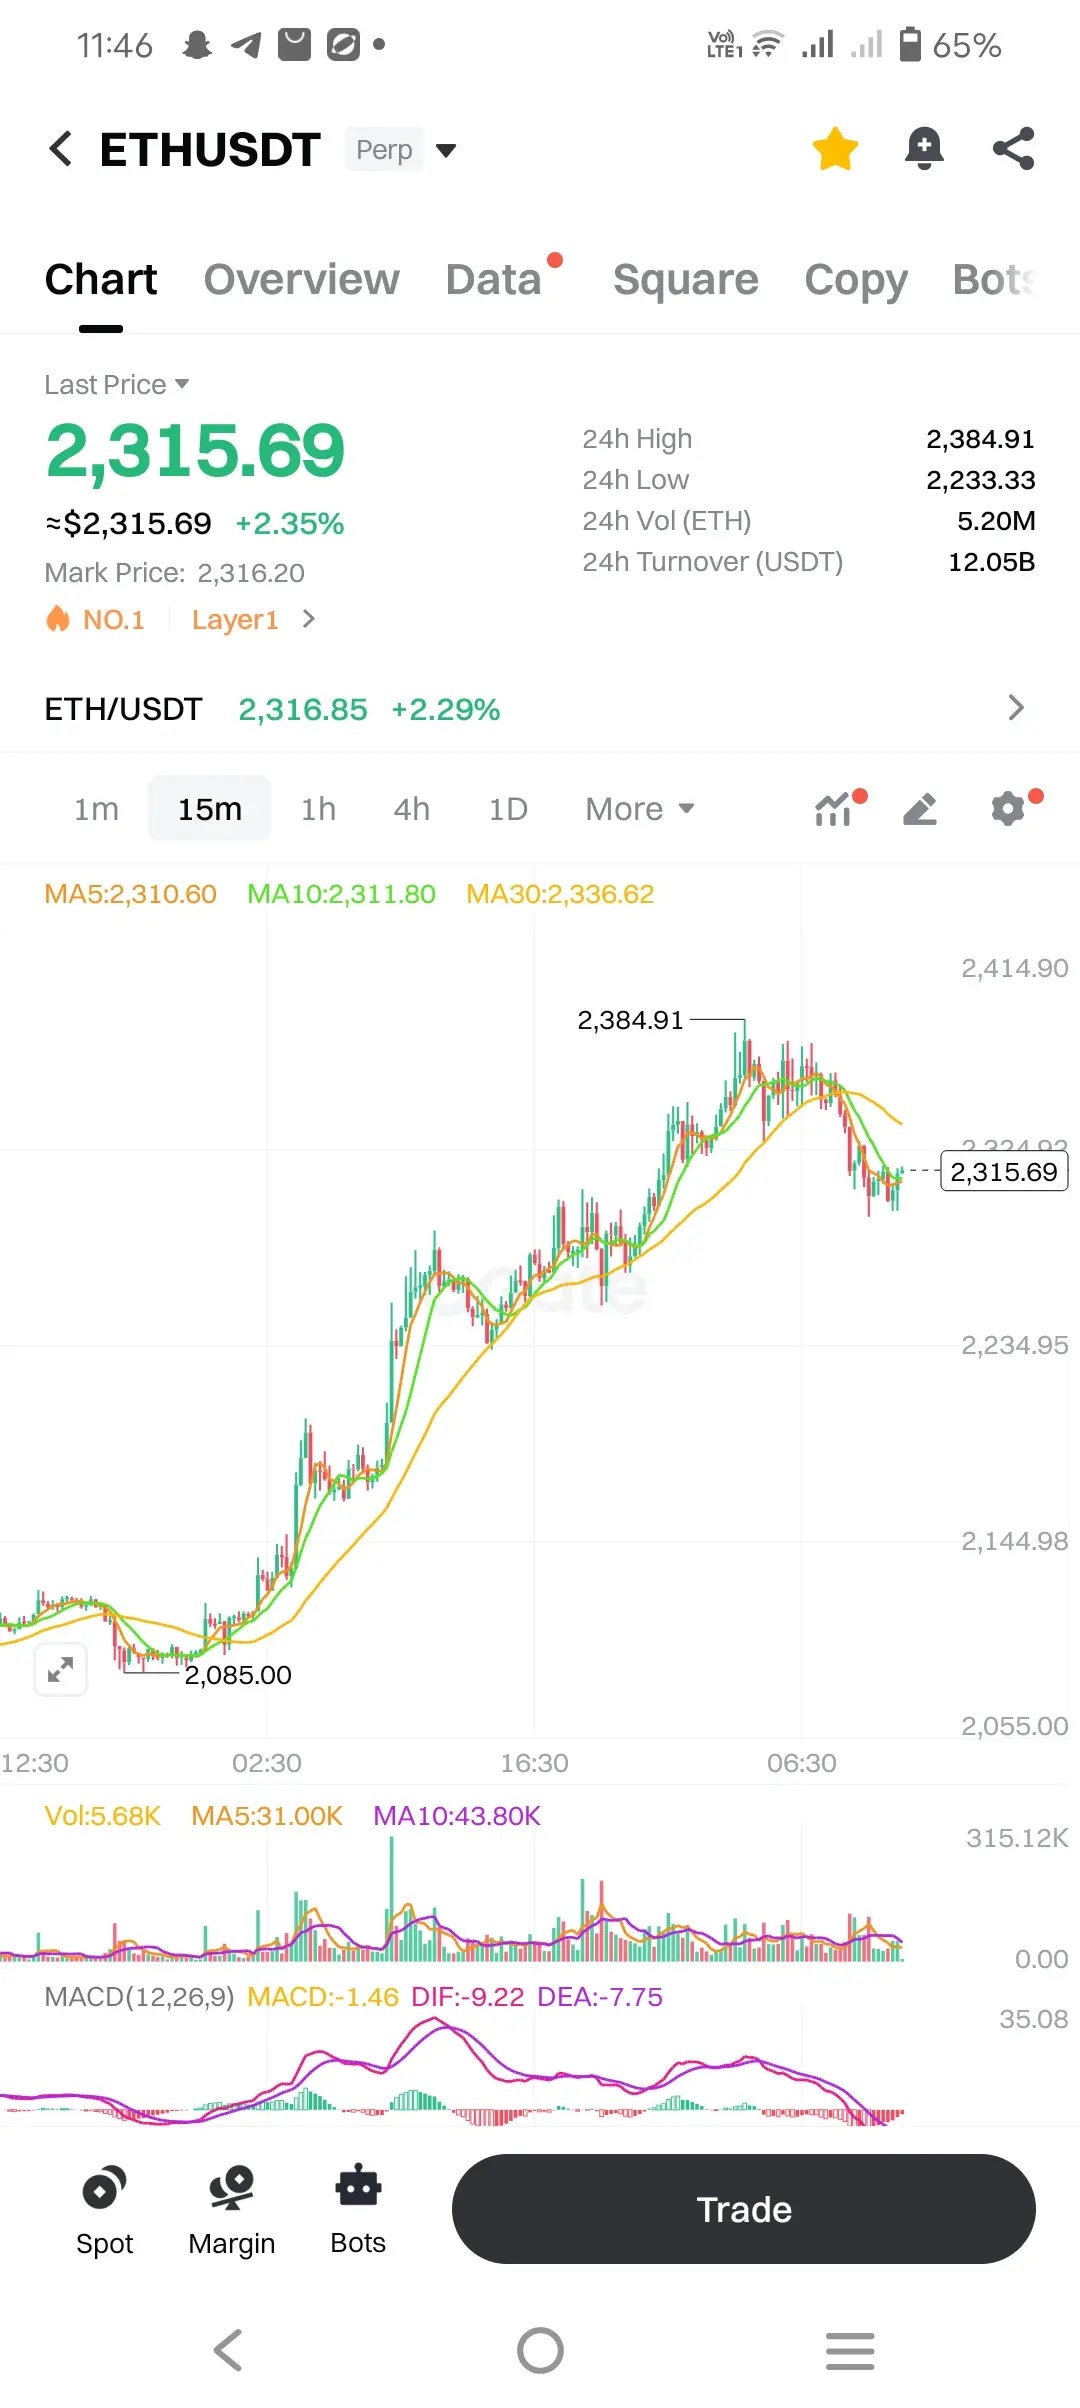
#GateSquareAIReviewer $ETH
在 $2316.01 做空平仓 $3.9696K 後持續上漲 — 空頭措手不及,隨著動能轉向看漲而反轉
進場點: $2300 - $2320
目標價: $2360 / $2420 / $2500
止損: $2260
壓力積聚中。突破正在進行
在 $2316.01 做空平仓 $3.9696K 後持續上漲 — 空頭措手不及,隨著動能轉向看漲而反轉
進場點: $2300 - $2320
目標價: $2360 / $2420 / $2500
止損: $2260
壓力積聚中。突破正在進行
ETH3.55%


- 讚賞
- 3
- 4
- 轉發
- 分享
HighAmbition:
祝你在馬年 🐴 大發財查看更多
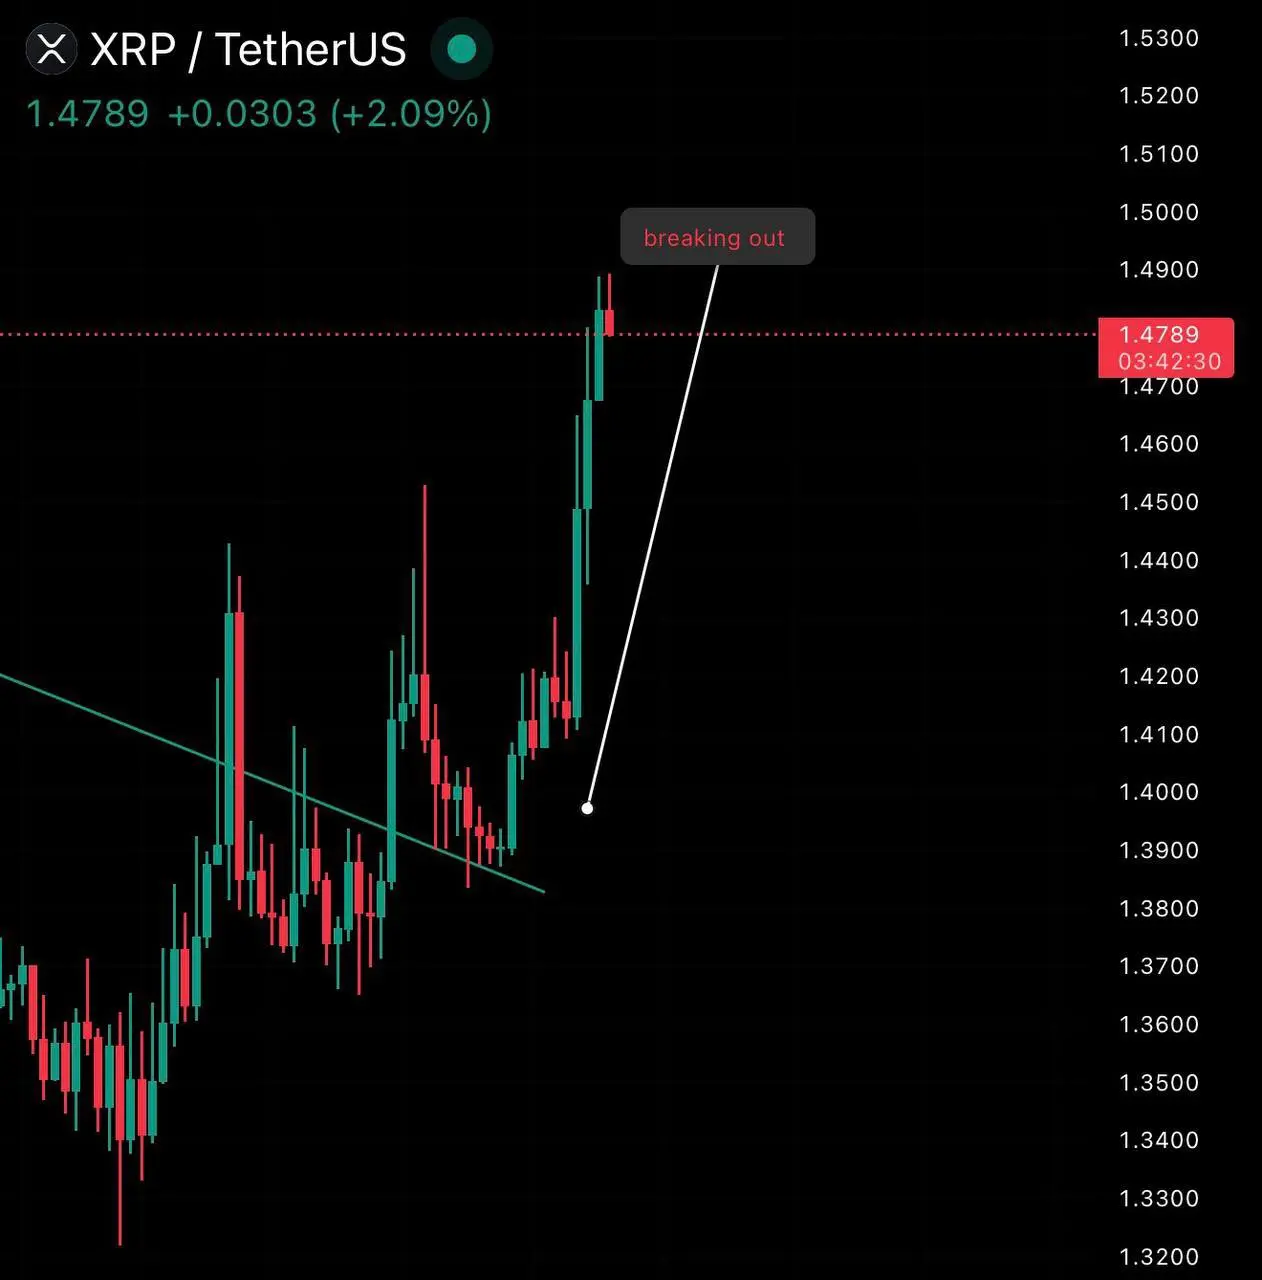
在 $XRP #BitcoinBoomsAbove$75K 上出現了漂亮的突破
價格乾淨地突破了趨勢線並如預期上漲,現在直接向目標區域移動。
動量看起來很強,買家在突破后明確介入 如果這種情況繼續下去,這將是一個堅實的強勢信號。
價格乾淨地突破了趨勢線並如預期上漲,現在直接向目標區域移動。
動量看起來很強,買家在突破后明確介入 如果這種情況繼續下去,這將是一個堅實的強勢信號。
XRP3.85%
- 讚賞
- 1
- 留言
- 轉發
- 分享

- 讚賞
- 按讚
- 留言
- 轉發
- 分享
這段文本已經是繁體中文,無需翻譯。
現在伊朗的事被特朗普玩砸了,這會讓他的訪華行程非常尷尬。
也許我們不覺得有什麼,但他自己受不了啊。本來拎兩個腦袋來的,現在變成拎著一個腦袋,然後自己的龜頭被另一個腦袋咬住。你來幹嘛?來求助的啊?我是來談生意的,不是救護車好不好。
查看原文現在伊朗的事被特朗普玩砸了,這會讓他的訪華行程非常尷尬。
也許我們不覺得有什麼,但他自己受不了啊。本來拎兩個腦袋來的,現在變成拎著一個腦袋,然後自己的龜頭被另一個腦袋咬住。你來幹嘛?來求助的啊?我是來談生意的,不是救護車好不好。

- 讚賞
- 1
- 留言
- 轉發
- 分享
加載更多
加入 4000萬 人匯聚的頭部社群
⚡️ 與 4000萬 人一起參與加密貨幣熱潮討論
💬 與喜愛的頭部創作者互動
👍 查看感興趣的內容
熱門話題
查看更多33.94萬 熱度
4997.2萬 熱度
50.7萬 熱度
211.61萬 熱度
18.13萬 熱度
熱門 Gate Fun
查看更多- 市值:$2503.44持有人數:10.00%
- 市值:$2500持有人數:10.00%
- 市值:$2493.1持有人數:10.00%
- 市值:$2493.1持有人數:10.00%
- 市值:$2527.58持有人數:10.00%
最新消息
查看更多South Korean Defense Minister States: Not Currently Considering Dispatching Cheonghae Unit Destroyer to Strait of Hormuz
1 分鐘前
$500 Million Vulnerability Sparks Controversy: White Hat Hacker Accuses Injective of Delayed Response and Bug Bounty Reduction
1 分鐘前
TradFi 下跌提醒:TME(騰訊音樂)下跌超 2%
1 分鐘前
Bitcoin Breaks Through $75,000: Short Liquidations Exceed $330 Million, Continuous ETF Inflows Heat Up the Market
3 分鐘前
法國加密貨幣綁架案升級:青少年涉炸彈威脅,直升機出動追捕震動巴黎周邊
4 分鐘前
置頂
Gate Booster 第 4 期:發帖瓜分 1,500 $USDT
🔹 發布 TradFi 黃金福袋原創內容,可得 15 $USDT,名額有限先到先得
🔹 本期支持 X、YouTube 發布原創內容
🔹 無需複雜操作,流程清晰透明
🔹 流程:申請成為 Booster → 領取任務 → 發布原創內容 → 回鏈登記 → 等待審核及發獎
📅 任務截止時間:03月20日16:00(UTC+8)
立即領取任務:https://www.gate.com/booster/10028?pid=allPort&ch=KTag1BmC
更多詳情:https://www.gate.com/announcements/article/50203🤖 尋找 Gate 廣場 AI 評測官!$50,000 懸賞令發布!
發帖聊 AI,獎金拿到手軟!新人首帖獎勵翻倍,單帖最高 200U!
📝 立即報名:https://www.gate.com/questionnaire/7477
1️⃣ 發帖得紅包,單帖最高 100U!
2️⃣ Top 體驗分享官:帶 #Gate广场AI测评官 聊技巧,贏國米球衣!
3️⃣ 收益率 PK 王:曬 AI 收益截圖,贏 Gate 定制運動套裝!
4️⃣ 深度好文額外加碼 30U 每篇張榜公布!
💬 來 Gate 廣場,把握行業新趨勢:https://www.gate.com/post
時間:3/12 18:00 – 3/27 24:00 (UTC+8)
詳情:https://www.gate.com/announcements/article/50206Gate 廣場內容挖礦獎勵繼續升級!無論您是創作者還是用戶,挖礦新人還是頭部作者都能贏取好禮獲得大獎。現在就進入廣場探索吧!
創作者享受最高60%創作返佣
創作者獎勵加碼1500USDT:更多新人作者能瓜分獎池!
觀眾點擊交易組件交易贏大禮!最高50GT等新春壕禮等你拿!
詳情:https://www.gate.com/announcements/article/49802