Trade
Basic
Futures
Futures
Hundreds of contracts settled in USDT or BTC
TradFi
Gold
Trade global traditional assets with USDT in one place
Options
Hot
Trade European-style vanilla options
Unified Account
Maximize your capital efficiency
Demo Trading
Futures Kickoff
Get prepared for your futures trading
Futures Events
Participate in events to win generous rewards
Demo Trading
Use virtual funds to experience risk-free trading
Earn
Launch
CandyDrop
Collect candies to earn airdrops
Launchpool
Quick staking, earn potential new tokens
HODLer Airdrop
Hold GT and get massive airdrops for free
Launchpad
Be early to the next big token project
Alpha Points
Trade on-chain assets and enjoy airdrop rewards!
Futures Points
Earn futures points and claim airdrop rewards
Investment
Simple Earn
Earn interests with idle tokens
Auto-Invest
Auto-invest on a regular basis
Dual Investment
Buy low and sell high to take profits from price fluctuations
Soft Staking
Earn rewards with flexible staking
Crypto Loan
0 Fees
Pledge one crypto to borrow another
Lending Center
One-stop lending hub
VIP Wealth Hub
Customized wealth management empowers your assets growth
Private Wealth Management
Customized asset management to grow your digital assets
Quant Fund
Top asset management team helps you profit without hassle
Staking
Stake cryptos to earn in PoS products
Smart Leverage
New
No forced liquidation before maturity, worry-free leveraged gains
GUSD Minting
Use USDT/USDC to mint GUSD for treasury-level yields
More
十一
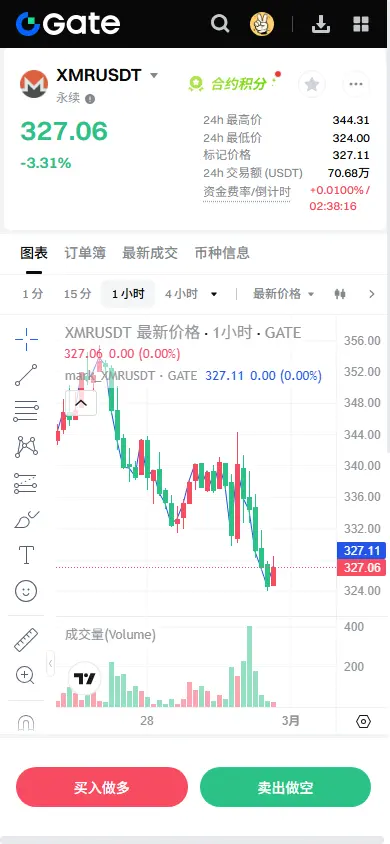
【$XMR Signal】Pullback Long + 1H Level RSI Bullish Divergence Setup
The 1H timeframe is consolidating with decreasing volume in the 324-328 range. RSI$XMR 1H( shows signs of bullish divergence, with the price making new lows but the indicator not confirming, indicating short-term selling pressure is weakening. The 4H price has broken below the EMA20, but EMA50 (334.13) acts as the first resistance above, and the overall trend remains in a weak rebound phase within a downtrend channel. Currently, buy orders are concentrated around 326.5, while sell pressure above 326.6 is dispersed, indicating s
View OriginalThe 1H timeframe is consolidating with decreasing volume in the 324-328 range. RSI$XMR 1H( shows signs of bullish divergence, with the price making new lows but the indicator not confirming, indicating short-term selling pressure is weakening. The 4H price has broken below the EMA20, but EMA50 (334.13) acts as the first resistance above, and the overall trend remains in a weak rebound phase within a downtrend channel. Currently, buy orders are concentrated around 326.5, while sell pressure above 326.6 is dispersed, indicating s
- Reward
- 2
- Comment
- Repost
- Share
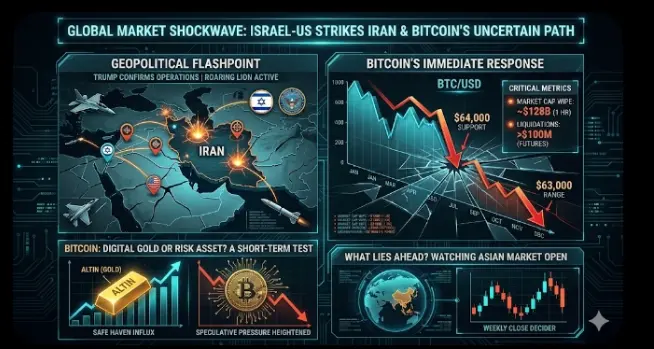
#USIsraelStrikesIranBTCPlunges
Global financial markets awoke to a weekend dominated by escalating geopolitical tensions in the Middle East. The coordinated operation launched by the United States and Israel against strategic targets in Iran triggered a massive "risk-off" wave, causing a sharp tremor across the cryptocurrency markets. With traditional stock exchanges closed, Bitcoin became the primary and most immediate barometer for measuring investor reaction.
Geopolitical Tension and Market Reaction
The shockwaves hit the markets following President Donald Trump’s confirmation of wide-scal
BTC-1.46%

- Reward
- 3
- 3
- Repost
- Share
Flower89 :
:
2026 GOGOGO 👊View More
#深度创作营 War is in full swing! 44 minutes evaporated 480 billion! The US-Israel-Iran conflict has completely ignited! What is the market worried about?
The US-Israel-Iran conflict has fully erupted! After 2:00 PM Beijing time today, Israel launched a surprise attack on Iran first, followed by the US military joining in, and the Middle East warfare is now fully ignited.
As investors, the most concern is undoubtedly the impact of this conflict on the market. From the virtual currency market perspective, 44 minutes after the outbreak of the conflict, the total market capitalization of virtual curre
View Original


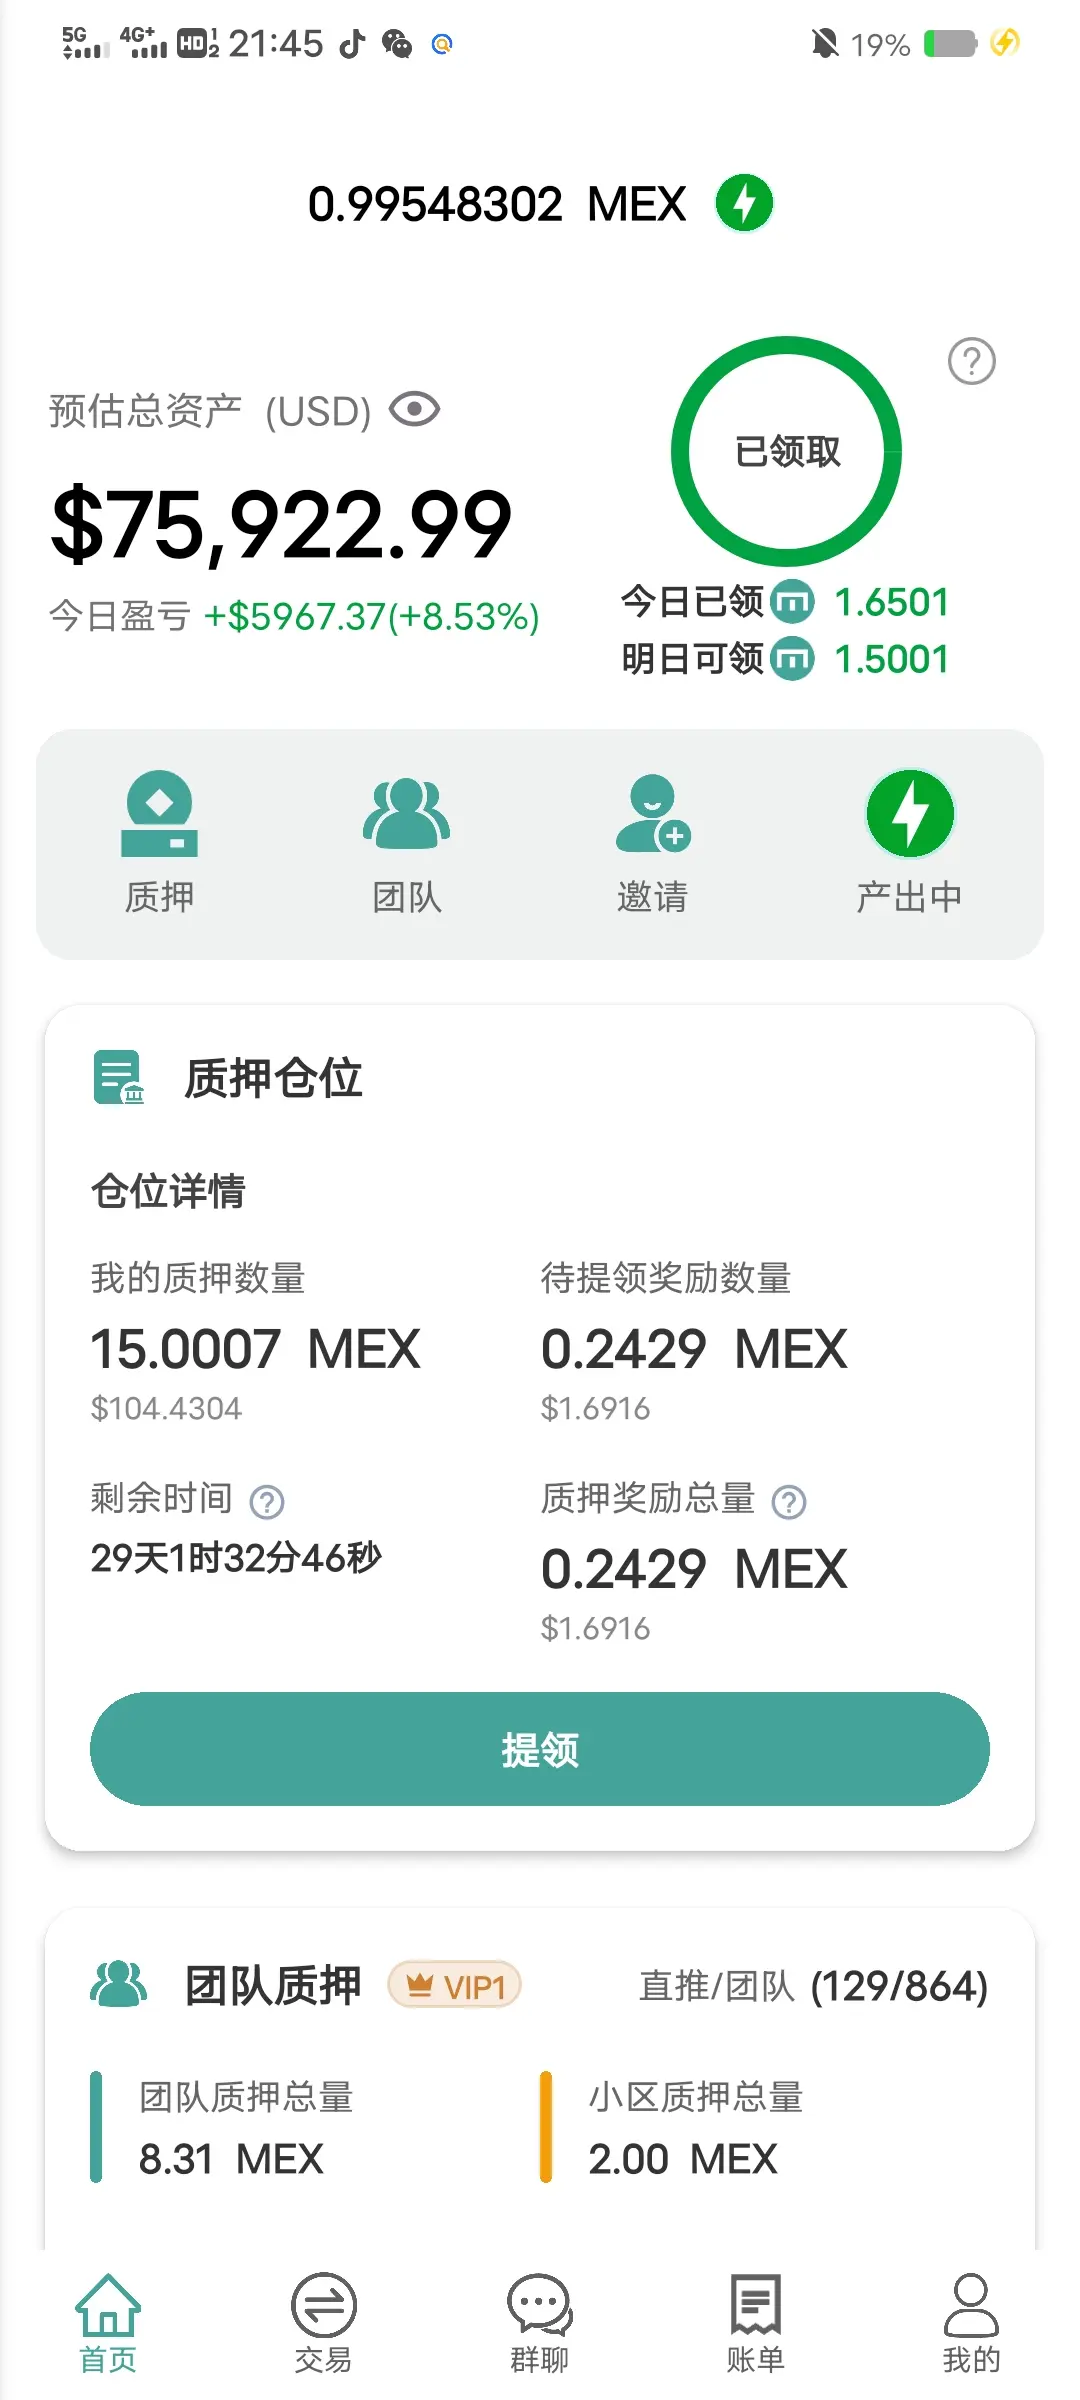
[The user has shared his/her trading data. Go to the App to view more.]
- Reward
- 4
- 12
- Repost
- Share
HighAmbition:
good informationView More
M
玩了个毛
Created By@300UAimsToReach$30,000
Listing Progress
0.07%
MC:
$2.33K
More Tokens
Exclusive channel for TradFi newcomers now open, with up to 500x gold leverage to help seize market opportunities!
Complete a TradFi account opening and instantly receive a 100 USDT newbie bonus
Complete the task within 24 hours of registration to double your reward and upgrade again
Experience Gate TradFi for the first time and immediately unlock dual incentive gameplay, easily accessing real traditional financial markets.
Covering mainstream assets such as gold, forex, indices, commodities, and more, with one-stop efficient trading and real-time market data.
🎯 How to participate
View OriginalComplete a TradFi account opening and instantly receive a 100 USDT newbie bonus
Complete the task within 24 hours of registration to double your reward and upgrade again
Experience Gate TradFi for the first time and immediately unlock dual incentive gameplay, easily accessing real traditional financial markets.
Covering mainstream assets such as gold, forex, indices, commodities, and more, with one-stop efficient trading and real-time market data.
🎯 How to participate

- Reward
- 4
- 1
- Repost
- Share
HighAmbition:
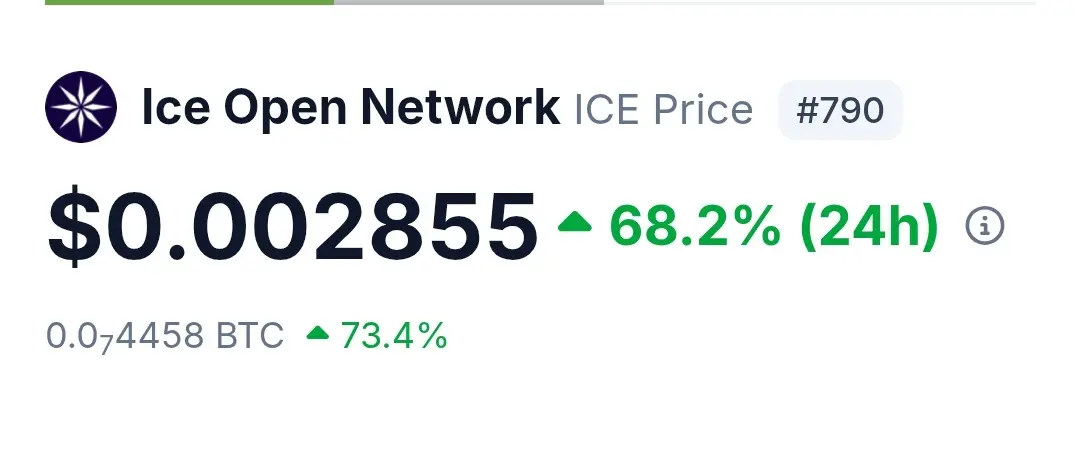
To The Moon 🌕Since the announcement of the ION Listing on March 3.
What's going on??
What's going on??
- Reward
- like
- Comment
- Repost
- Share
⏳ Live-to-Earn | March Round 1 Registration Opens in 6 Hours
A new Gate Live streamer ranking cycle is about to begin.
Registration opens in 6 hours — get ready to start your stream and compete for the leaderboard.
🏆 Monthly Top Streamer Awards
🥇 TOP 1: $100 GT
🥈 TOP 2: $50 GT
🥉 TOP 3: $30 GT
More rewards for active streamers:
⭐ VIP +1 upgrade just for going live
🎫 Traffic coupons
🎁 Position voucher rewards
March rankings are about to start.
Get ready for your first stream.
👉 Registration (opening soon)
https://www.gate.com/campaigns/4159
GT-2.57%

- Reward
- 1
- 2
- Repost
- Share
GateUser-4c904b40 :
:
Jump in 🚀View More
Intraday Bias:Slight bullish tilt unless support fails
487
- Reward
- like
- Comment
- Repost
- Share

- Reward
- like
- Comment
- Repost
- Share
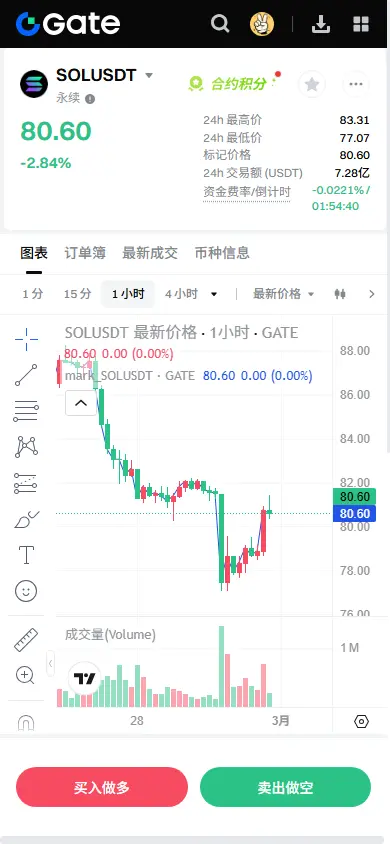
【$SOL Signal】Long - 1H breakout with volume, clear signs of main force supporting the market
$SOL The 1H level has just experienced a volume breakout above EMA20, with momentum strongly returning. The latest 1H candle rose from 78.63 to 81.42, with significantly increased volume. Bid depth around 81.2 shows accumulation, indicating main force support. Although the 4H level is still in consolidation, the latest candle closed with a long lower shadow, testing the strong support at 77.0 and quickly rebounding, indicating the bearish momentum is weakening. In a negative funding rate environment, o
View Original$SOL The 1H level has just experienced a volume breakout above EMA20, with momentum strongly returning. The latest 1H candle rose from 78.63 to 81.42, with significantly increased volume. Bid depth around 81.2 shows accumulation, indicating main force support. Although the 4H level is still in consolidation, the latest candle closed with a long lower shadow, testing the strong support at 77.0 and quickly rebounding, indicating the bearish momentum is weakening. In a negative funding rate environment, o
- Reward
- like
- Comment
- Repost
- Share
pahan
Pahan
Created By@Pahanich
Listing Progress
0.00%
MC:
$2.29K
More Tokens
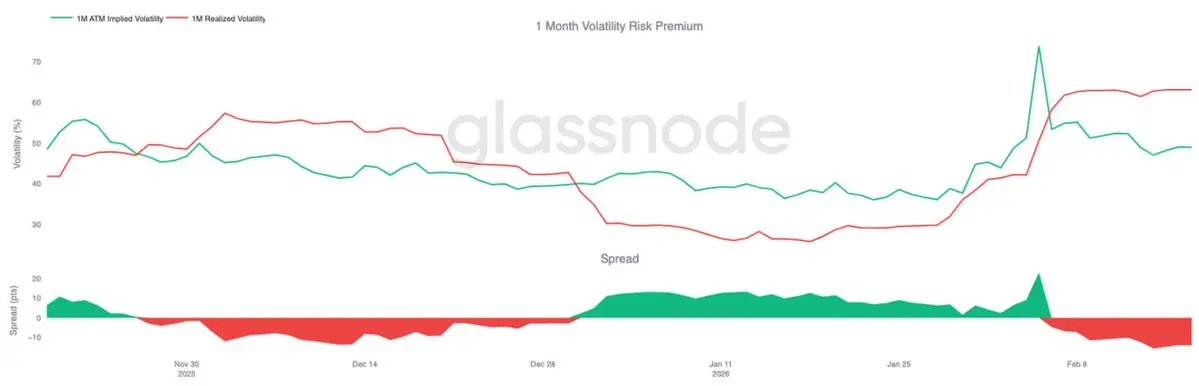
#RealizedVolatility spiked sharply during liquidation phase while #ImpliedVolatility begins retracing as panic hedging fades 📉💪. This divergence typically signals forced #move has largely passed 🔴. Crash hedges unwinding, positioning stabilizing, #RealizedVol likely to moderate as market transitions from reactive flows toward more deliberate positioning ⚡️🎯👀
#crypto
#crypto
- Reward
- 2
- Comment
- Repost
- Share
Crypto Talk with special Guest: Reverse trading strategy. How to find the entry level.
0
- Reward
- 1
- 1
- Repost
- Share
Flower89:
To The Moon 🌕
- Reward
- 1
- Comment
- Repost
- Share
👀 BREAKING: IRAN VOWS NO LENIENCY OR COMPROMISE, SAYS FIGHT WILL CONTINUE UNTIL U.S. AND ISRAEL ARE DEFEATED.

- Reward
- 2
- Comment
- Repost
- Share
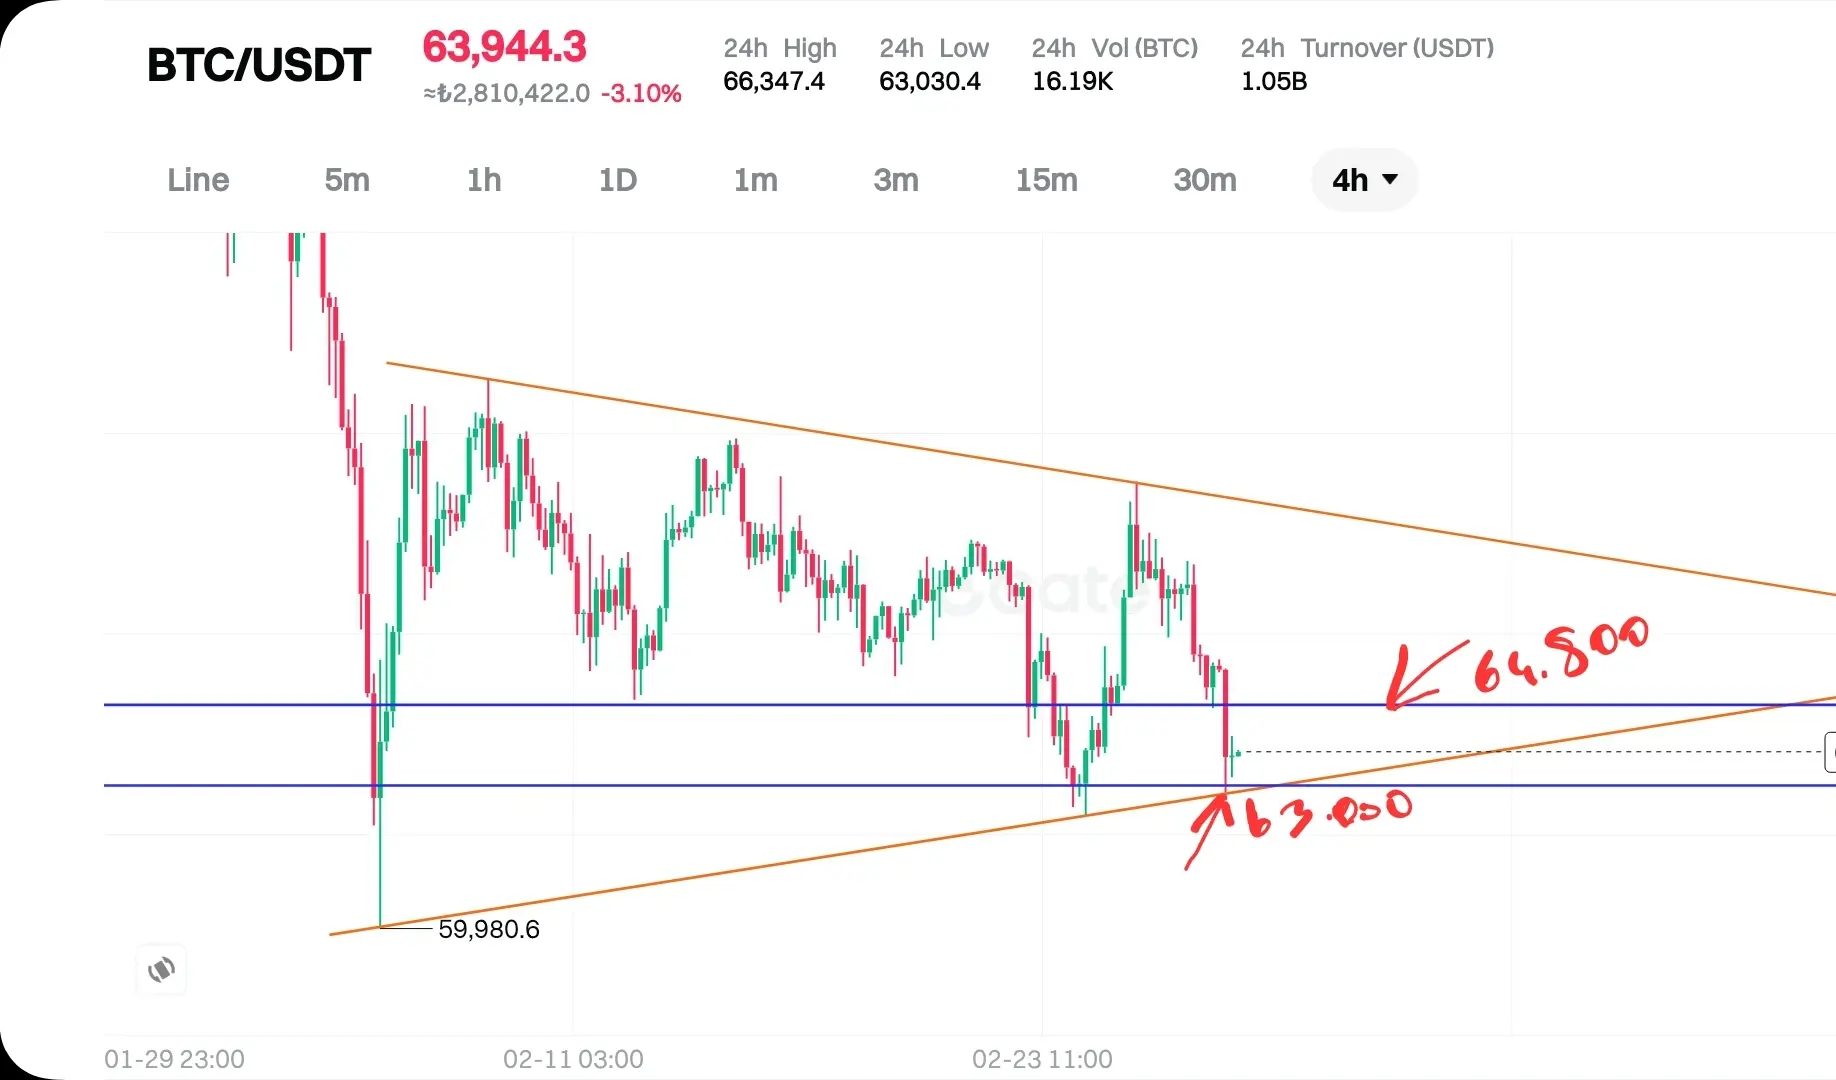
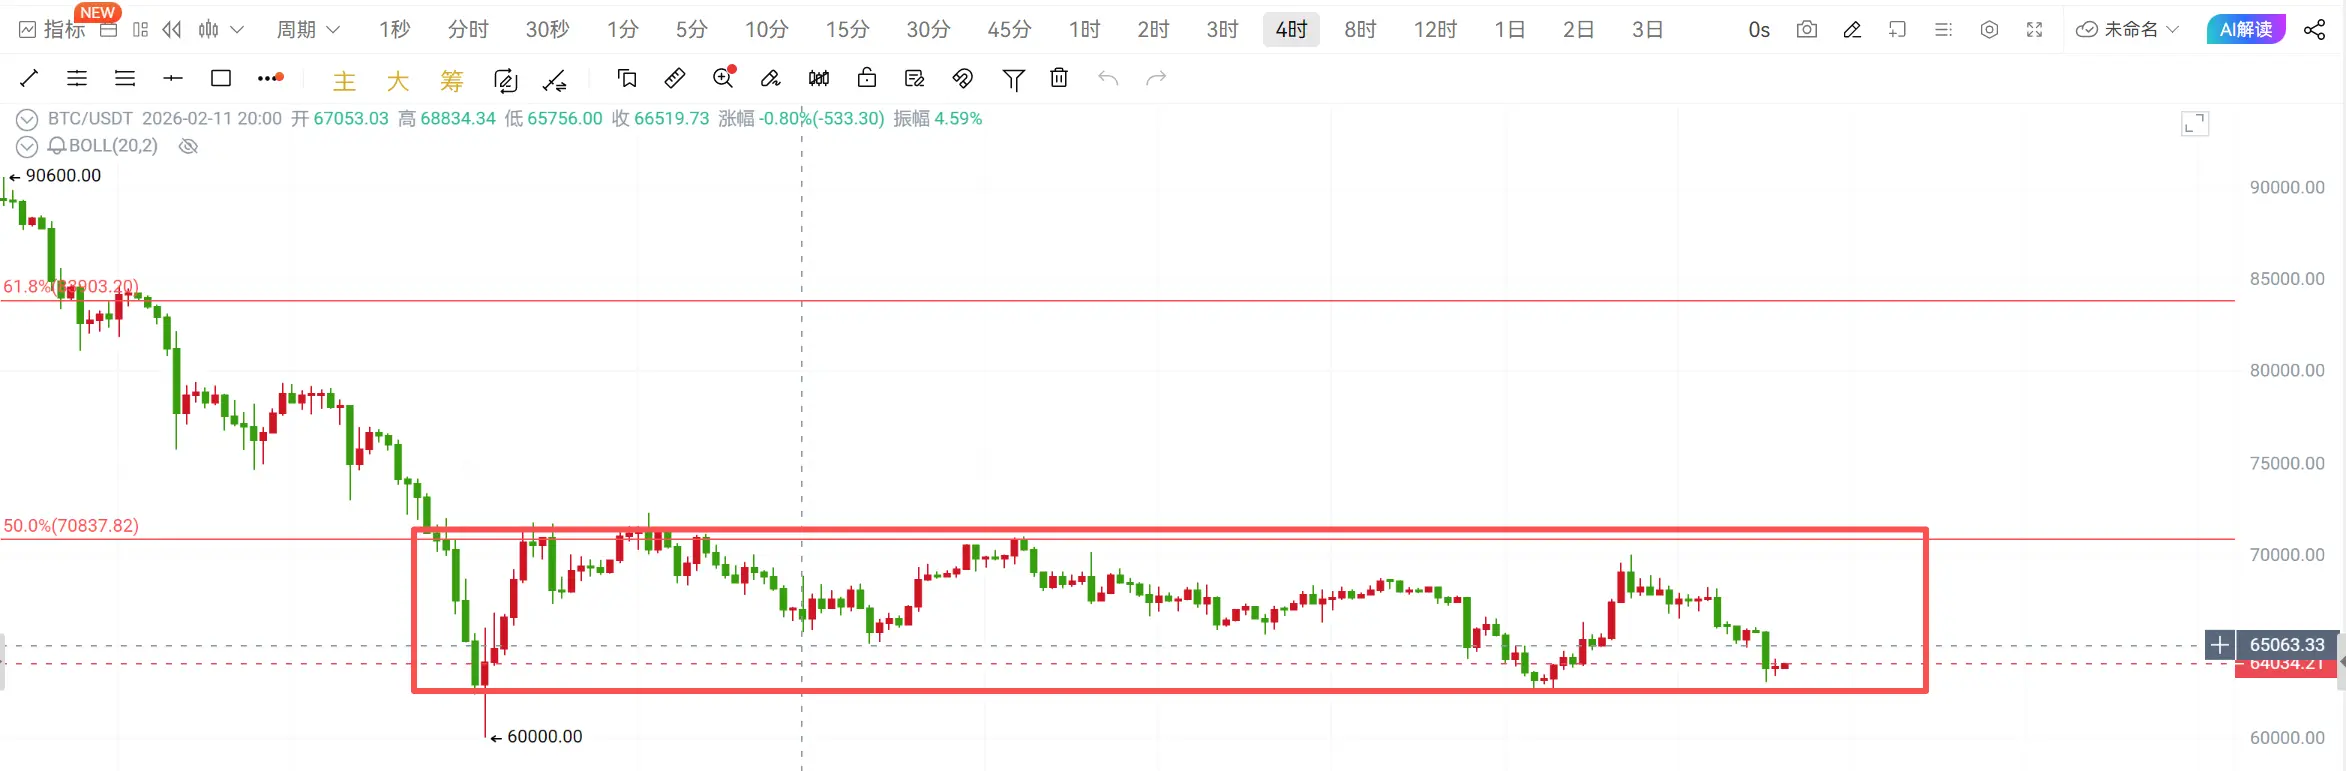
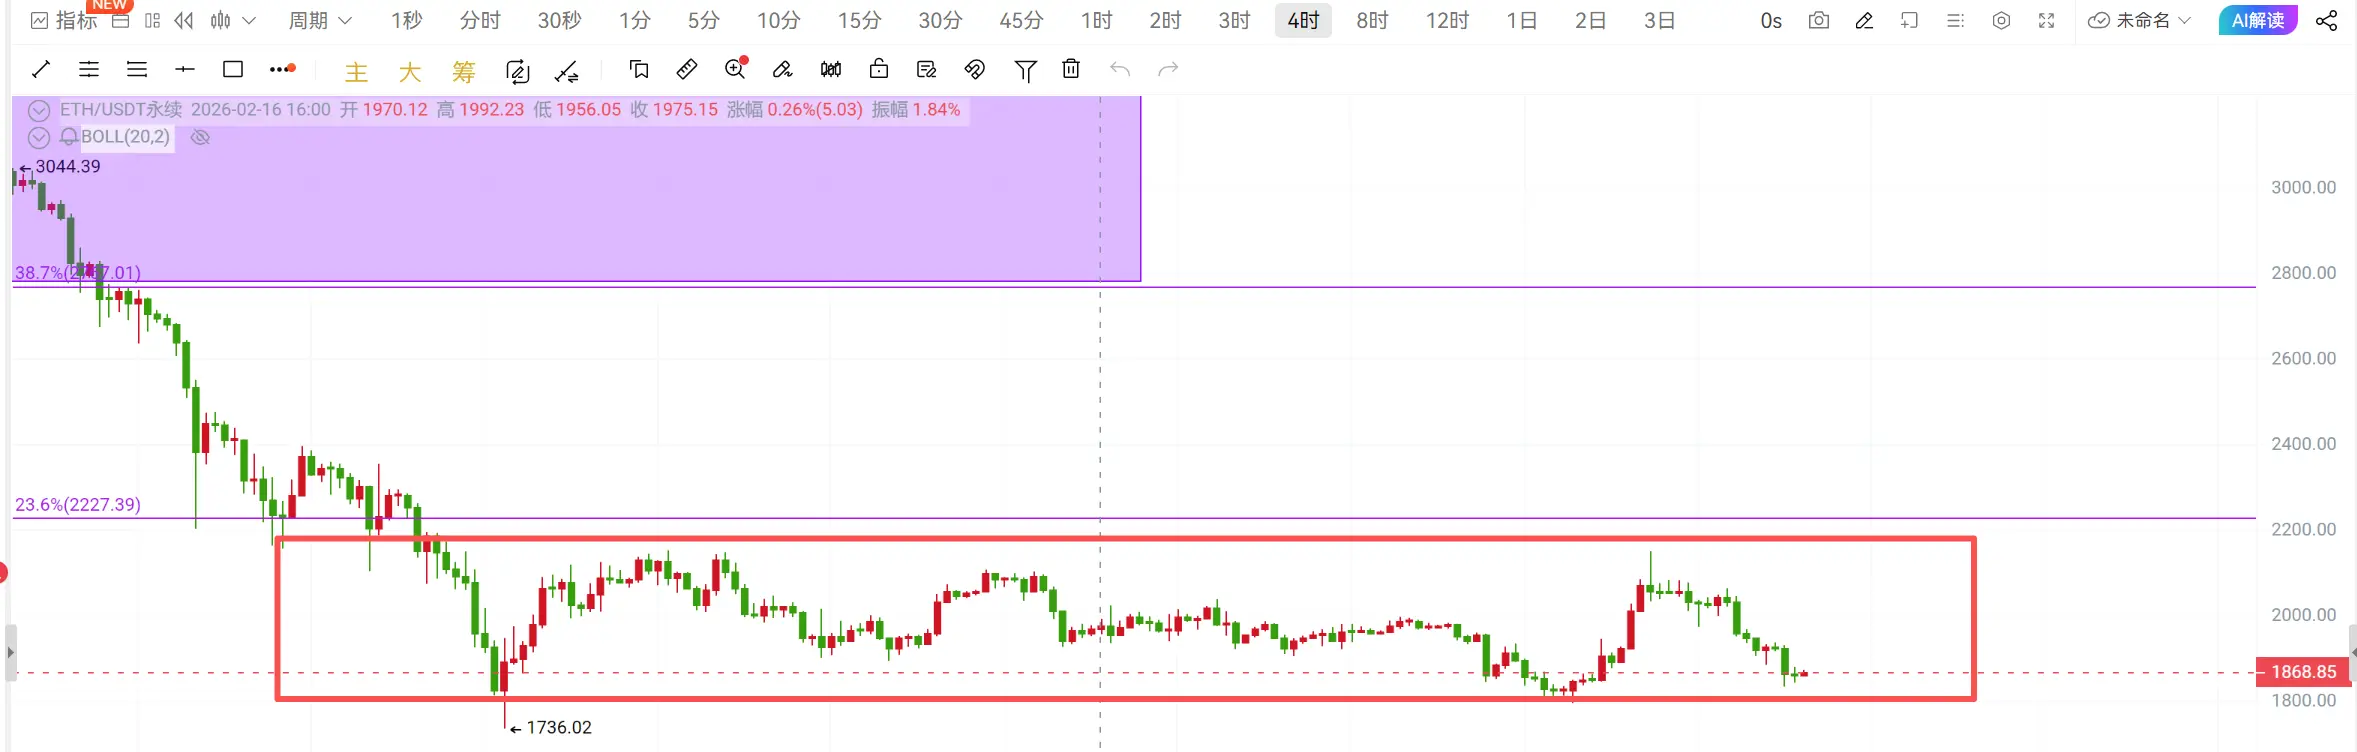
The daily chart shows that Bitcoin is currently testing the support level at 63,000. As previously analyzed, the market is mainly trading within the 71,000-63,000 range, forming a new box structure. After testing the resistance at 70,000-71,000, it began to decline, and the support at 63,000 remains valid. Ethereum's daily chart moves in sync with Bitcoin, rising to 2,150 before starting to fall back, confirming the new box structure of 2,150-1,800. The current resistance levels are 1,930-2,000-2,150, and the support at 1,800 is currently effective.
On the 4-hour chart, the box structure forme
View OriginalOn the 4-hour chart, the box structure forme
- Reward
- 1
- Comment
- Repost
- Share
The war against Iran is a nightmare for crypto holders and a haven for gold investors.
Red Horse and Red Sheep raid, wars erupt in the world, where is the true home in the heart?
#bitcoin #GOLD #八字 #I Ching
Red Horse and Red Sheep raid, wars erupt in the world, where is the true home in the heart?
#bitcoin #GOLD #八字 #I Ching
BTC-1.46%

- Reward
- 1
- Comment
- Repost
- Share
Load More
Join 40M users in our growing community
⚡️ Join 40M users in the crypto craze discussion
💬 Engage with your favorite top creators
👍 See what interests you
Trending Topics
View More42.46M Popularity
151.01K Popularity
96.11K Popularity
1.66M Popularity
490.56K Popularity
Hot Gate Fun
View More- MC:$2.34KHolders:20.00%
- MC:$2.29KHolders:10.00%
- MC:$0.1Holders:10.00%
- MC:$2.34KHolders:20.14%
- MC:$2.33KHolders:20.07%
News
View MoreBTC breaks through 65,000 USDT
23 m
Iran's Minister of Defense and the Commander of the Islamic Revolutionary Guard Corps killed in Israel's attack
26 m
ETH Breaks Through 1900 USDT
28 m
Data: In the past 24 hours, the total liquidation across the network was $452 million, with long positions liquidated at $372 million and short positions at $79.55 million.
46 m
Iran claims that the current missile launches are just inventory clearance and that a series of "never-before-seen mysterious weapons" will soon be deployed.
49 m
Pin