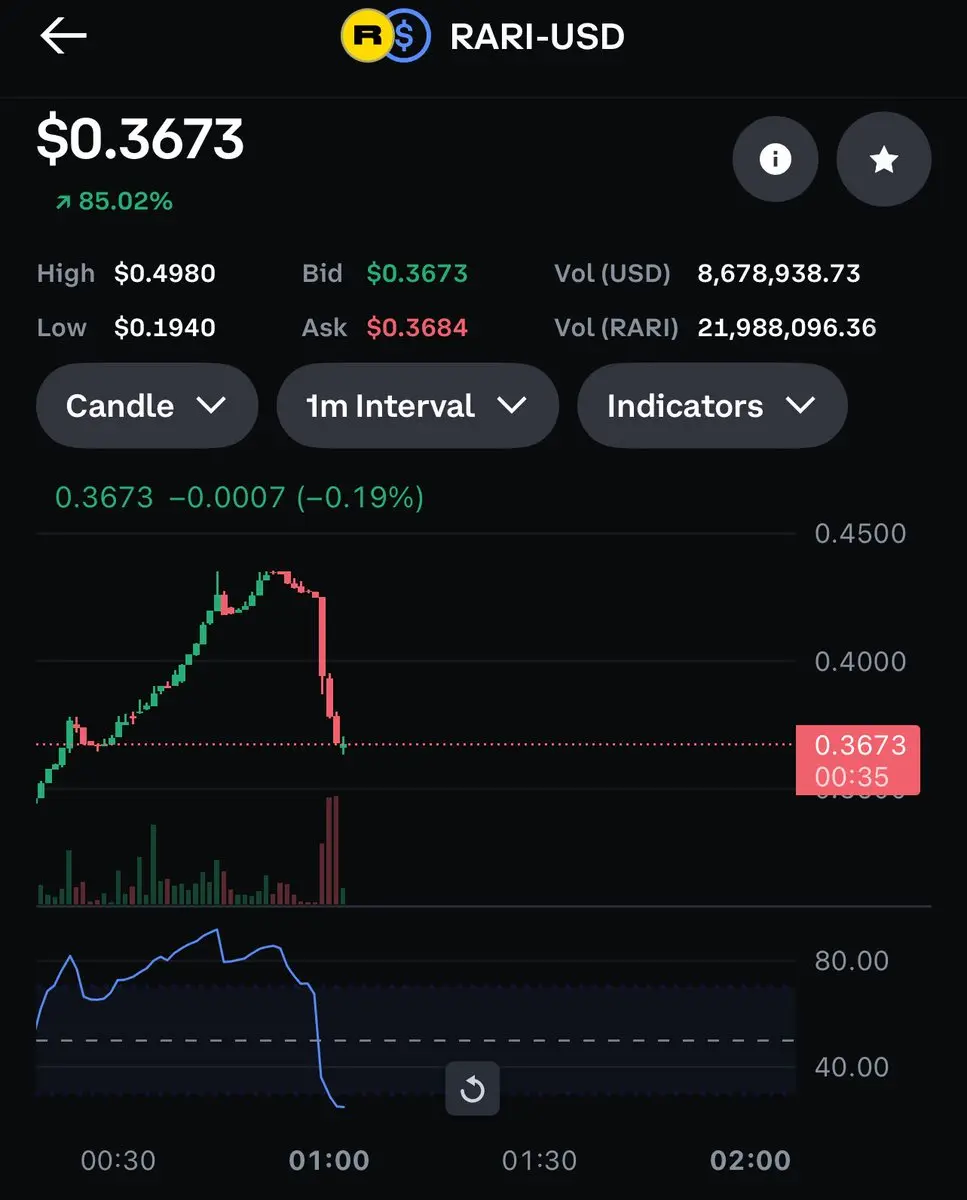
SOL market order! Don't miss out!
Trade
Trading Type
Spot
Trade crypto freely
Pre-Market
Trade new tokens before they are officially listed
Margin
Magnify your profit with leverage
Convert & Block Trading
0 Fees
Trade any size with no fees and no slippage
Alpha
Points
Get promising tokens in streamlined on-chain trading
Leveraged Tokens
Get exposure to leveraged positions simply
Futures
Futures
Hundreds of contracts settled in USDT or BTC
Options
HOT
Trade European-style vanilla options
Unified Account
Maximize your capital efficiency
Demo Trading
Futures Kickoff
Get prepared for your futures trading
Futures Events
Participate in events to win generous rewards
Demo Trading
Use virtual funds to experience risk-free trading
Earn
Launch
CandyDrop
Collect candies to earn airdrops
Launchpool
Quick staking, earn potential new tokens
HODLer Airdrop
Hold GT and get massive airdrops for free
Launchpad
Be early to the next big token project
Alpha Points
NEW
Trade on-chain assets and enjoy airdrop rewards!
Futures Points
NEW
Earn futures points and claim airdrop rewards
Investment
Simple Earn
Earn interests with idle tokens
Auto-Invest
Auto-invest on a regular basis
Dual Investment
Buy low and sell high to take profits from price fluctuations
Soft Staking
Earn rewards with flexible staking
Crypto Loan
0 Fees
Pledge one crypto to borrow another
Lending Center
One-stop lending hub
VIP Wealth Hub
Customized wealth management empowers your assets growth
Private Wealth Management
Customized asset management to grow your digital assets
Quant Fund
Top asset management team helps you profit without hassle
Staking
Stake cryptos to earn in PoS products
Smart Leverage
NEW
No forced liquidation before maturity, worry-free leveraged gains
GUSD Minting
Use USDT/USDC to mint GUSD for treasury-level yields
More
Promotions
Activity Center
Join activities and win big cash prizes and exclusive merch
Referral
20 USDT
Earn 40% commission or up to 500 USDT rewards
Announcements
Announcements of new listings, activities, upgrades, etc
Gate Blog
Crypto industry articles
VIP Services
Huge fee discounts
Proof of Reserves
Gate promises 100% proof of reserves
GateUser-2120ce8c
- Reward
- like
- Comment
- Repost
- Share
- Reward
- like
- Comment
- Repost
- Share
🎨 Gate AI Creation Contest | One Sentence, Draw Your 2026 On Gate Square, anyone can be a visual creator — truly zero barriers to entry. With just one sentence, generate an image and bring your vision of 2026 to life. Create and post your work using Gate Square AI Creation for a chance to win the Gate Year of the Horse New Year Gift Box.
📅 Duration Dec 17, 2025, 10:00 – Jan 3, 2026, 18:00 UTC 🎯
How to Join
1. Go to Gate Square → Create Post → AI Creation
2. Enter one sentence to generate your image
3. Post with #GateAICreation
🏆 Rewards 5 winners: Gate Year of the Horse
📅 Duration Dec 17, 2025, 10:00 – Jan 3, 2026, 18:00 UTC 🎯
How to Join
1. Go to Gate Square → Create Post → AI Creation
2. Enter one sentence to generate your image
3. Post with #GateAICreation
🏆 Rewards 5 winners: Gate Year of the Horse


- Reward
- 9
- 6
- Repost
- Share
AylaShinex :
:
Merry Christmas ⛄View More
- Reward
- like
- 1
- Repost
- Share
GreeG:
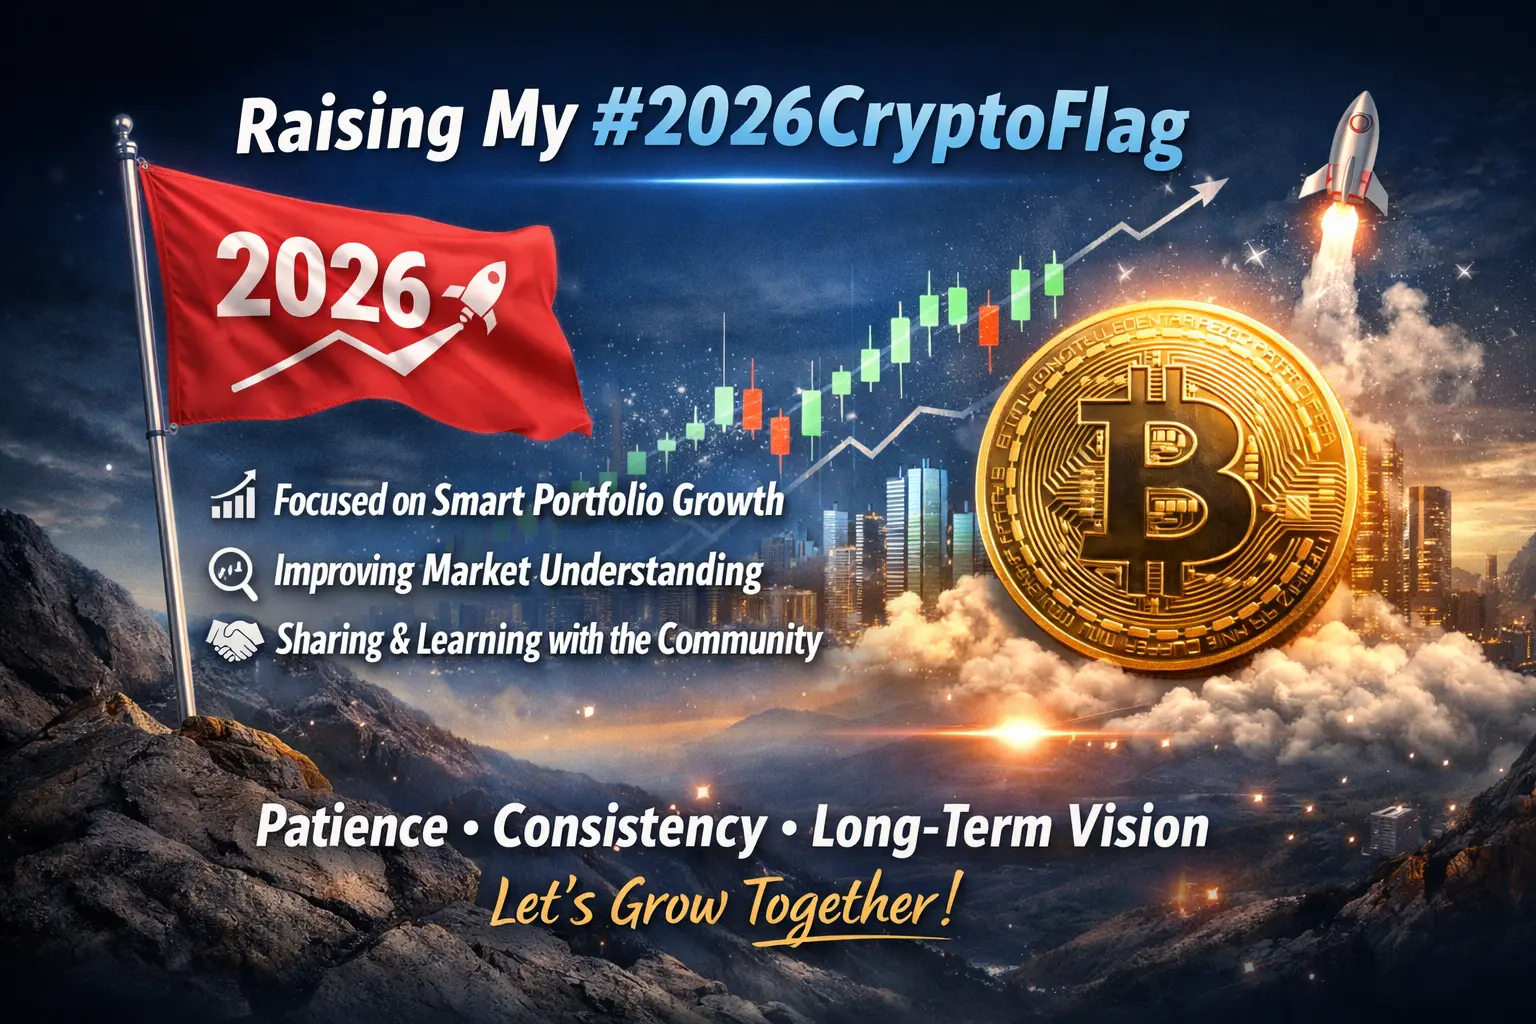
what if it'll go to 70k✨ My #2026CryptoFlag on Gate Square 🚩
2026 is the year I focus on clarity, consistency, and smart growth in crypto. My goal is not fast gains, but sustainable progress through disciplined investing and well-planned strategies. I plan to strengthen my portfolio with strong fundamentals, improve risk management, and learn deeper market structure and trend analysis.
Beyond trading, I aim to actively contribute on Gate Square by sharing honest insights, market observations, and positive discussions that help the community grow together. Learning never stops, and in 2026 I choose knowledge, patien

- Reward
- 2
- 4
- Repost
- Share
MagicCultTenElders:
Merry Christmas, let's get bullish! 🐂View More
Relive a year in crypto—riding the market highs and taking bold leaps. Every moment counts. Check your #2025 Gate Year-End Summary now, recap your 2025 crypto adventure with Gate, and get 20 USDT through sharing. https://www.gate.com/ru/competition/your-year-in-review-2025?ref=VLEWU1HABW&ref_type=126&shareUid=VlZBV1pfAwIO0O0O
- Reward
- 3
- 1
- Repost
- Share
CatAndMouse1 :
:
Christmas Bull Run! 🐂- Reward
- 1
- Comment
- Repost
- Share
First profit-taking order, reducing position with stop-loss in the overall layout
View Original- Reward
- 1
- Comment
- Repost
- Share
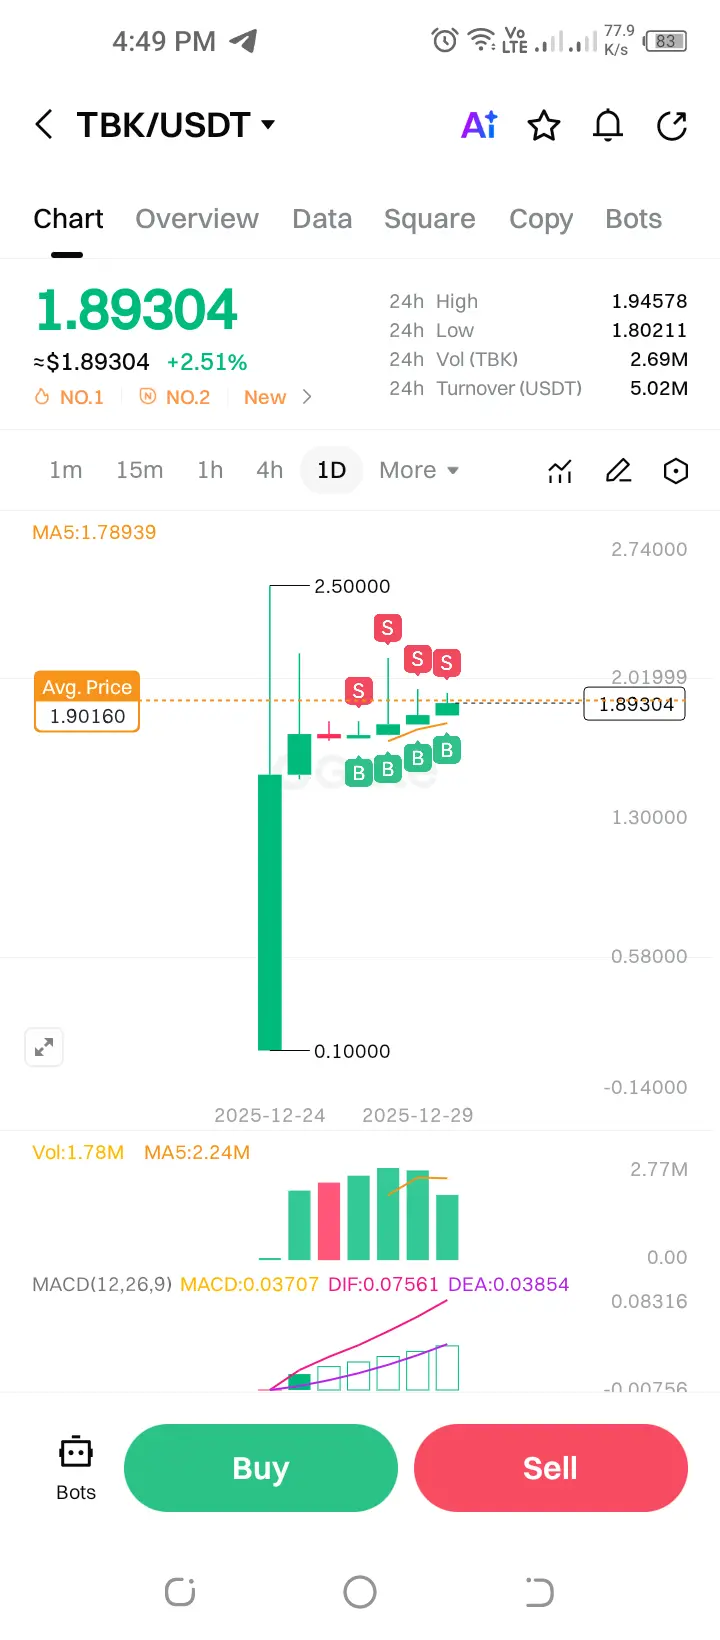
TBK/USDT — Watching Structure Closely
TBK is holding around 1.89 after a strong expansion move. Price is consolidating above key moving averages on both 1H & 1D, which usually signals digestion, not weakness.
🔹 Higher lows forming
🔹 Volume cooling after expansion
🔹 MACD still constructive
As long as price holds this range, continuation remains on the table. Break above recent highs could bring volatility back.
Patience phase before the next move.
What’s your view on TBK from here — continuation or deeper pullback?
#TBK #Altcoins #MarketStructure #GateSquare #CryptoLens
TBK1,96%
- Reward
- like
- Comment
- Repost
- Share
You don't have to be perfect; I like you just the way you are. I'm not perfect, but as long as you don't mind, that's enough.
View Original


- Reward
- like
- Comment
- Repost
- Share
Good morning! gate fun is ranked first, keep it up!
View Original


- Reward
- 1
- Comment
- Repost
- Share
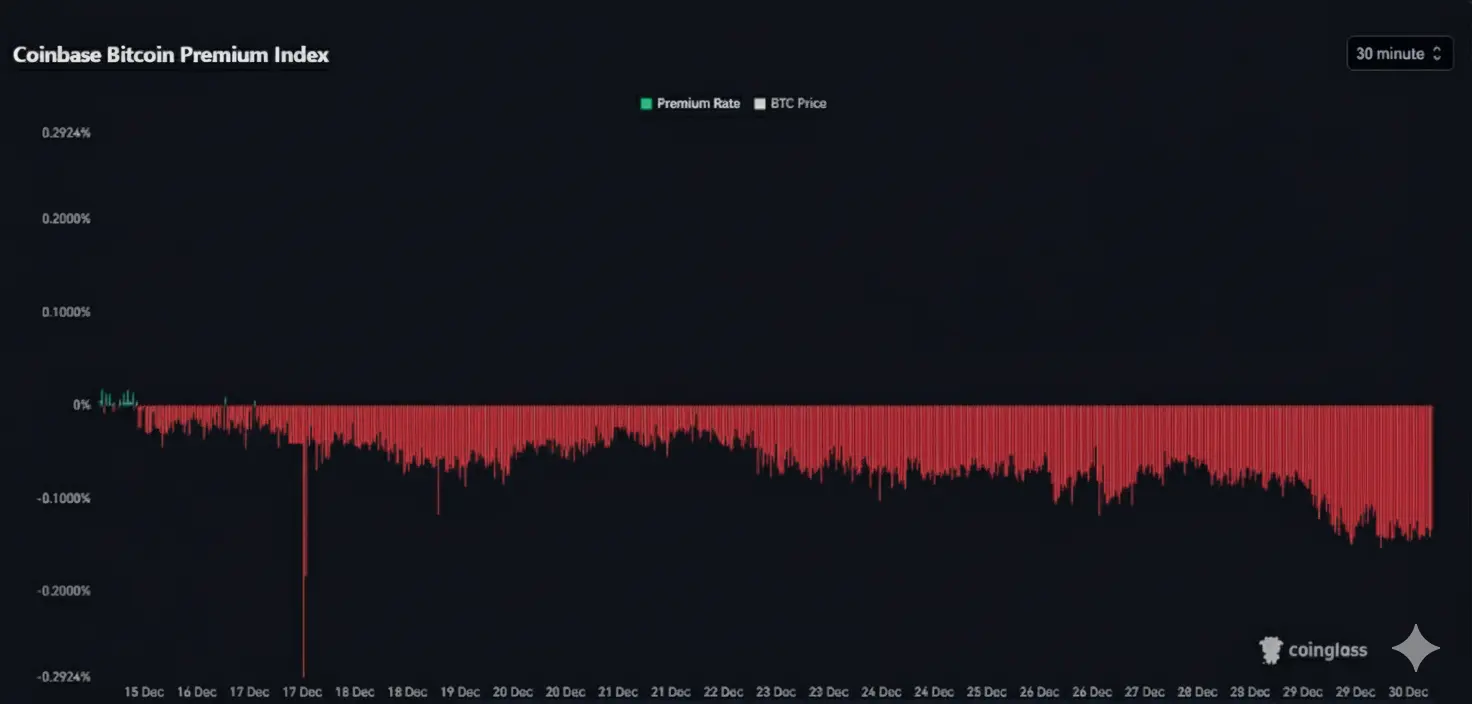
Coinbase Bitcoin premium is showing no signs of recovery.
Institutions are still selling $BTC aggressively.
#BTCMarketAnalysis
Institutions are still selling $BTC aggressively.
#BTCMarketAnalysis
BTC1,01%
- Reward
- like
- Comment
- Repost
- Share
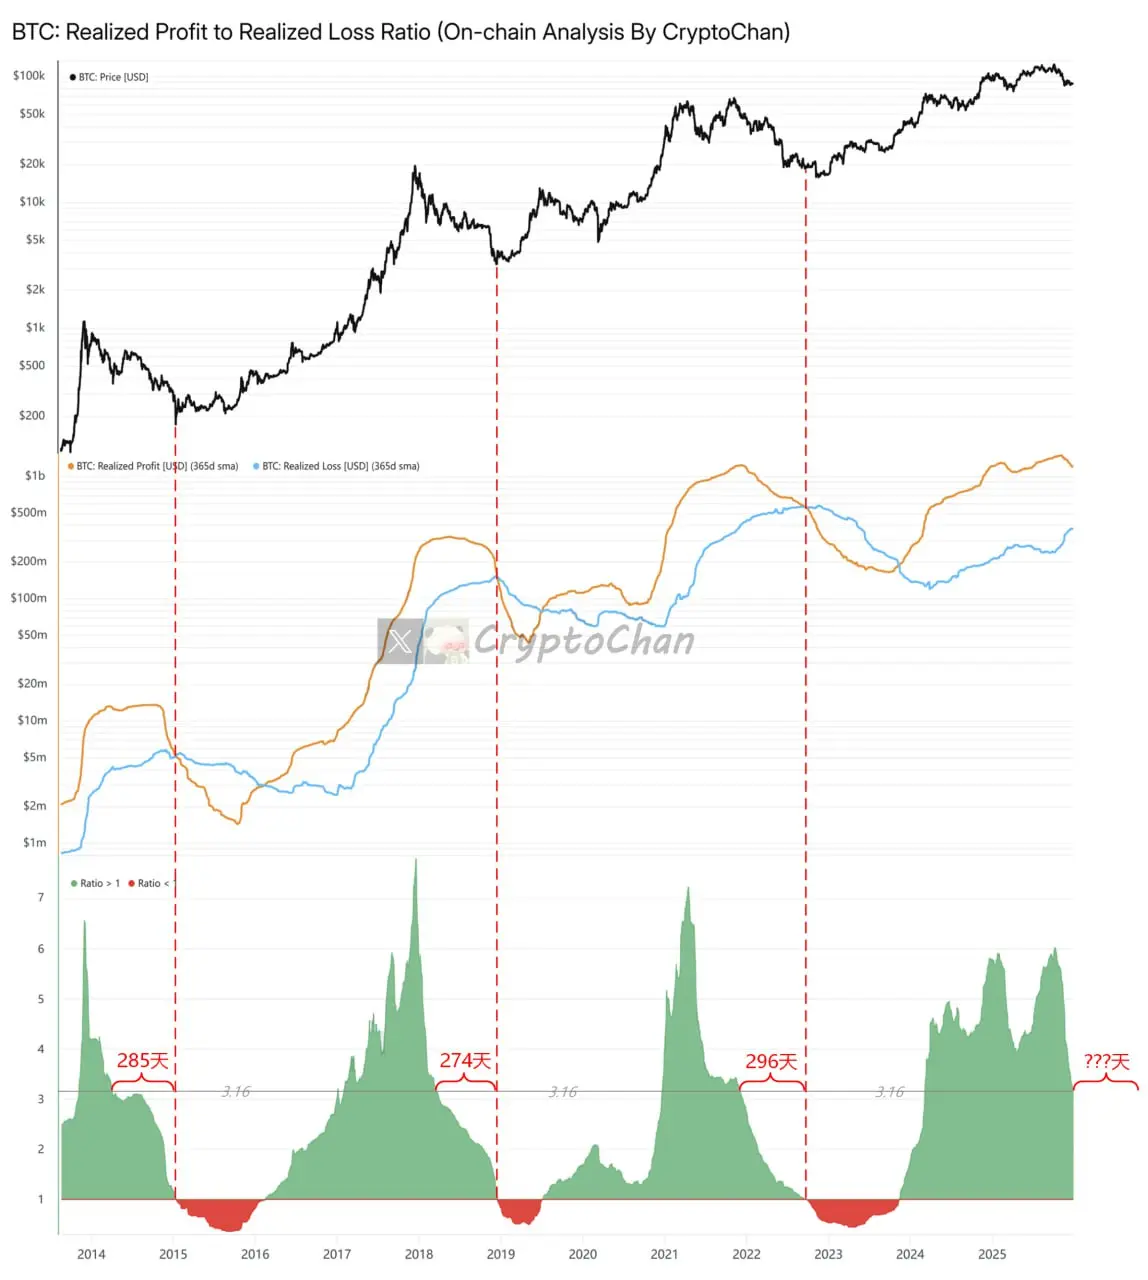
The current indicator in the chart has dropped to 3.16
In 2014, this indicator fell from 3.16 to 1 over 285 days
In 2018, this indicator fell from 3.16 to 1 over 274 days
In 2022, this indicator fell from 3.16 to 1 over 296 days
The upper part of the chart shows the #BTC price;
The middle part of the chart shows Bitcoin realized profit (365-day MA) and Bitcoin realized loss (365-day MA);
The lower part of the chart shows the ratio of Bitcoin realized profit (365-day MA) to Bitcoin realized loss (365-day MA), also known as the “Realized Profit and Loss Ratio (365-day MA)”
This ratio compares t
BTC1,01%
- Reward
- like
- Comment
- Repost
- Share
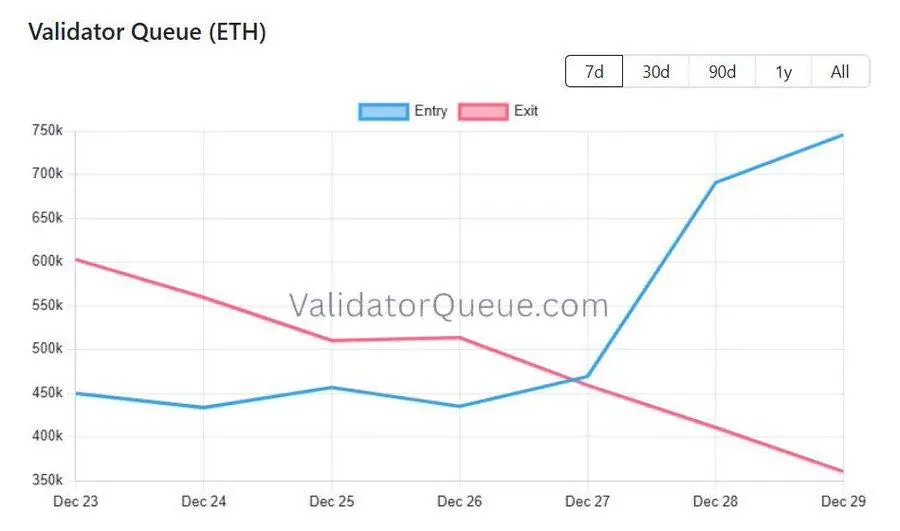
The queue size for Ethereum validators has for the first time in six months risen to approximately twice the size of the exit queue. This data signal confirms that Ethereum's staking demand is beginning to recover. According to ValidatorQueue data, the recent increase in staking demand is partly driven by the strategic deployment of leading digital asset management institutions like BitMine, and is also likely benefited by the positive support from the Pectra upgrade. $ETH #2025Gate年度账单
ETH1,27%
- Reward
- like
- Comment
- Repost
- Share
Reflecting on this year's crypto journey—from market surges to bold moves, every step is worth remembering. Check your #2025Gate年度账单 now, and relive your 2025 crypto journey with Gate. Share to receive 20 USDT. https://www.gate.com/zh/competition/your-year-in-review-2025?ref=VQJHB1TBBG&ref_type=126&shareUid=U1dHUlBaCQMO0O0O
View Original
- Reward
- like
- Comment
- Repost
- Share
🔥 Eye of the Storm! China cleared U.S. bonds to the 17-year freezing point, and Japan and Britain swept goods frantically! The global currency secret war is a complete showdown!💥
The latest data detonated the financial circle💣: China dumped another 11.8 billion U.S. bonds in a single month, and the total holdings were shocked by the historical bottom of $688.7 billion, only half of Japan's debt holdings!📉
🌪Strangely—
Japan increased its position to $1.2 trillion, and the United Kingdom jumped to second place in the world with 155.1 billion. The Eastern giant ship turned around and left, t
View OriginalThe latest data detonated the financial circle💣: China dumped another 11.8 billion U.S. bonds in a single month, and the total holdings were shocked by the historical bottom of $688.7 billion, only half of Japan's debt holdings!📉
🌪Strangely—
Japan increased its position to $1.2 trillion, and the United Kingdom jumped to second place in the world with 155.1 billion. The Eastern giant ship turned around and left, t

- Reward
- like
- Comment
- Repost
- Share
New Version, Worth Being Seen! #GateAPPRefreshExperience
🎁 Gate APP has been updated to the latest version v8.0.5. Share your authentic experience on Gate Square for a chance to win Gate-exclusive Christmas gift boxes and position experience vouchers.
How to Participate:
1. Download and update the Gate APP to version v8.0.5
2. Publish a post on Gate Square and include the hashtag: #GateAPPRefreshExperience
3. Share your real experience with the new version, such as:
Key new features and optimizations
App smoothness and UI/UX changes
Improvements in trading or market data experience
Your fa

- Reward
- 22
- 29
- 3
- Share
Bagol3739:
Paying Close Attention🔍View More
Check out Gate and join me in the hottest event! https://www.gate.com/campaigns/3649?ref=VQISBL9ZVQ&ref_type=132
- Reward
- 1
- 1
- Repost
- Share
Discovery:
Merry Christmas ⛄
Load More
Join 40M users in our growing community
⚡️ Join 40M users in the crypto craze discussion
💬 Engage with your favorite top creators
👍 See what interests you
Trending Topics
View More5.41K Popularity
158.66K Popularity
29.91K Popularity
80.33K Popularity
1.78K Popularity
Hot Gate Fun
View More- MC:$3.57KHolders:10.00%
- MC:$3.55KHolders:10.00%
- MC:$3.56KHolders:10.00%
- MC:$3.61KHolders:20.04%
- MC:$3.56KHolders:10.00%
News
View MoreThe Federal Reserve meeting minutes signal a cautious dovish stance, considering further interest rate cuts
7 m
After the Federal Reserve meeting minutes were released, the US Dollar Index (DXY) rose slightly.
41 m
Federal Reserve meeting minutes, participants believe the reserve balance has fallen to an adequate level
42 m
Federal Reserve Meeting Minutes: Most Participants Support Rate Cut in December
45 m
Data: Approximately 94% of global stock markets remain above the 200-day moving average, with equity investment heating up
3 h
Pin