BITCOIN TRADE & MARKET UPDATE
This is exactly how markets test traders.
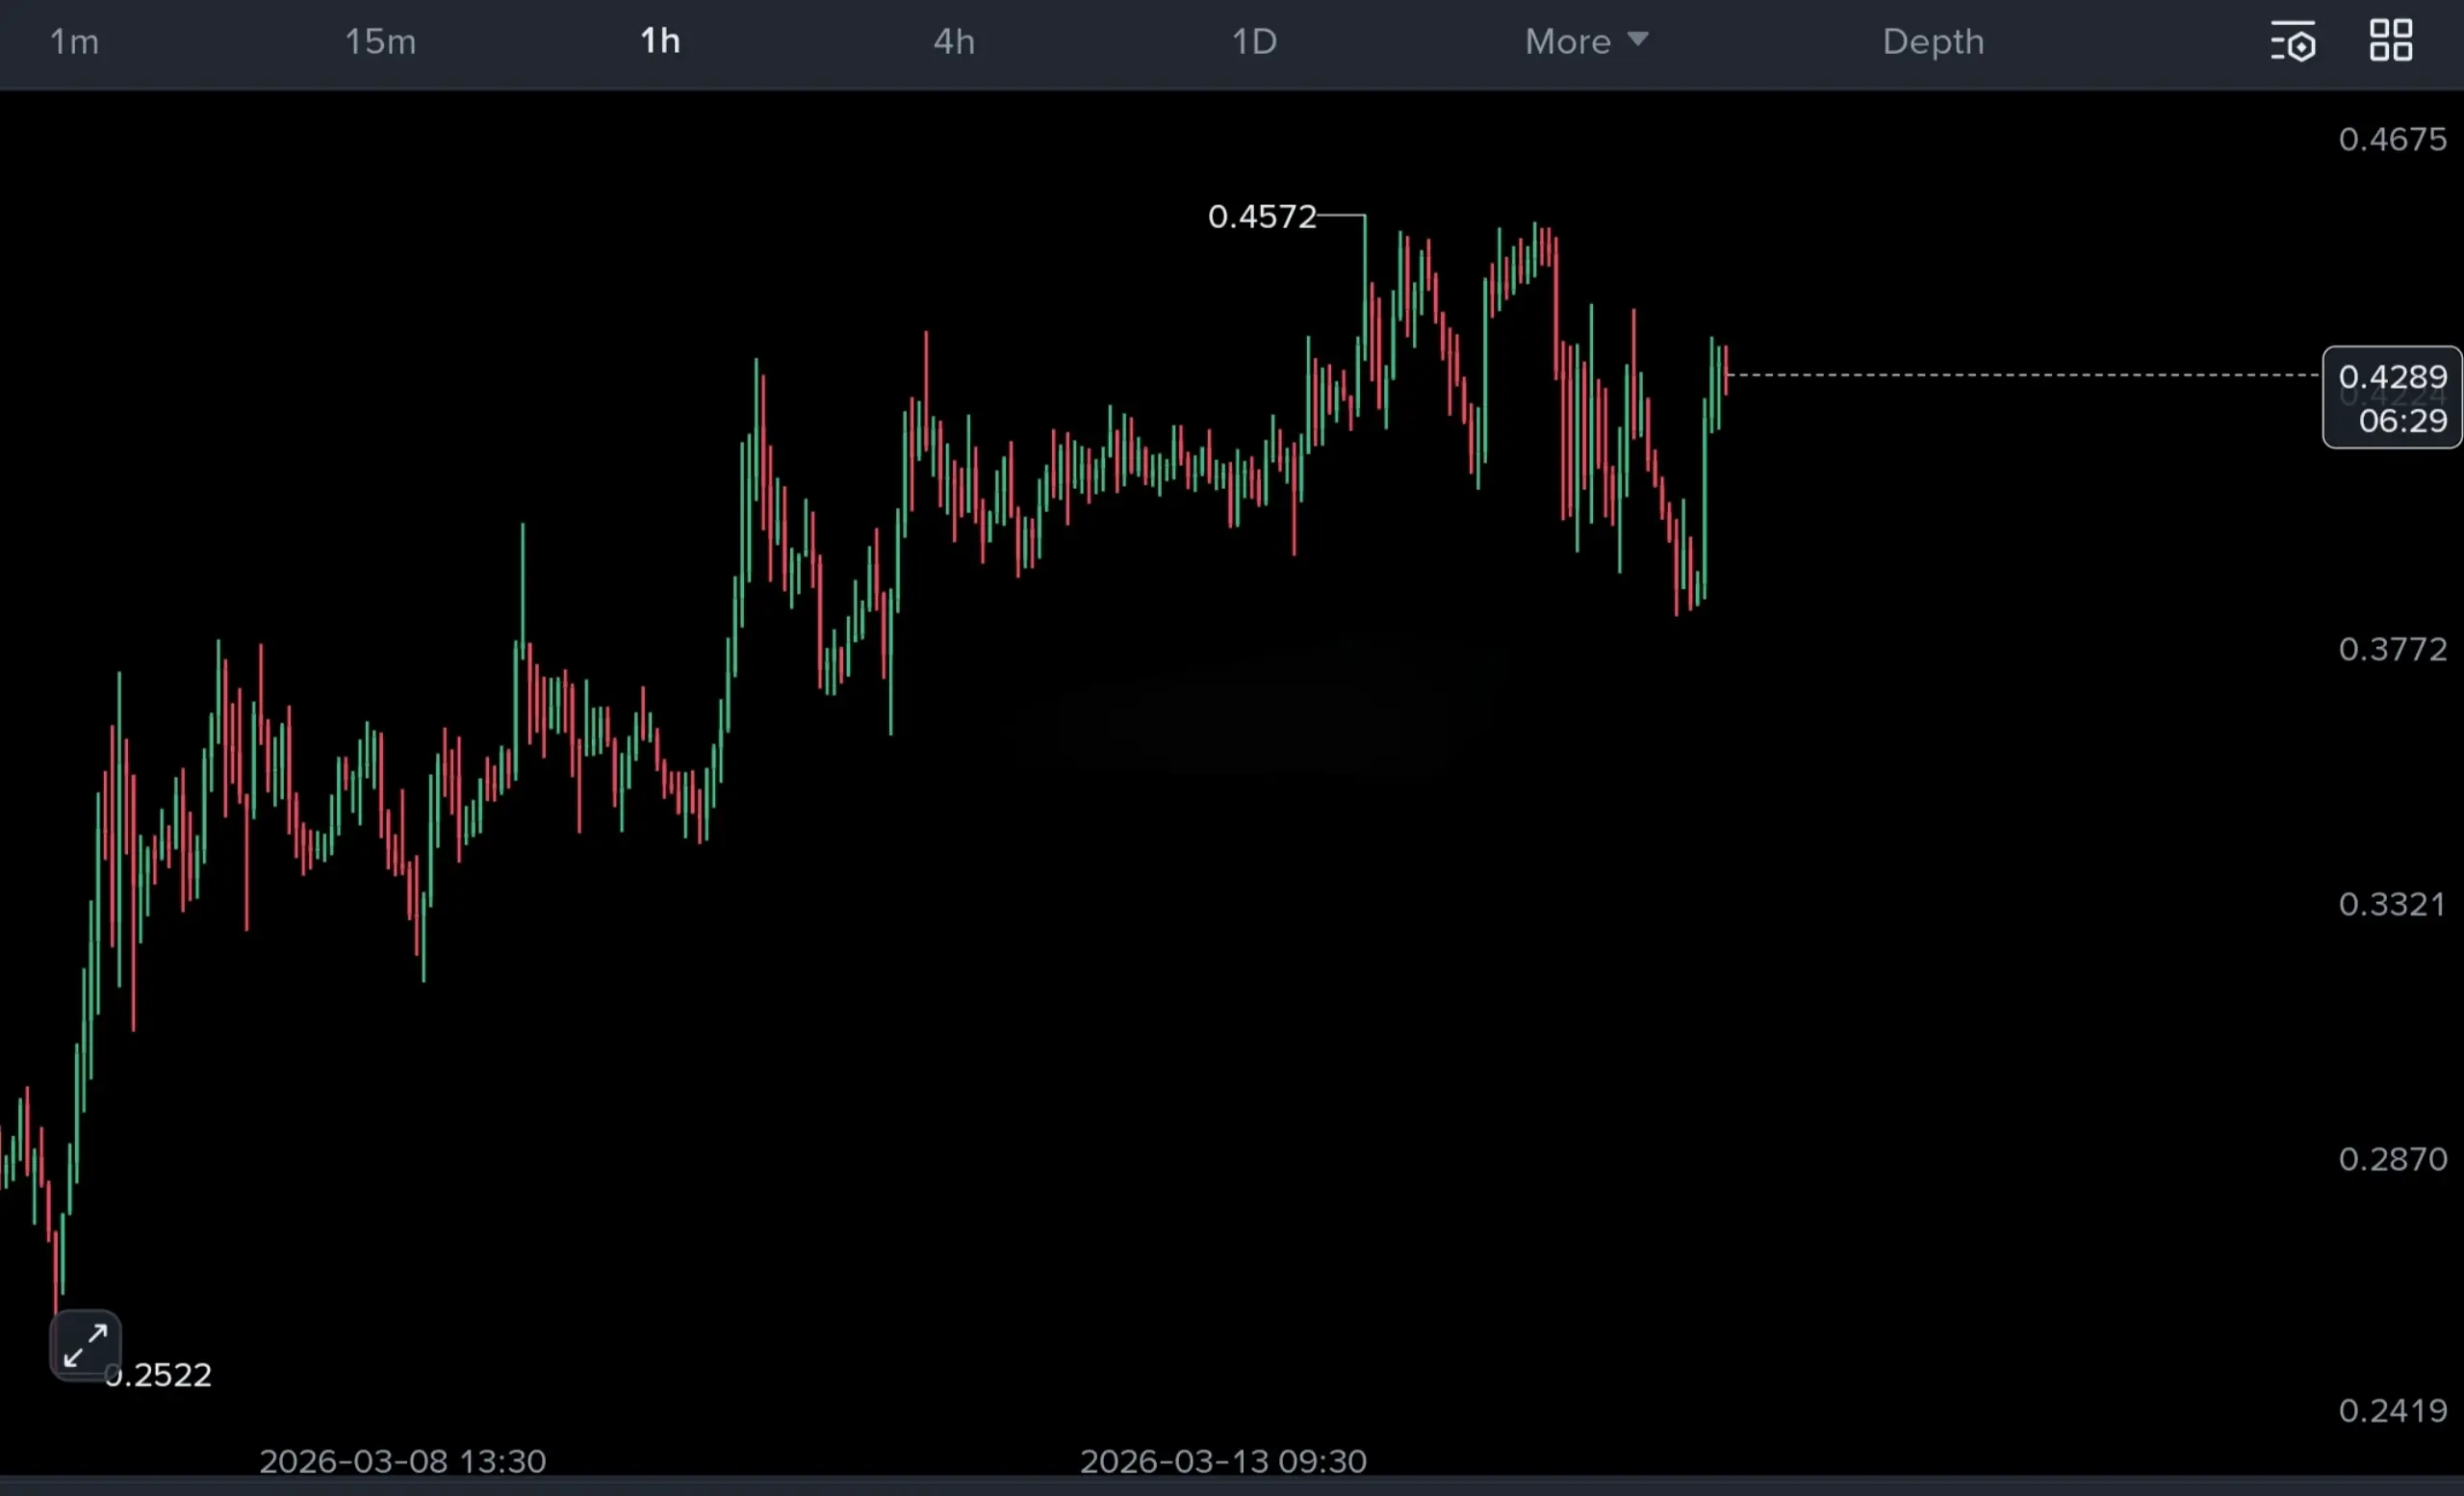
We read charts, draw structures, identify support and resistance, and build a trading plan based on probability and market sentiment at that moment. Most of the time those levels work perfectly — but sometimes the market pushes slightly beyond them before moving in the expected direction.
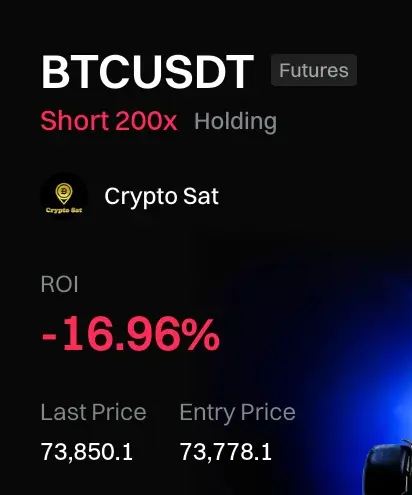
Our $BTC short setup was a perfect example of that scenario.
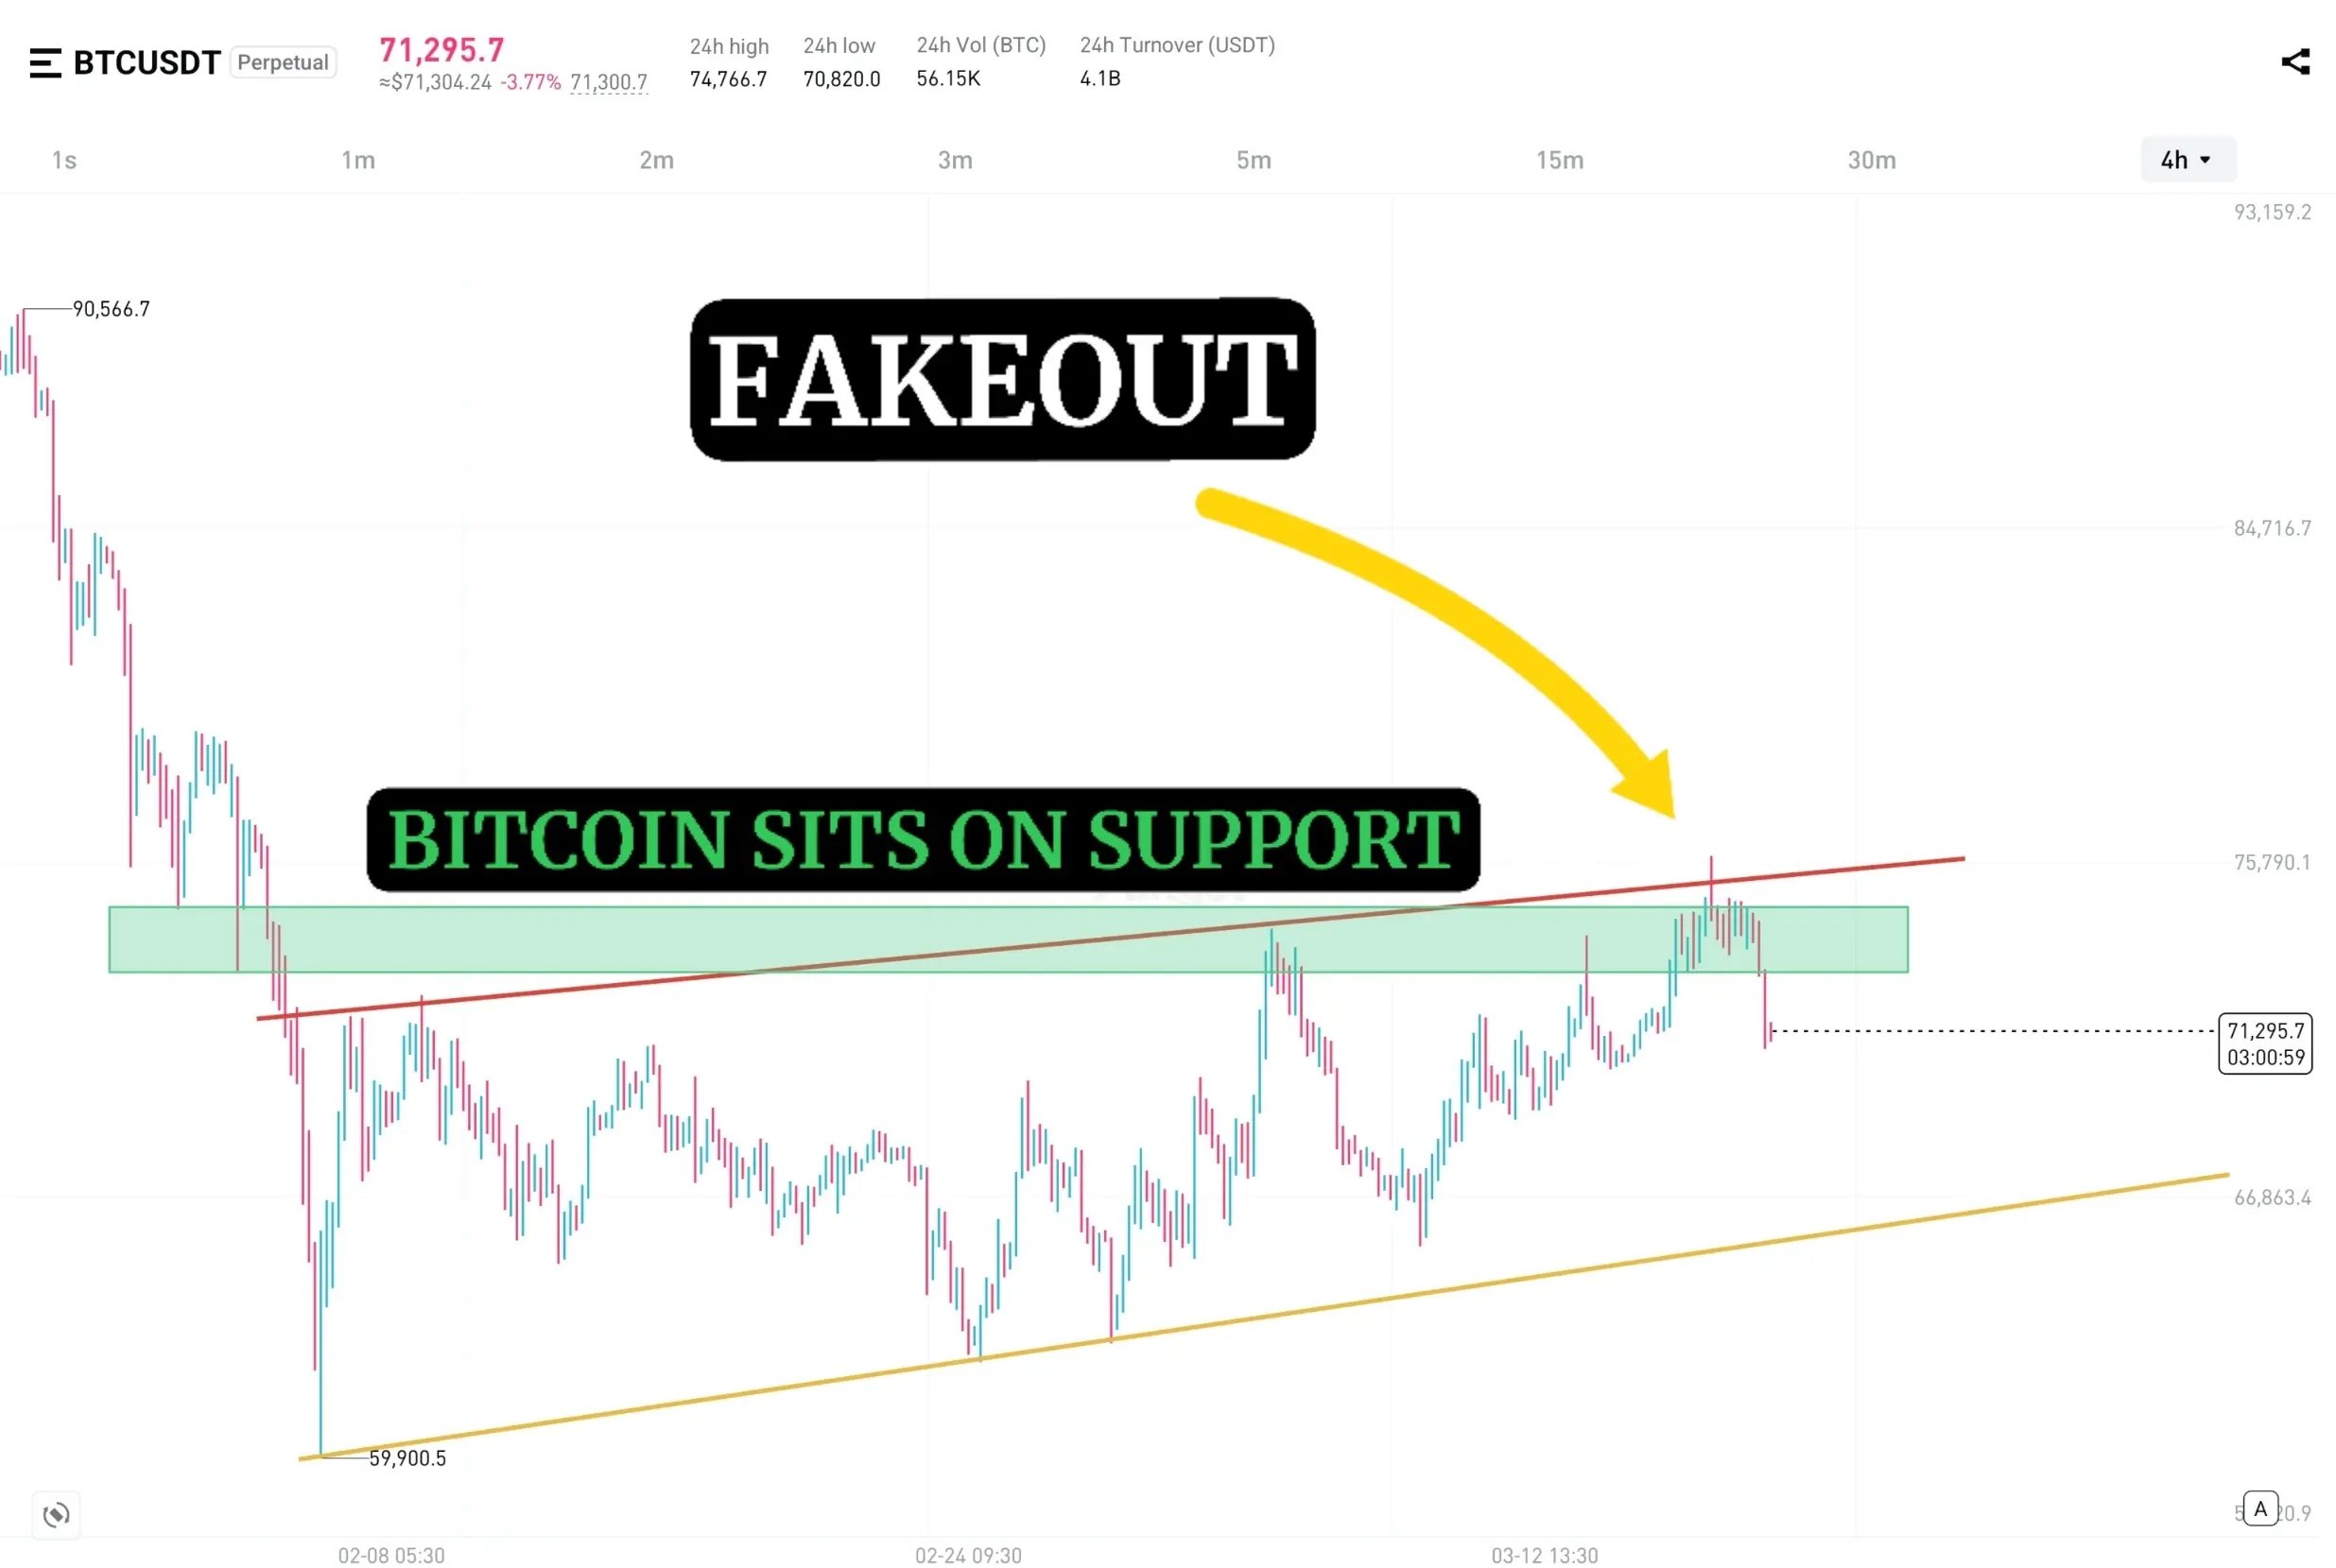
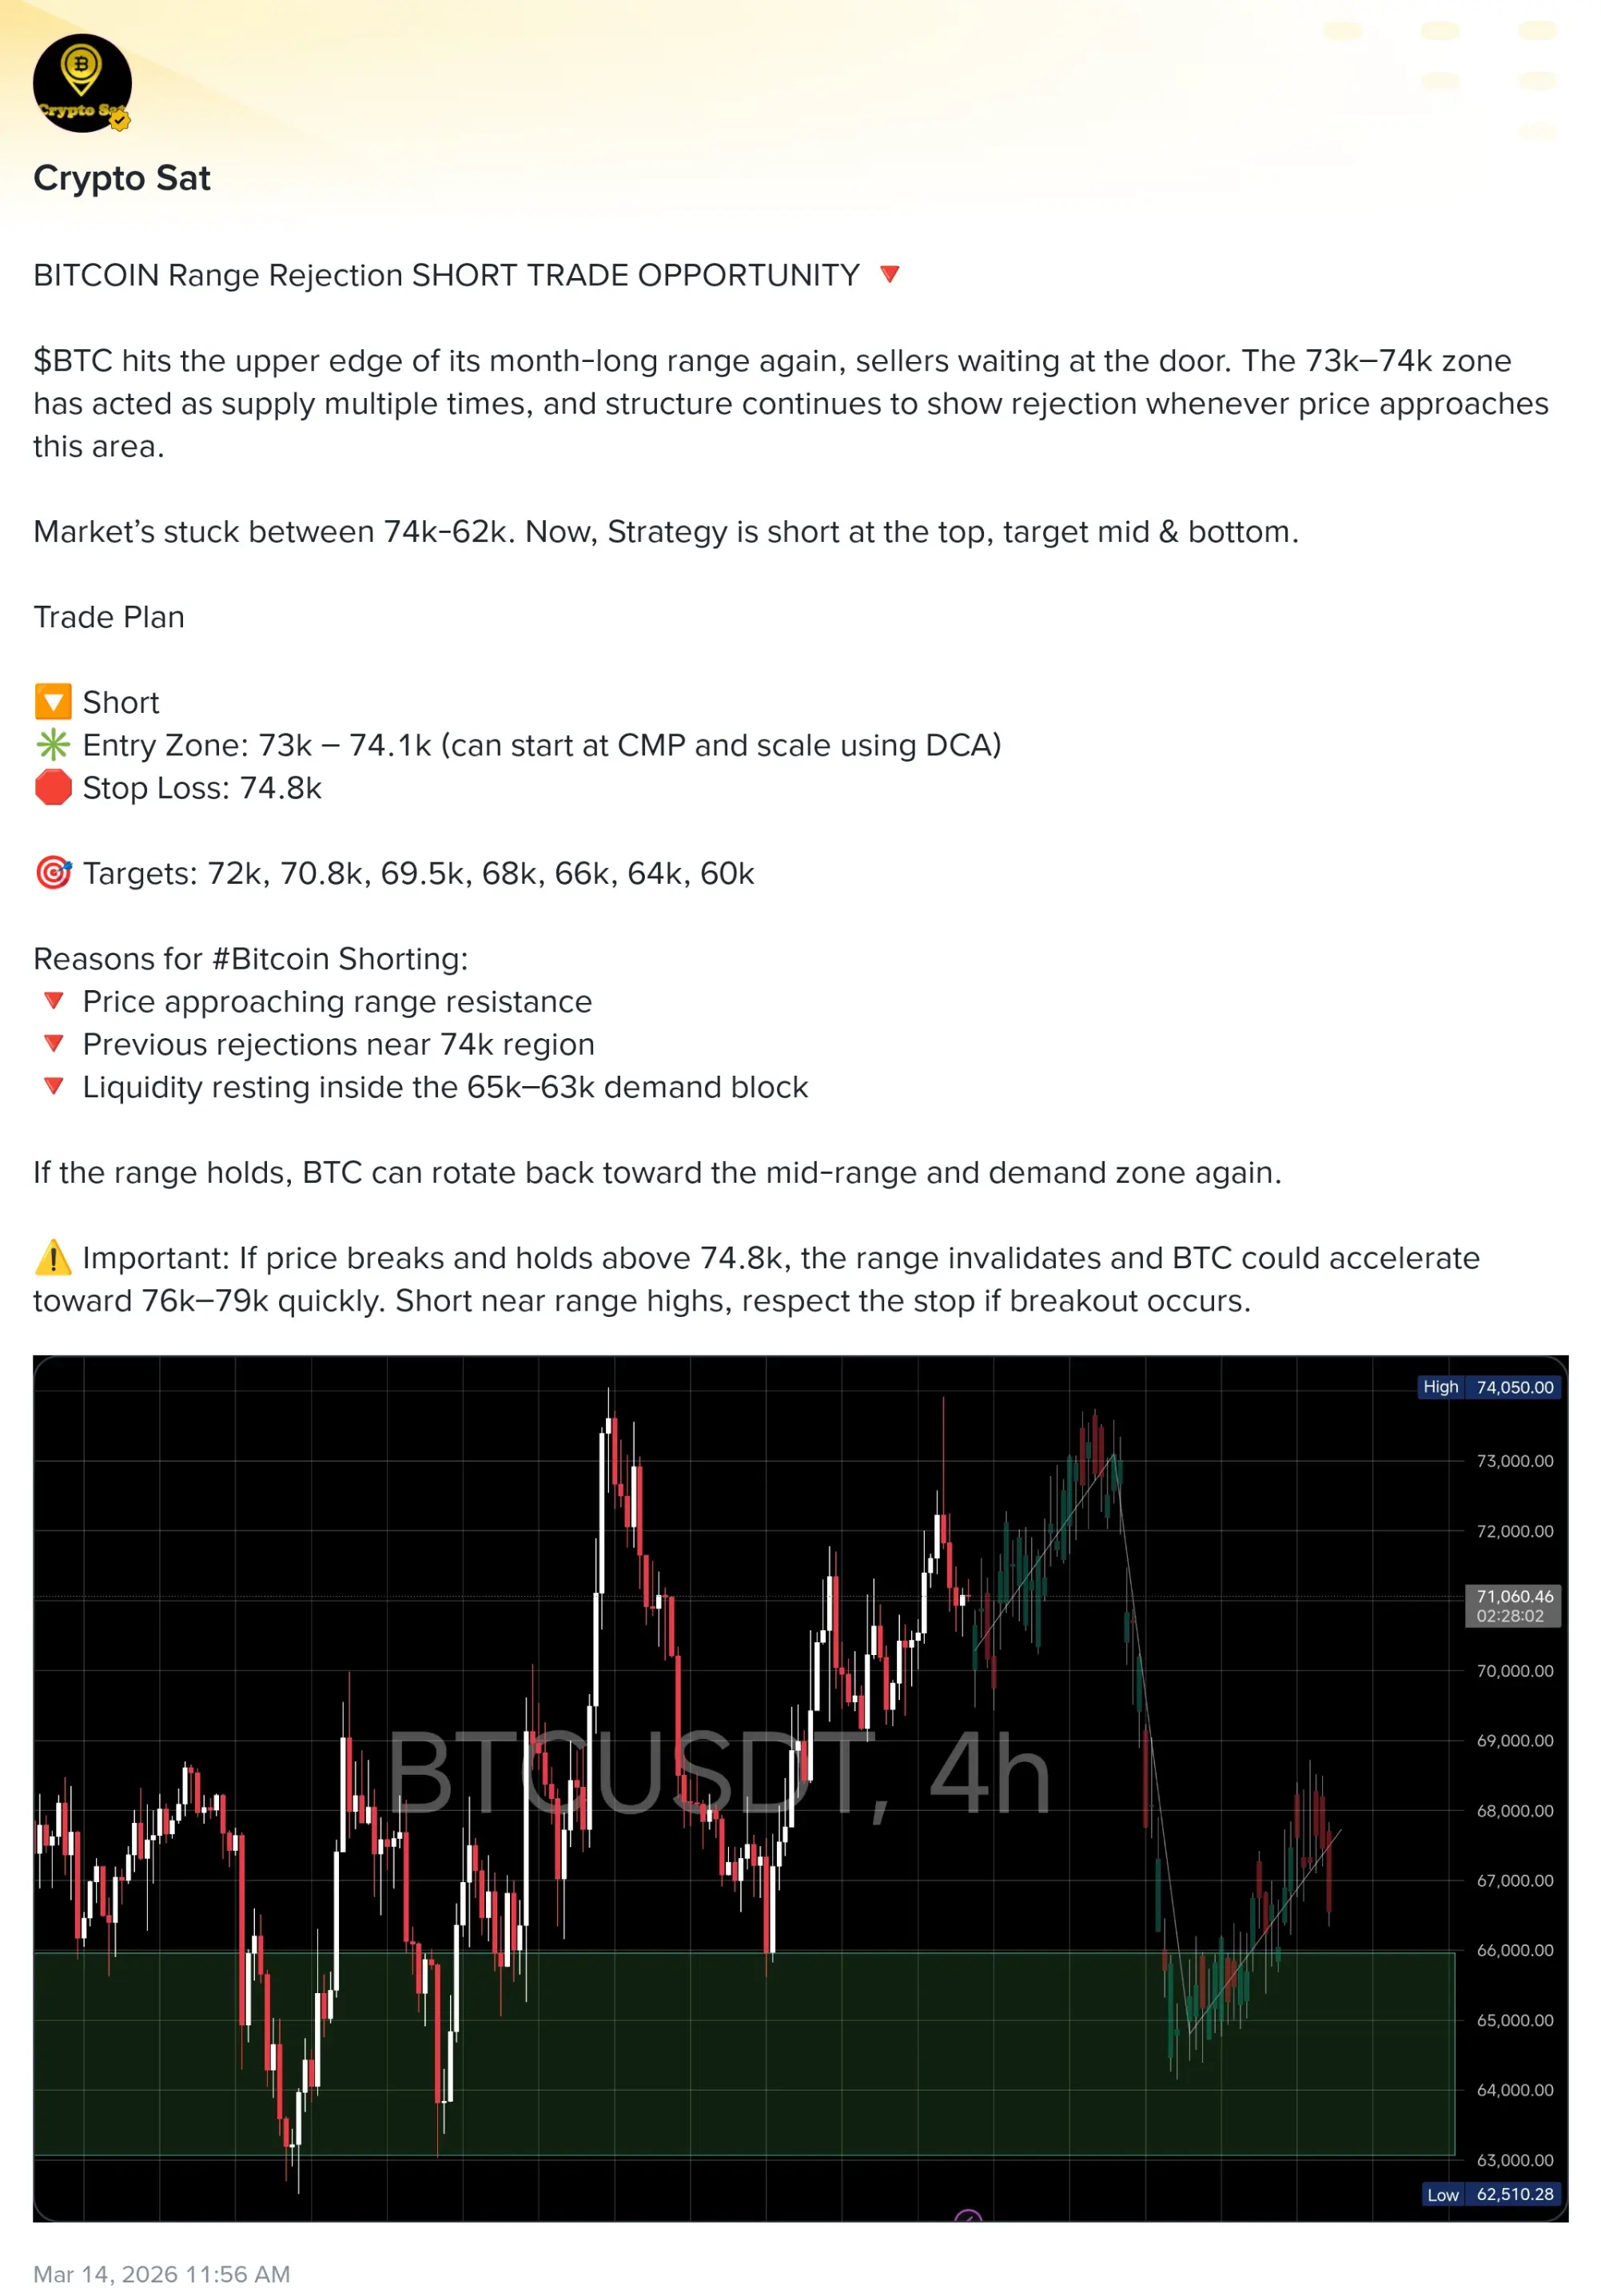
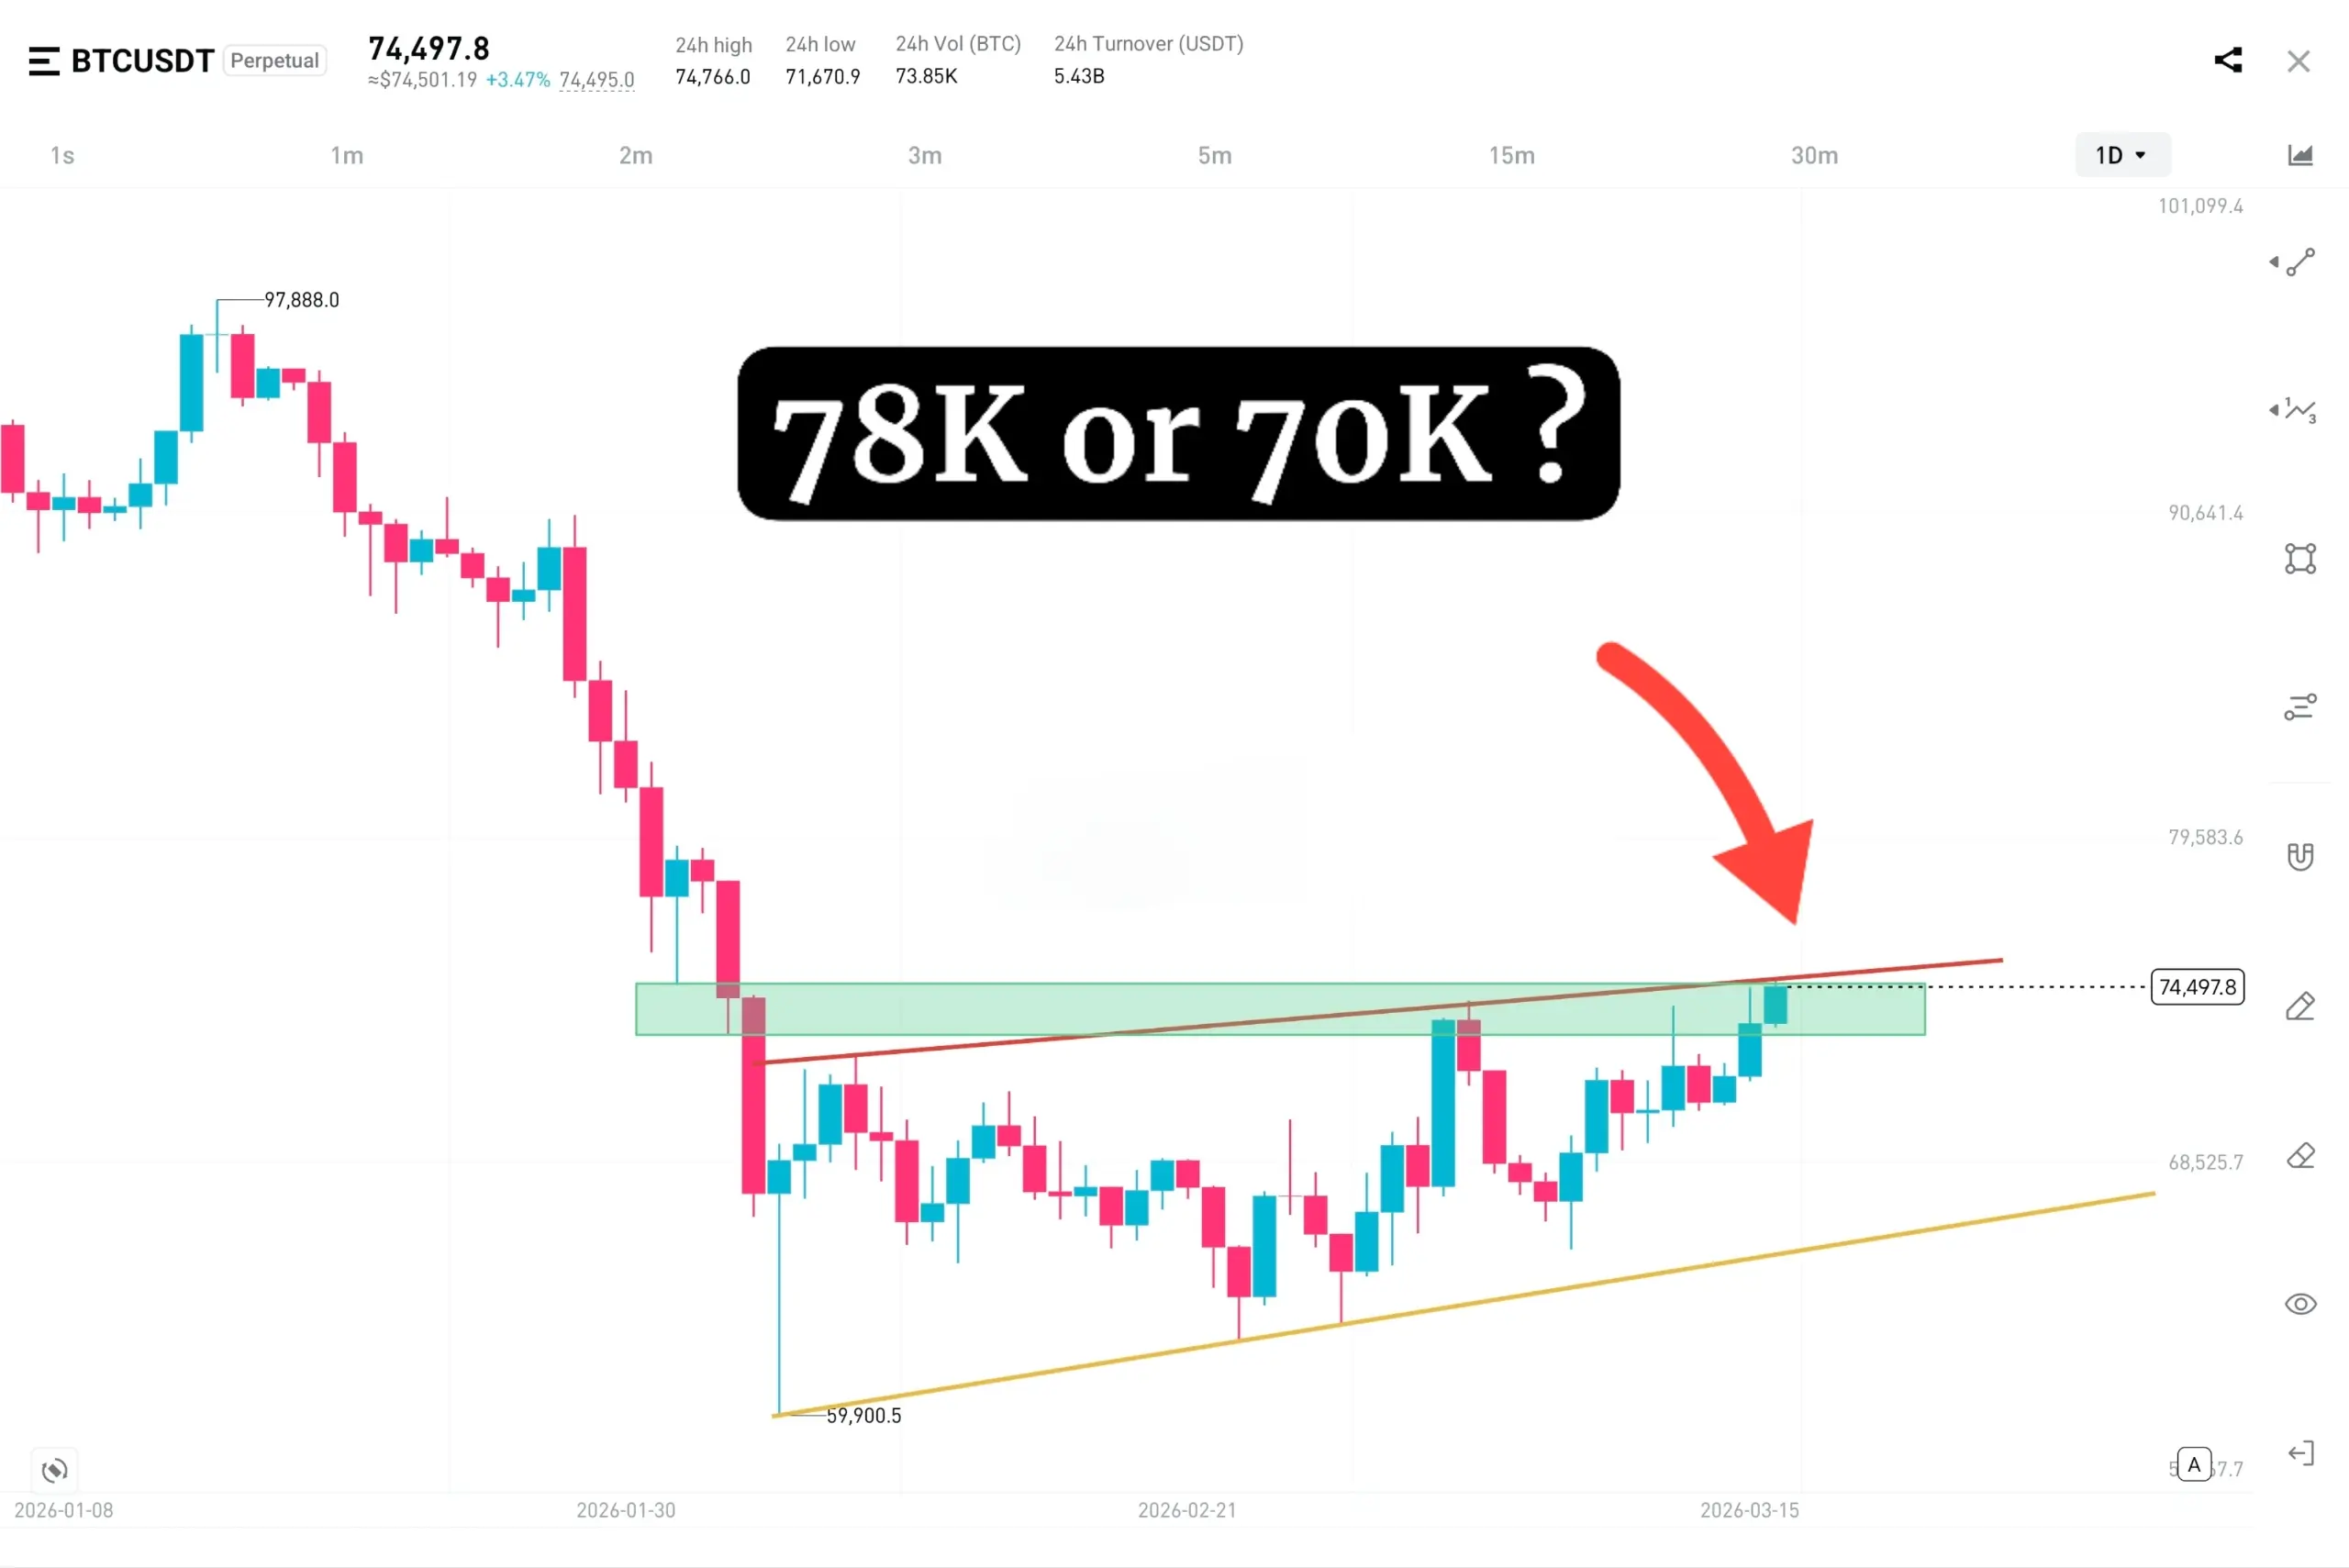
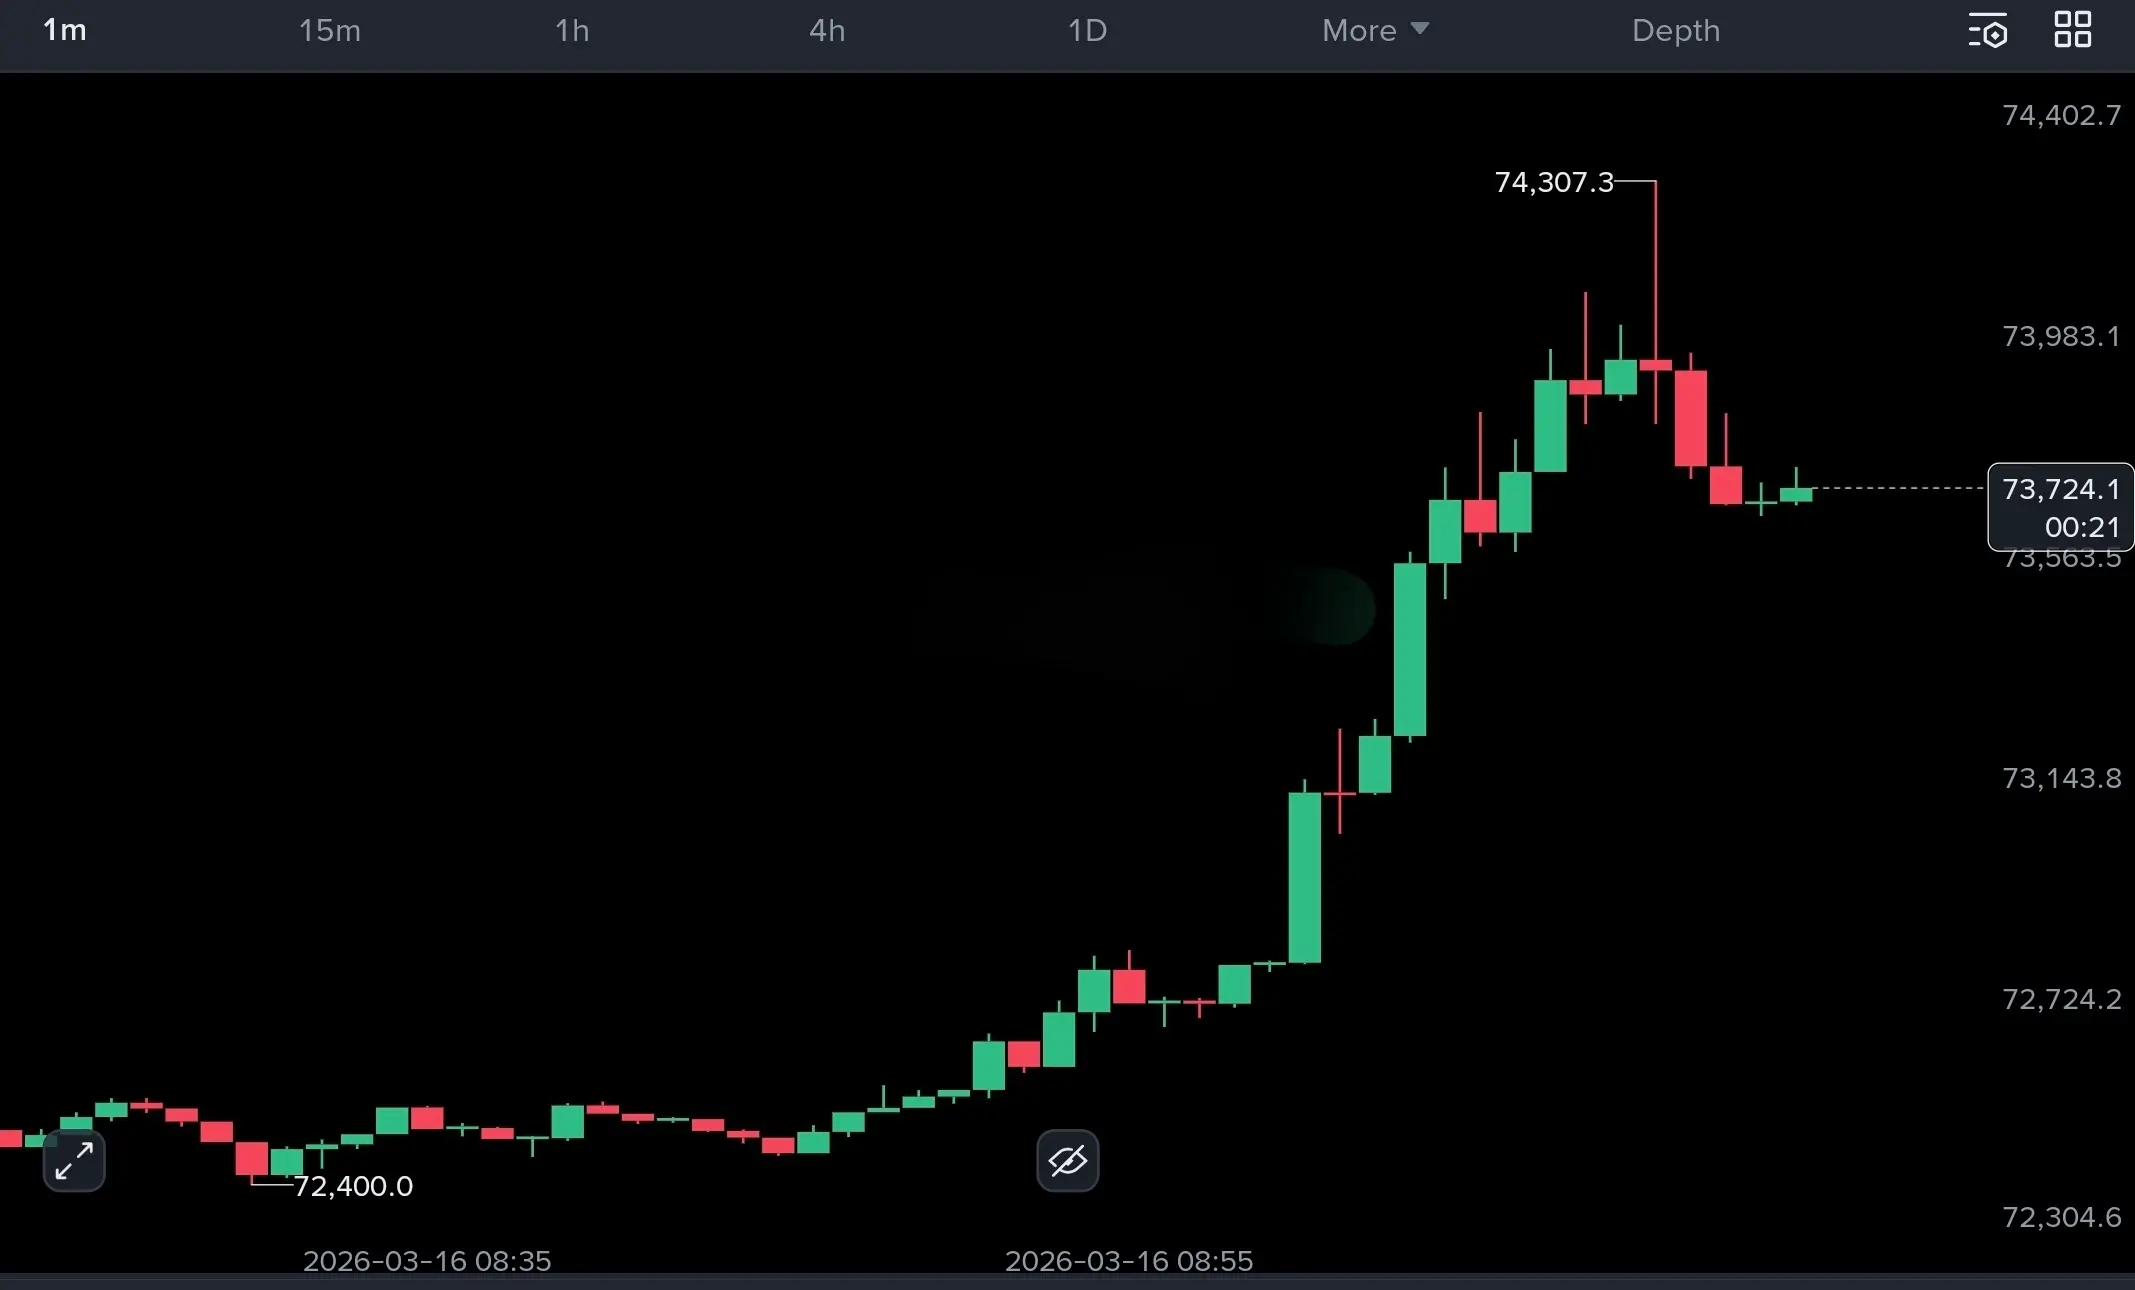
We identified the 73k–74k range resistance, which had rejected price multiple times in the past. Based on that structure, the strategy was simple: short near range highs and target the mid and bottom of the range.
Entry zone was 73k–74.1k, with Stop-Loss at 74.8k.
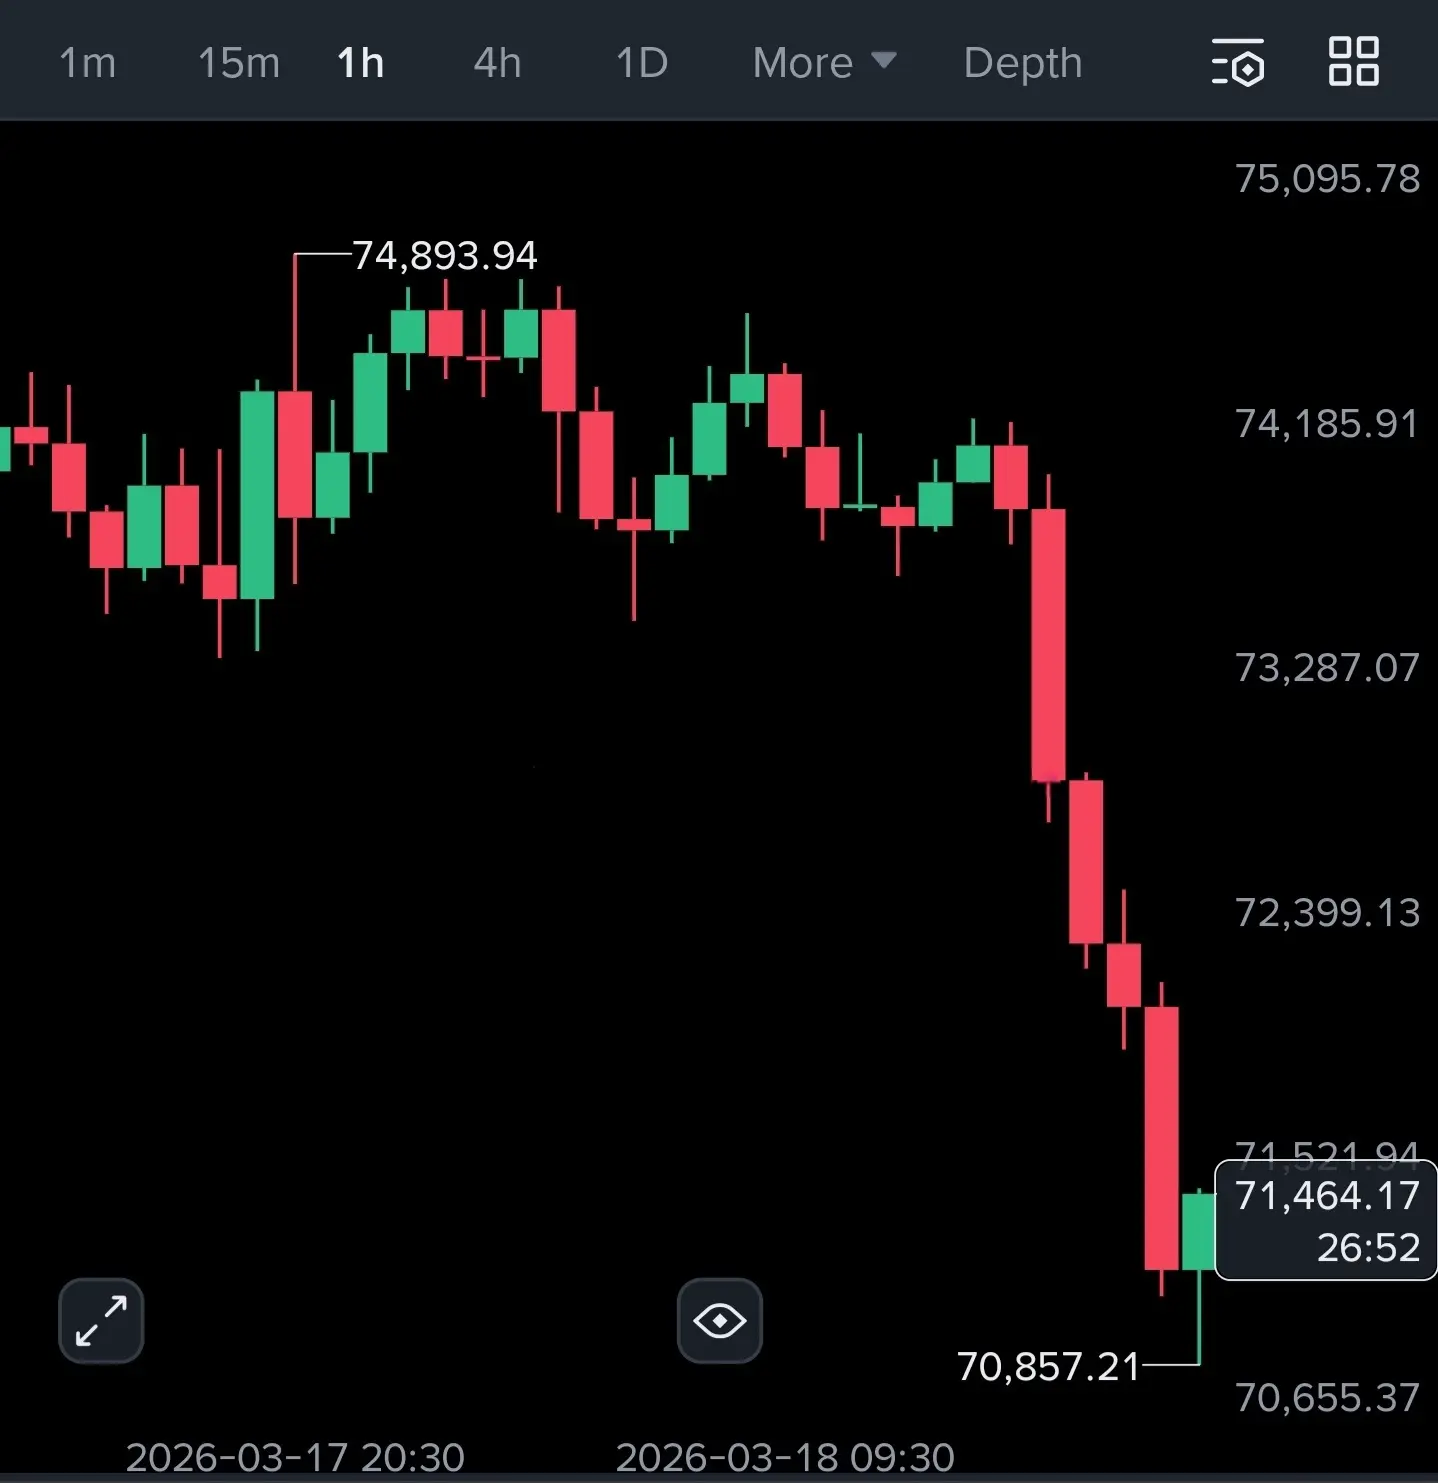
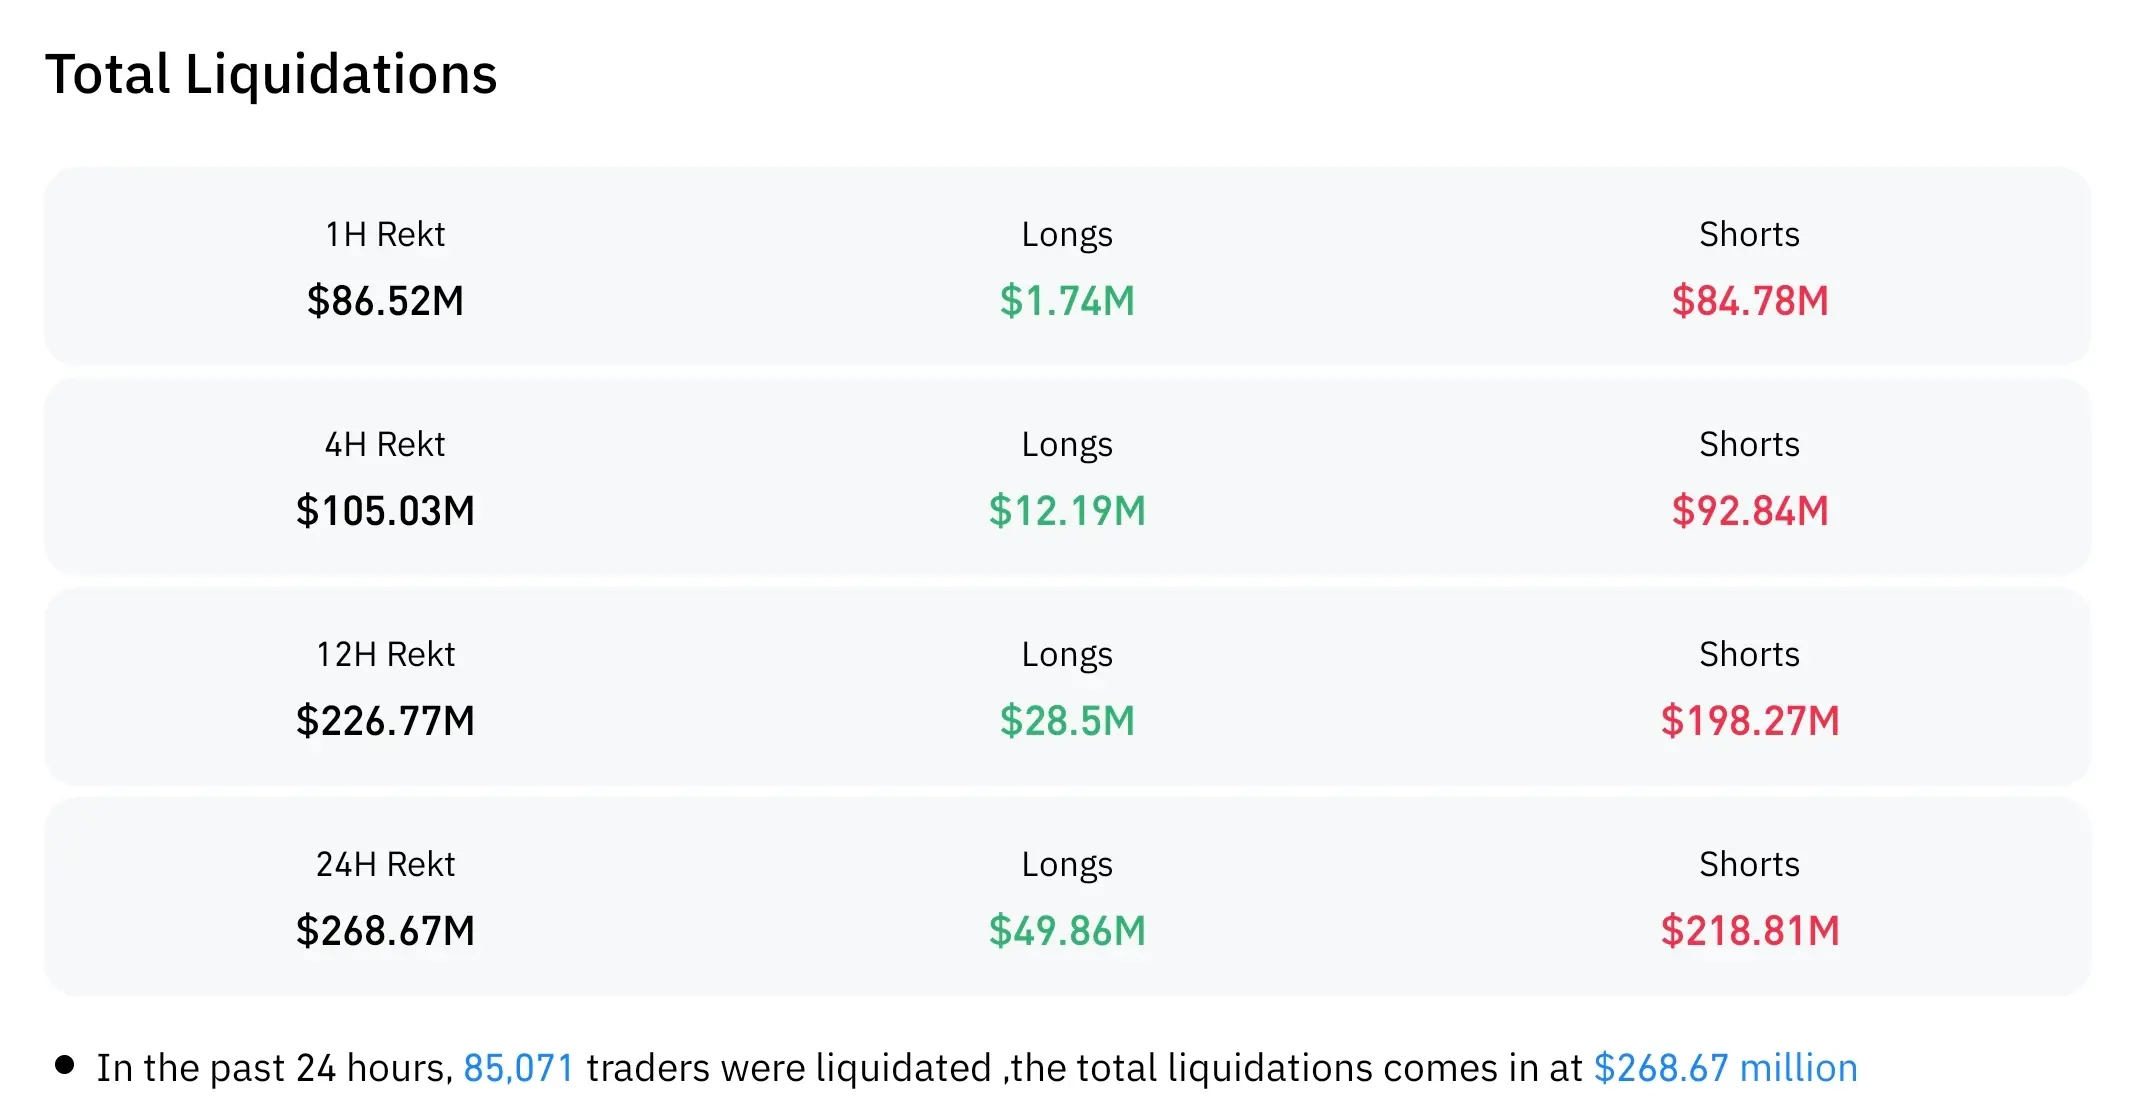
Price behaved exactly like a classic liquidity sweep. It pushed slightly above the resistance, reaching around 75.9k, triggering stops near the range high. After that sweep, the market reversed sharply and started the dump we anticipated.
This is why I always say — levels are zones, not exact numbers.
However, the important part here is risk management.
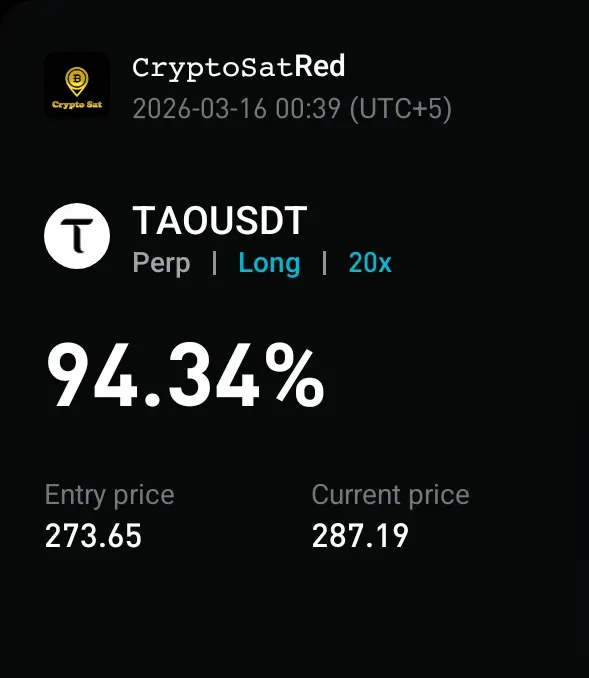
During the move, I mentioned two profit-taking opportunities, and traders who followed those updates managed to secure partial gains before the stop was triggered, which reduced the overall loss significantly. That’s the difference between blind trading and structured trade management.
Looking at the chart now:
• trendline Resistance: 75k – 76k
• Horizontal Resistance: 73k – 74k
• Immediate Support: 71k
• Mid-Range Support: 68k
• Strong Demand Zone: 65k – 63k
#Bitcoin is still technically rotating inside a broader range between roughly 75k and 62k.
Possible Scenarios:
📉 Bearish Rotation (Range Continuation)
If BTC fails to reclaim 73k–74k, the market could rotate back toward:
• 70.8k
• 69.5k
• 68k
• 66k → 64k demand zone
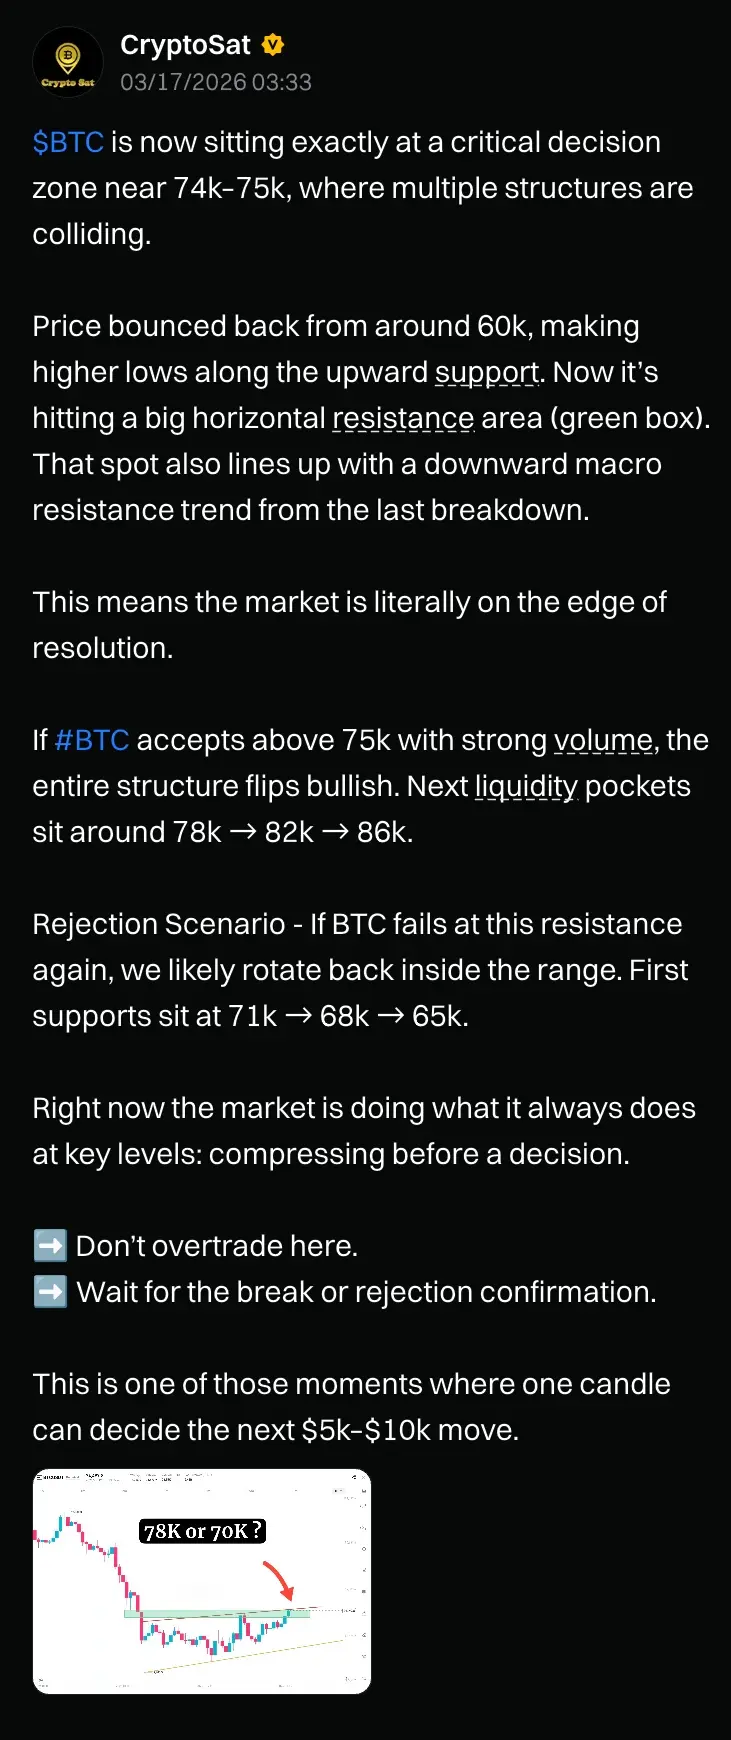
📈 Bullish Breakout Scenario - If price accepts above 75k–76k, the range breaks and liquidity opens toward: 78k - 82k
Right now the market is again near a decision area, where the next expansion will likely start.
Lesson From This Trade
The market often hunts liquidity before making the real move.
Our analysis wasn’t wrong — timing and liquidity sweep changed the execution.
That’s why the most important rule in trading is simple:
✔ Always respect Stop-Loss
✔ Take partial profits when the market gives the chance
✔ Stay disciplined even when the market tests your patience
Because in trading, survival and consistency matter more than catching every perfect move 💚
This is exactly how markets test traders.
We read charts, draw structures, identify support and resistance, and build a trading plan based on probability and market sentiment at that moment. Most of the time those levels work perfectly — but sometimes the market pushes slightly beyond them before moving in the expected direction.
Our $BTC short setup was a perfect example of that scenario.
We identified the 73k–74k range resistance, which had rejected price multiple times in the past. Based on that structure, the strategy was simple: short near range highs and target the mid and bottom of the range.
Entry zone was 73k–74.1k, with Stop-Loss at 74.8k.
Price behaved exactly like a classic liquidity sweep. It pushed slightly above the resistance, reaching around 75.9k, triggering stops near the range high. After that sweep, the market reversed sharply and started the dump we anticipated.
This is why I always say — levels are zones, not exact numbers.
However, the important part here is risk management.
During the move, I mentioned two profit-taking opportunities, and traders who followed those updates managed to secure partial gains before the stop was triggered, which reduced the overall loss significantly. That’s the difference between blind trading and structured trade management.
Looking at the chart now:
• trendline Resistance: 75k – 76k
• Horizontal Resistance: 73k – 74k
• Immediate Support: 71k
• Mid-Range Support: 68k
• Strong Demand Zone: 65k – 63k
#Bitcoin is still technically rotating inside a broader range between roughly 75k and 62k.
Possible Scenarios:
📉 Bearish Rotation (Range Continuation)
If BTC fails to reclaim 73k–74k, the market could rotate back toward:
• 70.8k
• 69.5k
• 68k
• 66k → 64k demand zone
📈 Bullish Breakout Scenario - If price accepts above 75k–76k, the range breaks and liquidity opens toward: 78k - 82k
Right now the market is again near a decision area, where the next expansion will likely start.
Lesson From This Trade
The market often hunts liquidity before making the real move.
Our analysis wasn’t wrong — timing and liquidity sweep changed the execution.
That’s why the most important rule in trading is simple:
✔ Always respect Stop-Loss
✔ Take partial profits when the market gives the chance
✔ Stay disciplined even when the market tests your patience
Because in trading, survival and consistency matter more than catching every perfect move 💚