


#加密市场小幅下跌 Bitcoin Market Analysis: Macroeconomic Headwinds Intensify Bull-Bear Battle, Key Technical Levels Take Center Stage
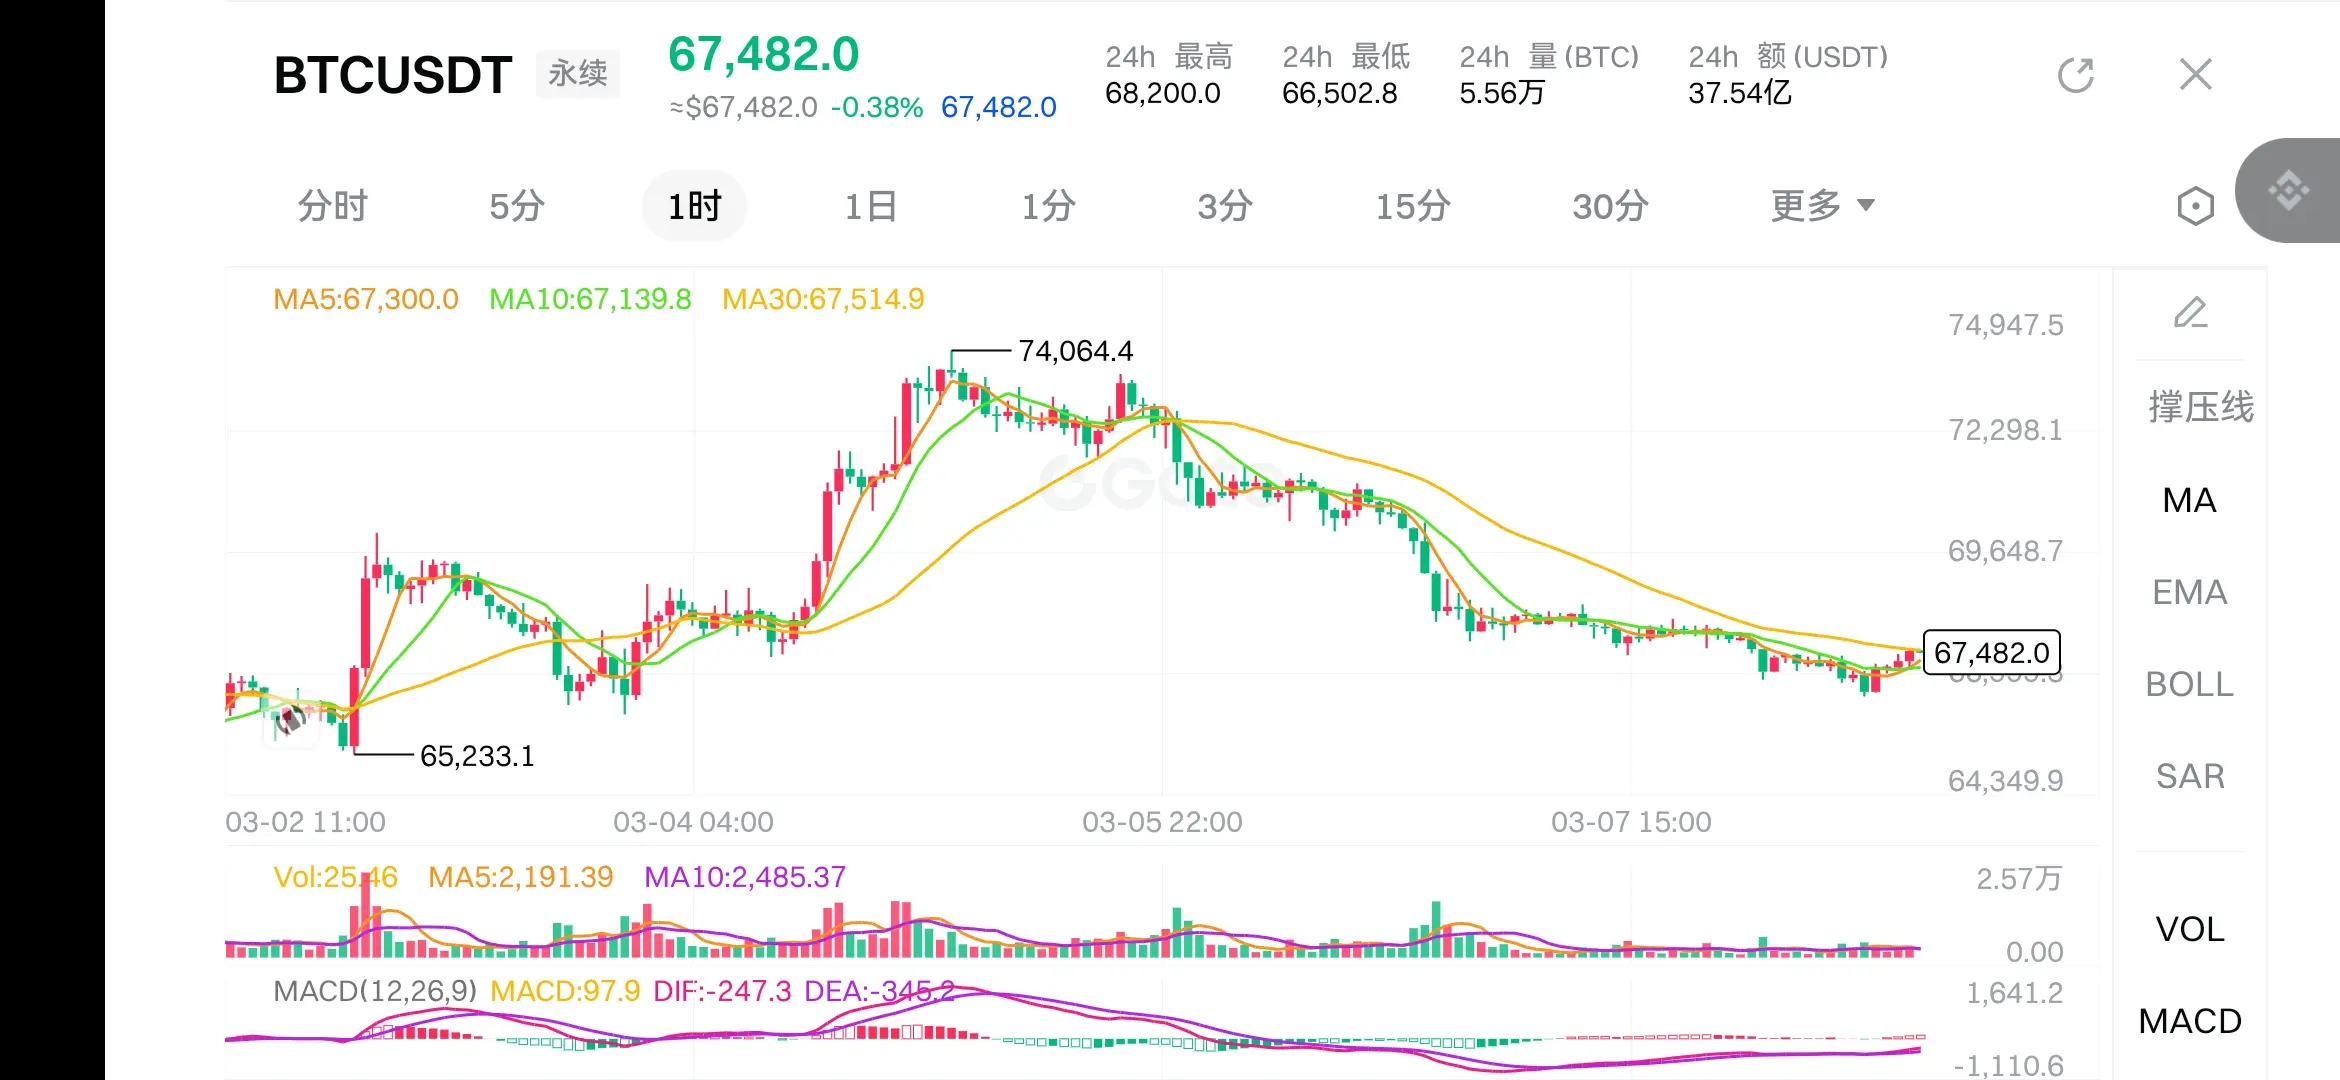
Despite a series of positive institutional news at the start of the week, the price faced resistance after reaching the $74,000 mark and pulled back, indicating a temporary failure of the upward breakout. This trend clearly reveals a new market norm: as institutional investors deepen their involvement, the correlation between Bitcoin and traditional risk assets like the Nasdaq Index has increased, making macroeconomic factors significantly overshadow the intrinsic positives in the cryptocurrency space.
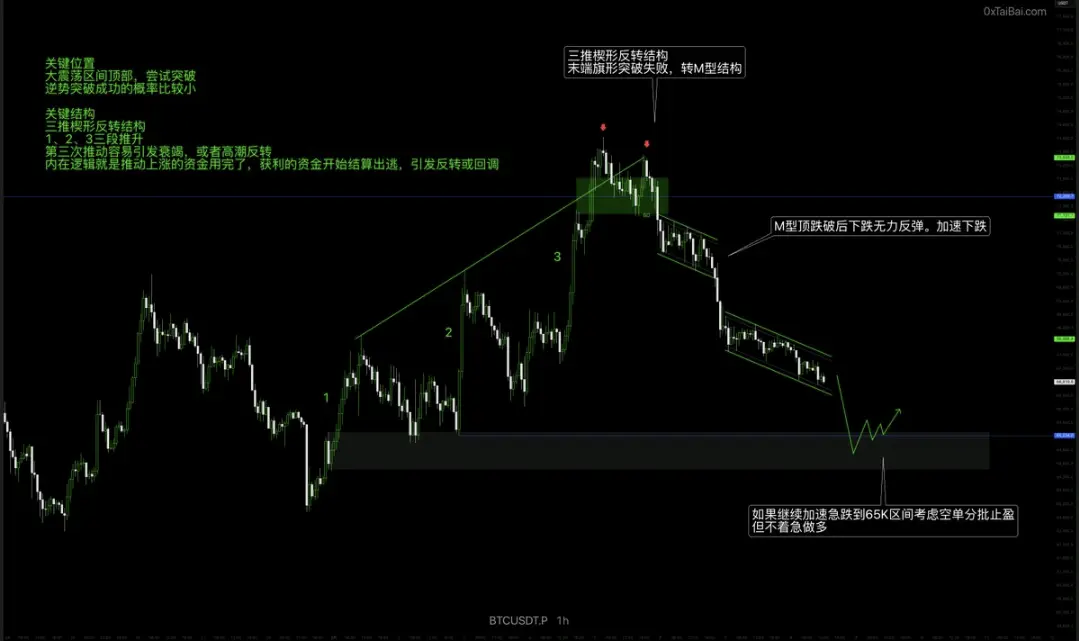
Technical Charts: Confluence of Key Support and Dynamic Resistance From the daily chart analysis, Bitcoin's price experienced a brief surge above $74,000 but encountered significant selling pressure and quickly retreated below $69,000. This correction led to a large amount of short-term profit-taking, with estimates showing that within 24 hours of the price spike, short-term holders transferred over 27,000 BTC (approximately $1.8 billion) to exchanges to realize gains. Currently, the price is testing a critical consolidation zone. The orange shaded area between $60,000 and $70,000 has been the main battleground for bulls and bears since the February bottom. Below, the super trend line at $61,089 provides an important static support level. Above, the Parabolic SAR at $63,214 offers additional dynamic support. However, resistance levels are also clear. Besides the recent strong resistance at $74,000, a long-term descending trendline starting from the November 2025 high (around $130,000) continues to suppress the rebound potential (red line in the chart). Therefore, Bitcoin’s next move will depend on whether it can stabilize above these support zones and ultimately break through the downward trendline.
Macroeconomic Headwinds Offset Institutional Positives
Notably, despite a series of heavyweight institutional positive signals recently, market reactions have been muted. These include Morgan Stanley designating BNY Mellon as custodian for its spot Bitcoin ETF, Kk gaining access to the Federal Reserve payment system, and Intercontinental Exchange (ICE) making strategic investments in OKCoin. Any of these news items alone could have previously triggered significant market rallies.
The core reason the market is ignoring these positives is the shift in the macro environment. Geopolitical tensions (such as issues with Iran) have driven up oil prices and inflation expectations, which in turn have strengthened the US dollar index. Under the macro narrative of “dollar strength and changing interest rate expectations,” risk assets are generally under pressure, and Bitcoin is no exception.
News of asset management giants like BlackRock restricting large-scale private fund redemptions has further heightened concerns about liquidity. Institutional investors view Bitcoin as a macro-sensitive asset, and their trading logic is increasingly aligned with US stocks.
Internal Market Structure: Selling Pressure Release and Capital Reflow
Although short-term traders have been selling at the highs, some positive signals have emerged. Data shows that the US spot Bitcoin ETF recorded approximately $787 million in net inflows last week, marking the first weekly net inflow since mid-January. This suggests that after weeks of capital outflows, some institutional funds may be reconsidering and repositioning in Bitcoin. Meanwhile, the funding rate for Bitcoin perpetual contracts has fallen to its lowest level since 2023, typically indicating that excessive leveraged long positions have been largely cleared, laying a better foundation for a healthy rally driven by spot buying.
Market Outlook: Two Paths of Battle
The next movement of Bitcoin will depend on the resonance between technical and macro factors.
Bullish Scenario: Bitcoin successfully holds above the key support zone of $65,000 to $67,000. Subsequently, with continuous ETF capital inflows, the price resumes its upward move and effectively breaks through the $74,000 resistance and the long-term descending trendline. If a breakout occurs, the next target range will be $80,000 to $82,000.
Bearish Scenario: Bitcoin’s closing price drops below the $65,000 support level. This would lead to a test of the support at $63,214 (Parabolic SAR) and $61,089 (super trend line). If these levels are broken, the price could further decline toward $58,500 or near the 200-week moving average.
In summary, the Bitcoin market is at a complex crossroads. Strong institutional infrastructure and capital inflows have laid a long-term foundation, but short-term price movements are being dominated by more powerful macroeconomic waves. Investors should closely monitor the defense of the $65,000-$67,000 support zone and changes in macro market sentiment, as these will be critical in determining the next medium-term direction.
Despite a series of positive institutional news at the start of the week, the price faced resistance after reaching the $74,000 mark and pulled back, indicating a temporary failure of the upward breakout. This trend clearly reveals a new market norm: as institutional investors deepen their involvement, the correlation between Bitcoin and traditional risk assets like the Nasdaq Index has increased, making macroeconomic factors significantly overshadow the intrinsic positives in the cryptocurrency space.
Technical Charts: Confluence of Key Support and Dynamic Resistance From the daily chart analysis, Bitcoin's price experienced a brief surge above $74,000 but encountered significant selling pressure and quickly retreated below $69,000. This correction led to a large amount of short-term profit-taking, with estimates showing that within 24 hours of the price spike, short-term holders transferred over 27,000 BTC (approximately $1.8 billion) to exchanges to realize gains. Currently, the price is testing a critical consolidation zone. The orange shaded area between $60,000 and $70,000 has been the main battleground for bulls and bears since the February bottom. Below, the super trend line at $61,089 provides an important static support level. Above, the Parabolic SAR at $63,214 offers additional dynamic support. However, resistance levels are also clear. Besides the recent strong resistance at $74,000, a long-term descending trendline starting from the November 2025 high (around $130,000) continues to suppress the rebound potential (red line in the chart). Therefore, Bitcoin’s next move will depend on whether it can stabilize above these support zones and ultimately break through the downward trendline.
Macroeconomic Headwinds Offset Institutional Positives
Notably, despite a series of heavyweight institutional positive signals recently, market reactions have been muted. These include Morgan Stanley designating BNY Mellon as custodian for its spot Bitcoin ETF, Kk gaining access to the Federal Reserve payment system, and Intercontinental Exchange (ICE) making strategic investments in OKCoin. Any of these news items alone could have previously triggered significant market rallies.
The core reason the market is ignoring these positives is the shift in the macro environment. Geopolitical tensions (such as issues with Iran) have driven up oil prices and inflation expectations, which in turn have strengthened the US dollar index. Under the macro narrative of “dollar strength and changing interest rate expectations,” risk assets are generally under pressure, and Bitcoin is no exception.
News of asset management giants like BlackRock restricting large-scale private fund redemptions has further heightened concerns about liquidity. Institutional investors view Bitcoin as a macro-sensitive asset, and their trading logic is increasingly aligned with US stocks.
Internal Market Structure: Selling Pressure Release and Capital Reflow
Although short-term traders have been selling at the highs, some positive signals have emerged. Data shows that the US spot Bitcoin ETF recorded approximately $787 million in net inflows last week, marking the first weekly net inflow since mid-January. This suggests that after weeks of capital outflows, some institutional funds may be reconsidering and repositioning in Bitcoin. Meanwhile, the funding rate for Bitcoin perpetual contracts has fallen to its lowest level since 2023, typically indicating that excessive leveraged long positions have been largely cleared, laying a better foundation for a healthy rally driven by spot buying.
Market Outlook: Two Paths of Battle
The next movement of Bitcoin will depend on the resonance between technical and macro factors.
Bullish Scenario: Bitcoin successfully holds above the key support zone of $65,000 to $67,000. Subsequently, with continuous ETF capital inflows, the price resumes its upward move and effectively breaks through the $74,000 resistance and the long-term descending trendline. If a breakout occurs, the next target range will be $80,000 to $82,000.
Bearish Scenario: Bitcoin’s closing price drops below the $65,000 support level. This would lead to a test of the support at $63,214 (Parabolic SAR) and $61,089 (super trend line). If these levels are broken, the price could further decline toward $58,500 or near the 200-week moving average.
In summary, the Bitcoin market is at a complex crossroads. Strong institutional infrastructure and capital inflows have laid a long-term foundation, but short-term price movements are being dominated by more powerful macroeconomic waves. Investors should closely monitor the defense of the $65,000-$67,000 support zone and changes in macro market sentiment, as these will be critical in determining the next medium-term direction.