Highlights
①. Gate's "Basic Futures Contracts" course introduces various methods of technical analysis that are commonly employed in futures trading. The aim of these courses is to help traders establish a comprehensive framework for technical analysis. Covered topics include the basics of Candlestick charts, technical patterns, moving averages, trend lines, and the application of technical indicators.
②. In Course 17 of the "Master Technical Analysis" series, we introduce you to a rectangle pattern, including its significance, meaning, features and application in trading.
1. What is rectangle?
The rectangle, commonly referred to as a box, is a charting pattern that emerges when the price of an asset consistently fluctuates within a defined range. This pattern is characterized by the price meeting support at the same low point during each pullback and encountering resistance at a consistent high with each rally. By drawing horizontal lines to connect these recurring lows and highs, we delineate the top and bottom of the rectangle or box-like pattern. Below is an illustration of a rectangle pattern.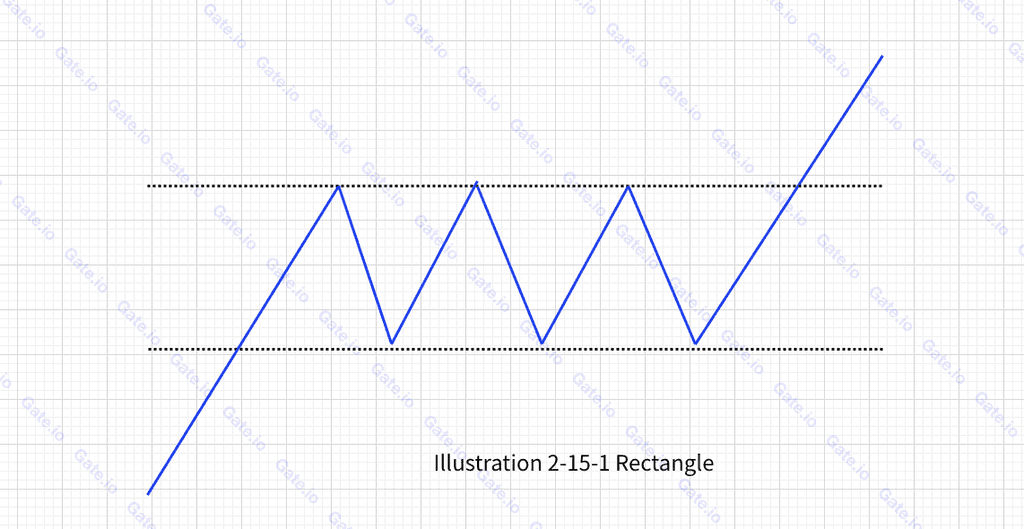
2. How to identify rectangle?
①. It is often observed in the middle of the bullish or bearish run, but is less commonly seen at the bottom or top
②. The price moves repeatedly between a box-shaped pattern formed by two horizontal lines, indicating the resistance and support levels
③. The trading volume increases as the price rises, and decreases as it falls. Yet the overall trading volume generally shrinks during the formation of the box;
④. The box pattern is completed when it is effectively broken out at the upper or lower edge. The direction of the breakout indicates the potential moving direction of the price;
⑤. An effective breakout must surpass the edge by more than 3%.
3. What are the technical implications of the box pattern?
Rectangles that develop during an uptrend typically break upwards. Consequently, these breakouts generally signal a potential continuation of the bullish trend, indicating a buying opportunity. Conversely, rectangles that take shape during a downtrend are more likely to break downwards. Breakouts of this nature suggest a strong likelihood of the market maintaining its bearish trajectory, serving as a cue to sell.
4. Application
①. Rectangles that form during an uptrend typically break upwards. Therefore, such breakouts usually indicate the potential continuation of the bullish trend and suggest an opportunity to buy. Below, the chart illustrates where such a buying opportunity arises.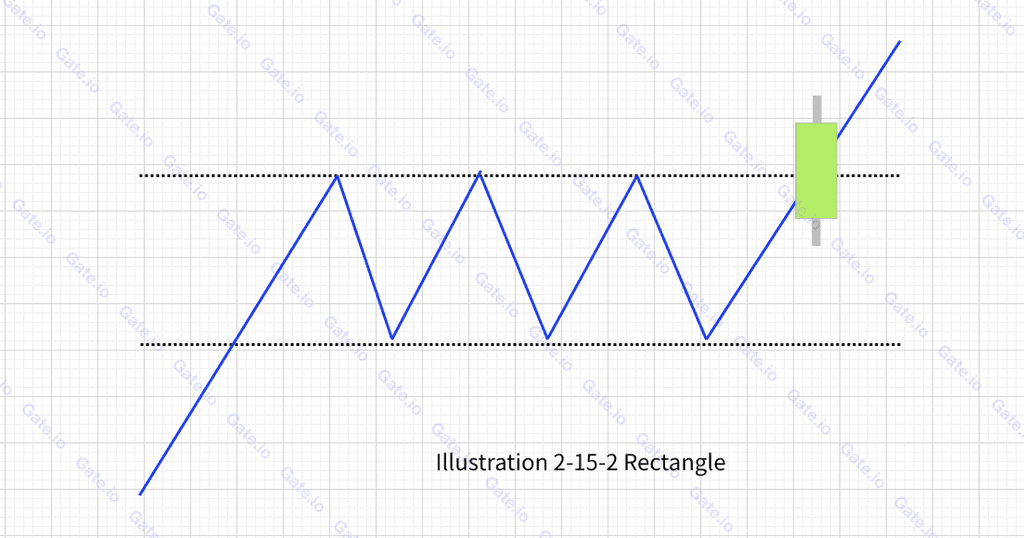
②. Rectangles that form during a downtrend are usually broken downwards. Such breakouts suggest the market is highly possible to remain bearish, and it's a signal to sell. Below shows where such selling opportunity is. 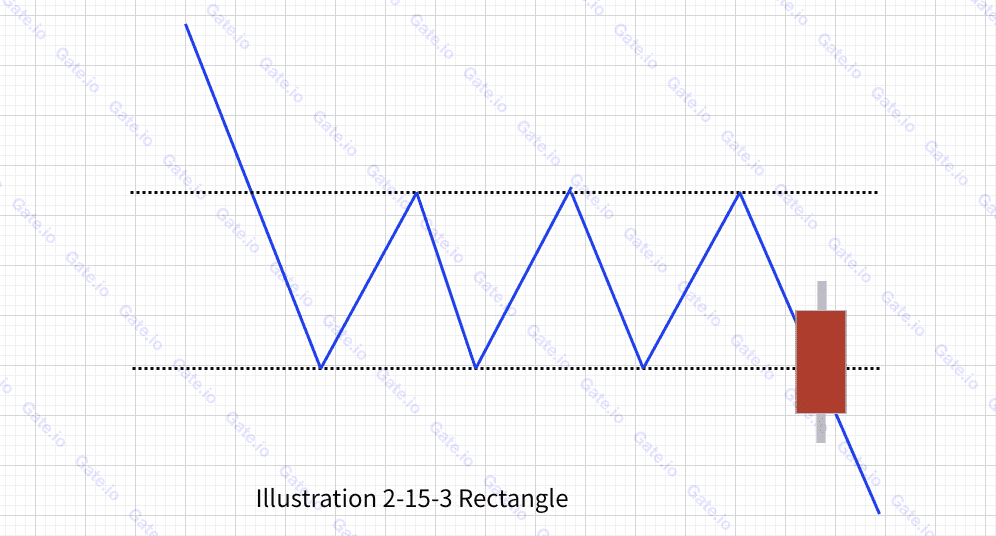
5. Use Case
①. Breakout at the rectangle's upper edge:
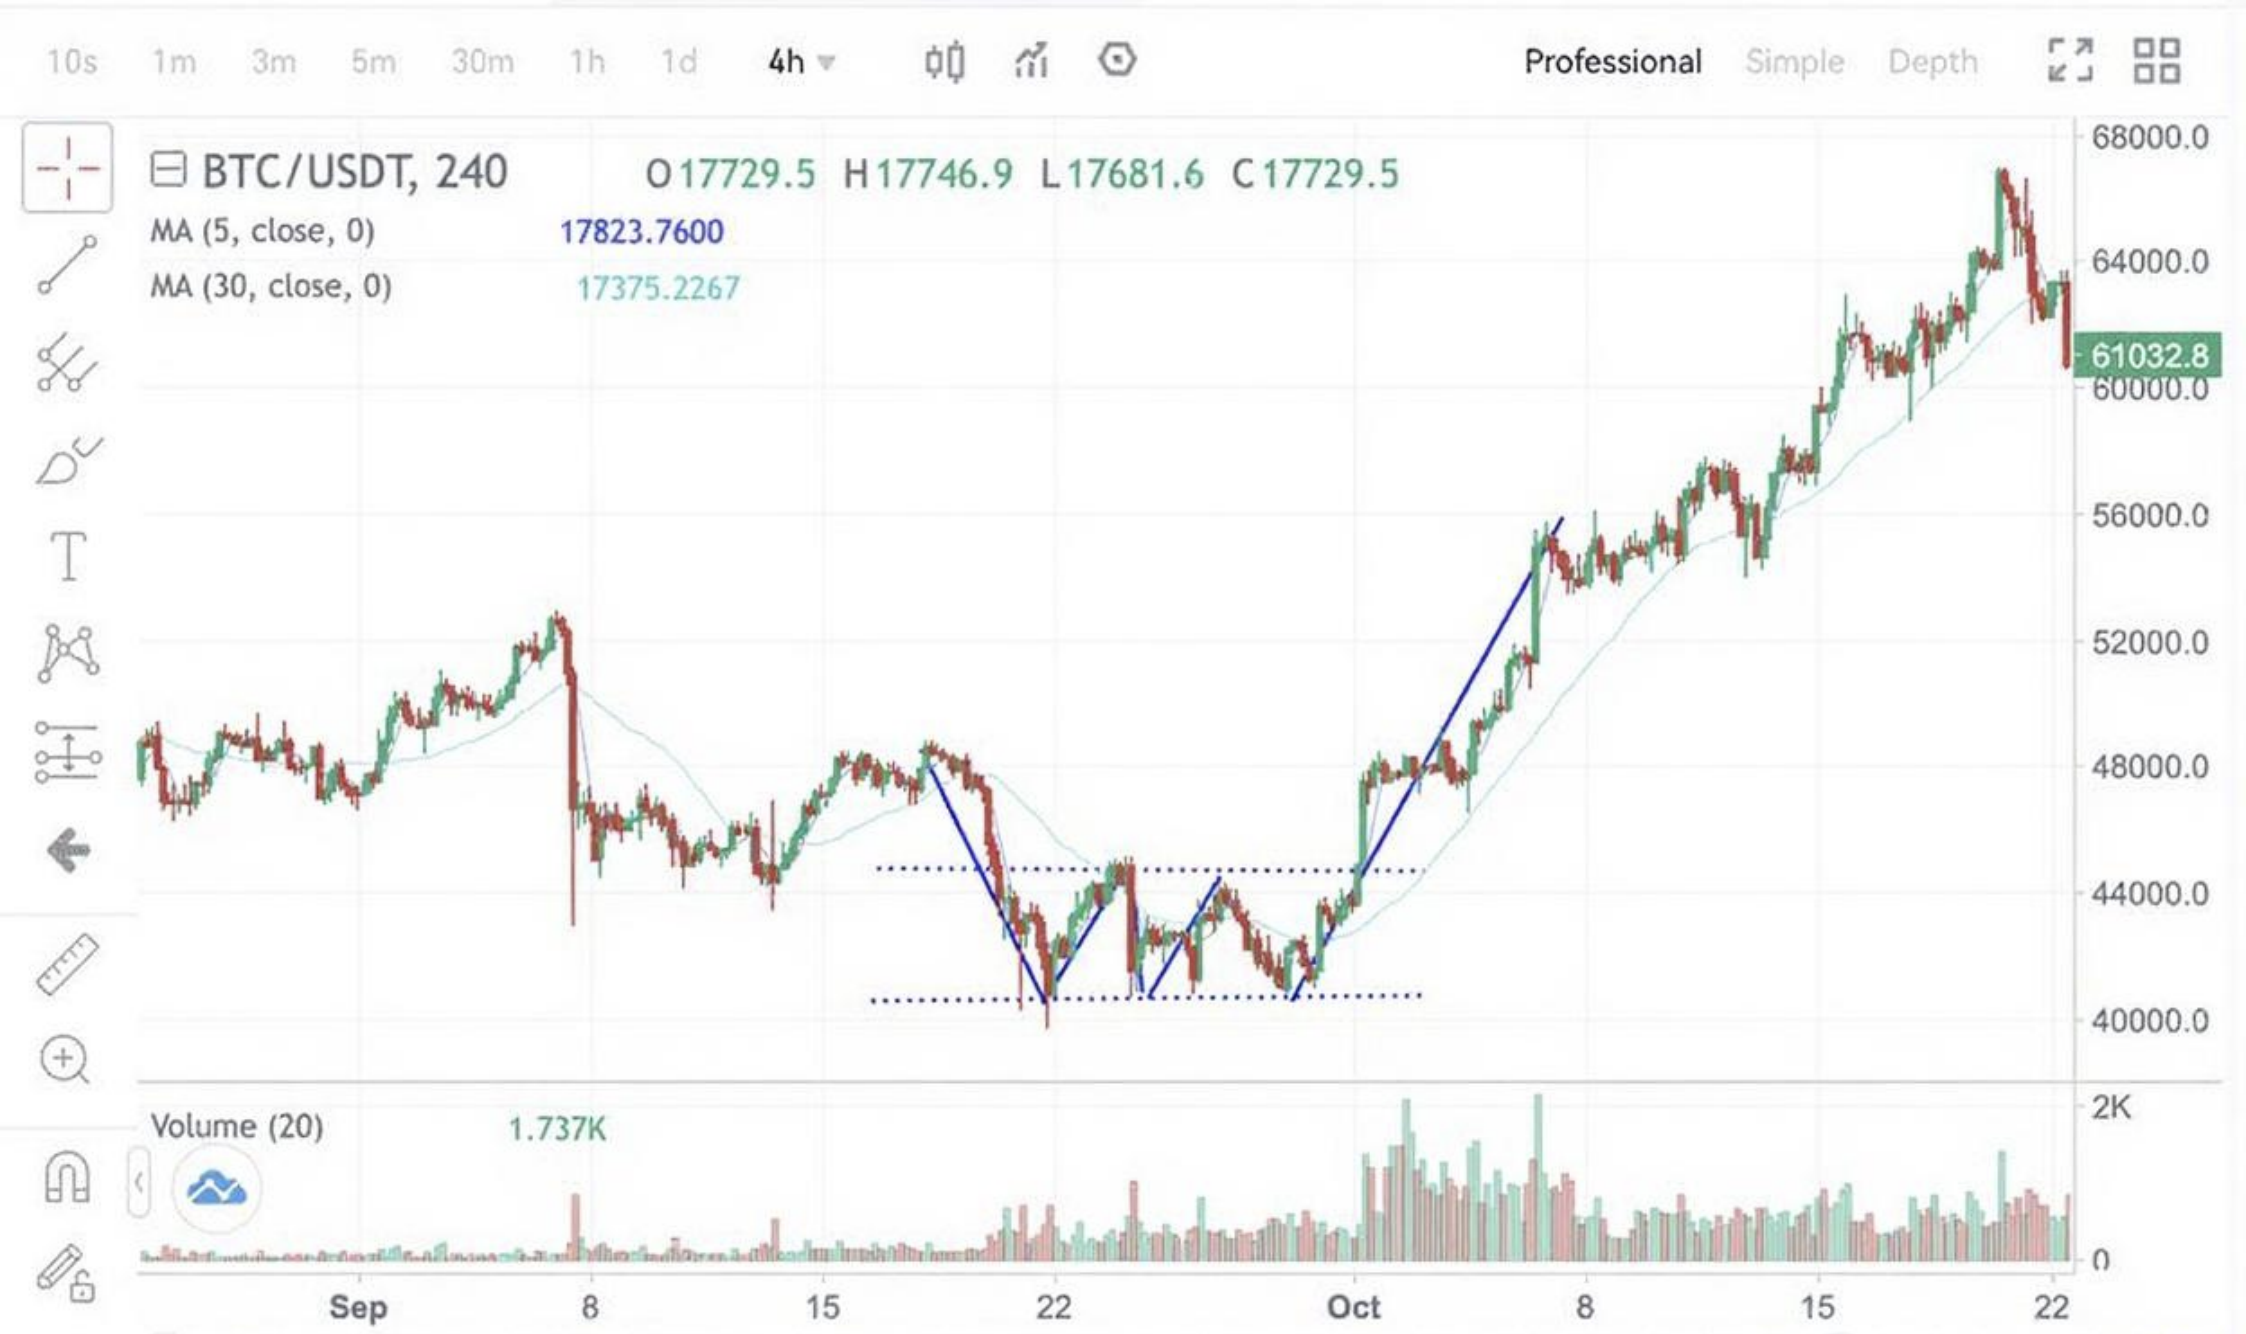
The chart above is from a 4-hour BTC/USDT futures chart on Gate. Between September 19, 2021, and October 1, 2021, BTC's price fell from $48,000 to $40,000, then fluctuated within the range of $40,650 to $44,670, forming a box pattern. When BTC broke through the box's upper edge at $44,670, it initiated a new uptrend, ultimately reaching over $66,000—an increase of 47.7%.
②. Breakout at the rectangle's lower edge: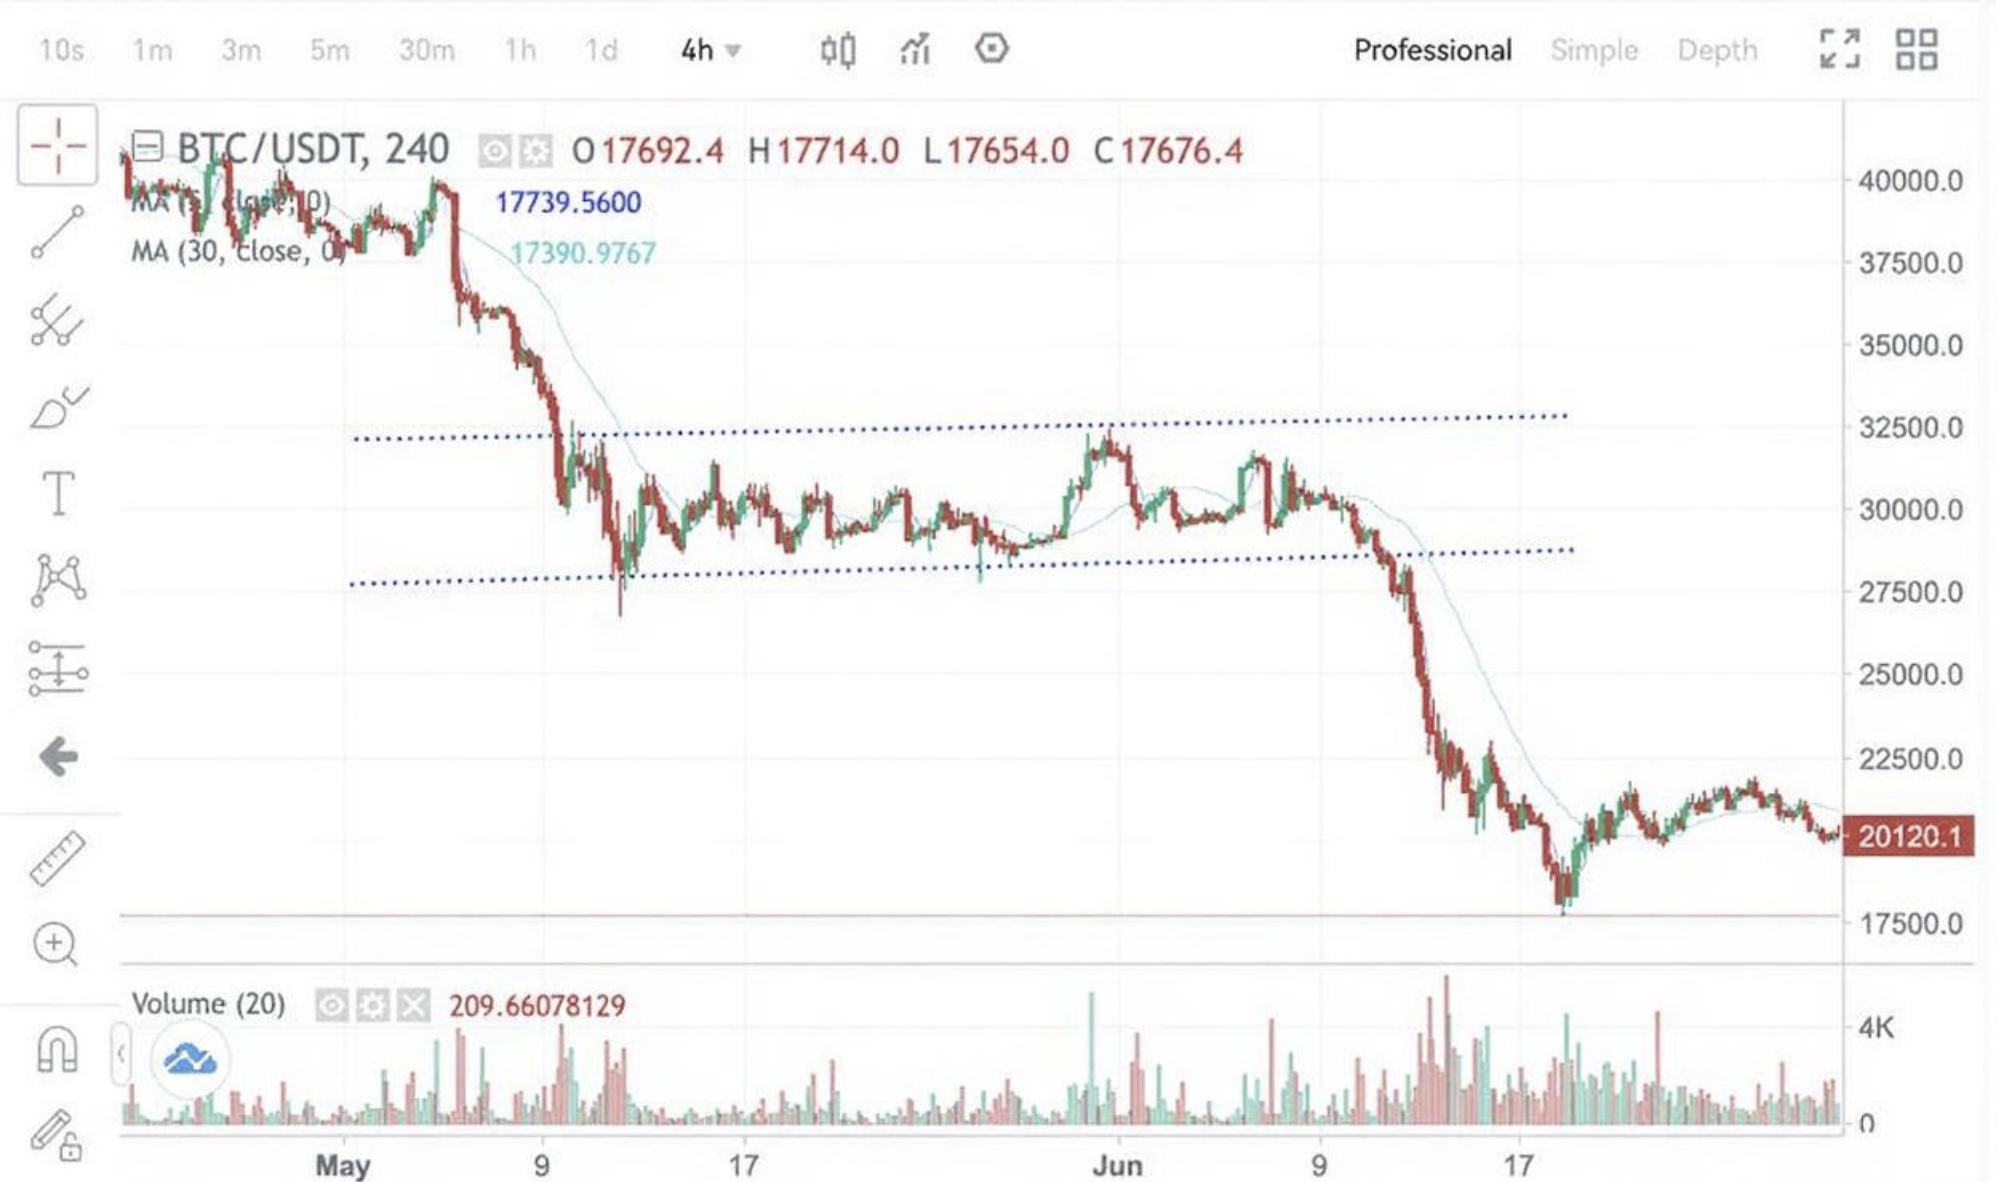
The chart above displays a 4-hour BTC/USDT futures chart from Gate. Between May 19, 2022, and June 11, 2022, BTC's value rapidly declined from $39,000 to $26,000, and subsequently oscillated between $28,000 and $32,000, establishing a box pattern. The price eventually broke downward through the box pattern's lower boundary at $28,500 and continued to plummet, ultimately falling to around $18,000, which represented a total decrease of approximately 40%.
6. Summary
If a box pattern forms at the peak or trough of a trend, it often carries implications similar to those of a rounding top or bottom, indicating a likely trend reversal.
Rectangles, or box patterns, are technical charting patterns used in trading to predict potential price movements. These patterns are formed when the price of an asset, such as Bitcoin (BTC), fluctuates within a defined horizontal price range and are indicative of consolidation.
When a rectangle pattern appears during an uptrend, it is likely to break upwards, suggesting the continuation of the bullish trend and presenting a buying opportunity.
Furthermore, when a box pattern forms at the peak or trough of a trend, it can signal a potential trend reversal, analogous to rounding top or bottom patterns. Such formations are crucial signals for traders, suggesting shifts in market momentum and providing strategic entry or exit points.
Start trading futures by registering on Gate Futures.
Disclaimer
This article is for informational purposes only and does not constitute investment advice. Gate is not responsible for any investment decisions you make. Content related to technical analysis, market assessments, trading skills, and traders' insights should not be considered a basis for investment. Investing carries potential risks and uncertainties. This article offers no guarantees or assurances of returns on any type of investment.
