Highlights
①. Gate's "Basic Futures Contracts" course introduces various methods of technical analysis that are commonly employed in futures trading. The aim of these courses is to help traders establish a comprehensive framework for technical analysis. Covered topics include the basics of Candlestick charts, technical patterns, moving averages, trend lines, and the application of technical indicators.
②. In Course XIV of the "Master Technical Analysis" series, this article introduces alternative triangles formed in market movement, including their significance, features and application in trading.
1. What are the alternative triangles?
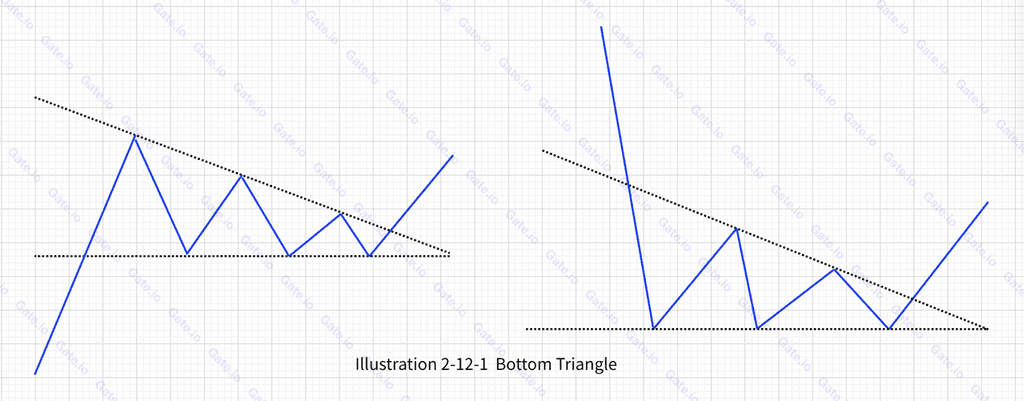
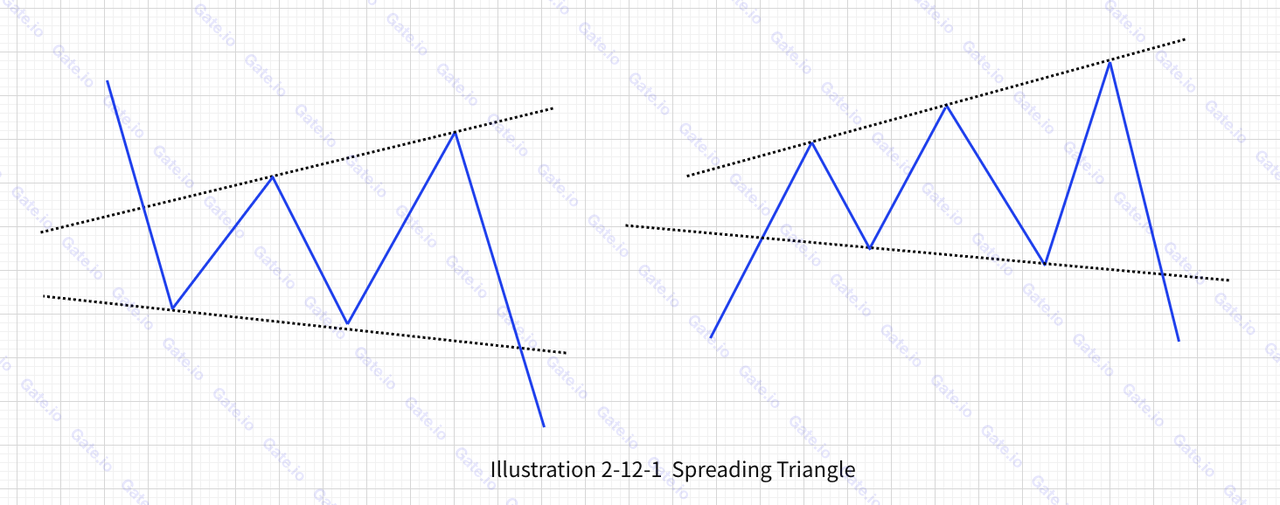
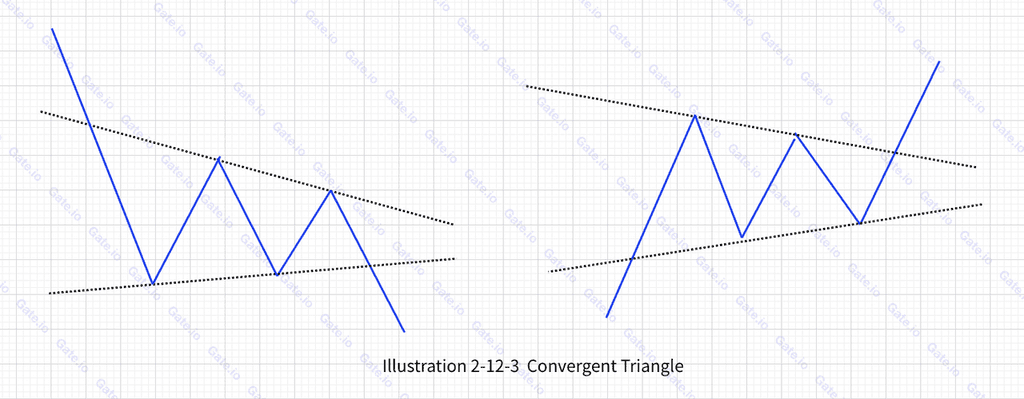
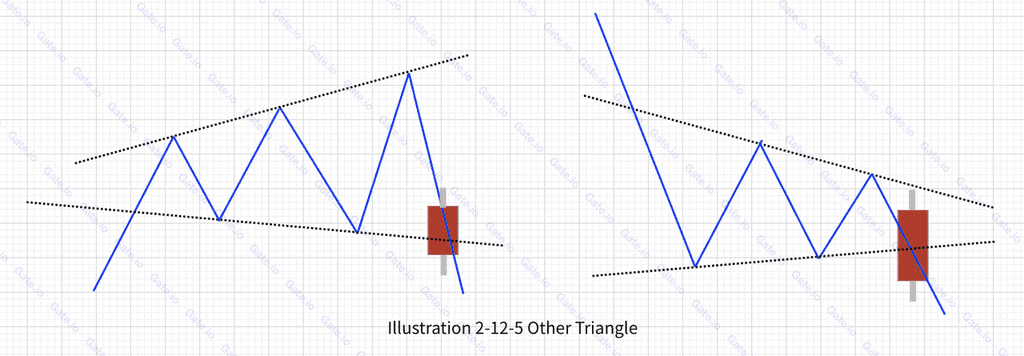
In addition to the ascending and descending triangles discussed in previous sections, various other triangle forms emerge occasionally in actual trading. These carry significant trading signals. Notably, these include base triangles, diverging triangles (shaped like a megaphone), and converging triangles. Examples can be seen in the figure below:
①.Base triangle
②.Diverging triangle
③.Converging triangle
2. Features of other triangles
①.They can appear in both upward and downward trends.
②. They should not be relied upon exclusively for making trading decisions. Instead, they should be used in conjunction with trend line analysis to assess market trends. A flexible approach is advised when interpreting their technical implications.
3. What are the technical meanings of these three triangles?
The formation of these triangles illustrates the ongoing battle between bullish and bearish forces. Trading signals arise when these triangles are breached. Specifically, a breakthrough at the upper edge of the triangle suggests a potential bullish trend, while crossing the lower edge of the pattern signals the possibility of a bearish market.
4. Application
①.When the price hikes to break through the upper edge of the triangle, with a green candlestick formed that day, it signals a possibility for a bullish trend. The below shows the position of the bullish signal:
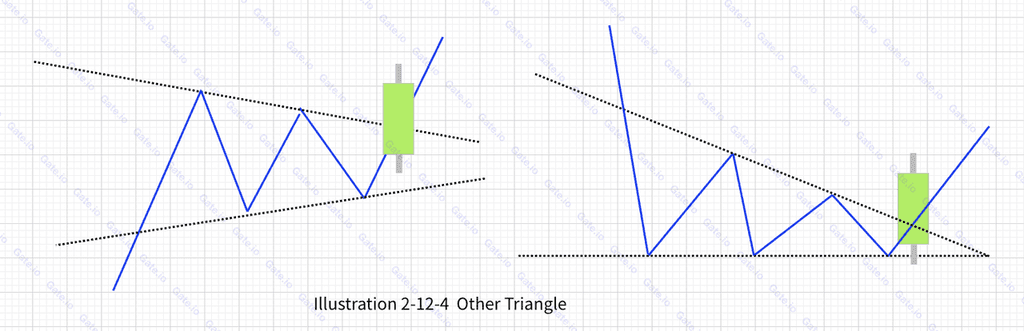
②.When the price breaches the lower edge of the triangle and closes with a red candlestick for the day, it suggests a potential bearish trend, signaling a selling opportunity. Below, you can see the position indicative of this selling opportunity:
5. Use Case
①.When the triangle is broken at the upper edge:
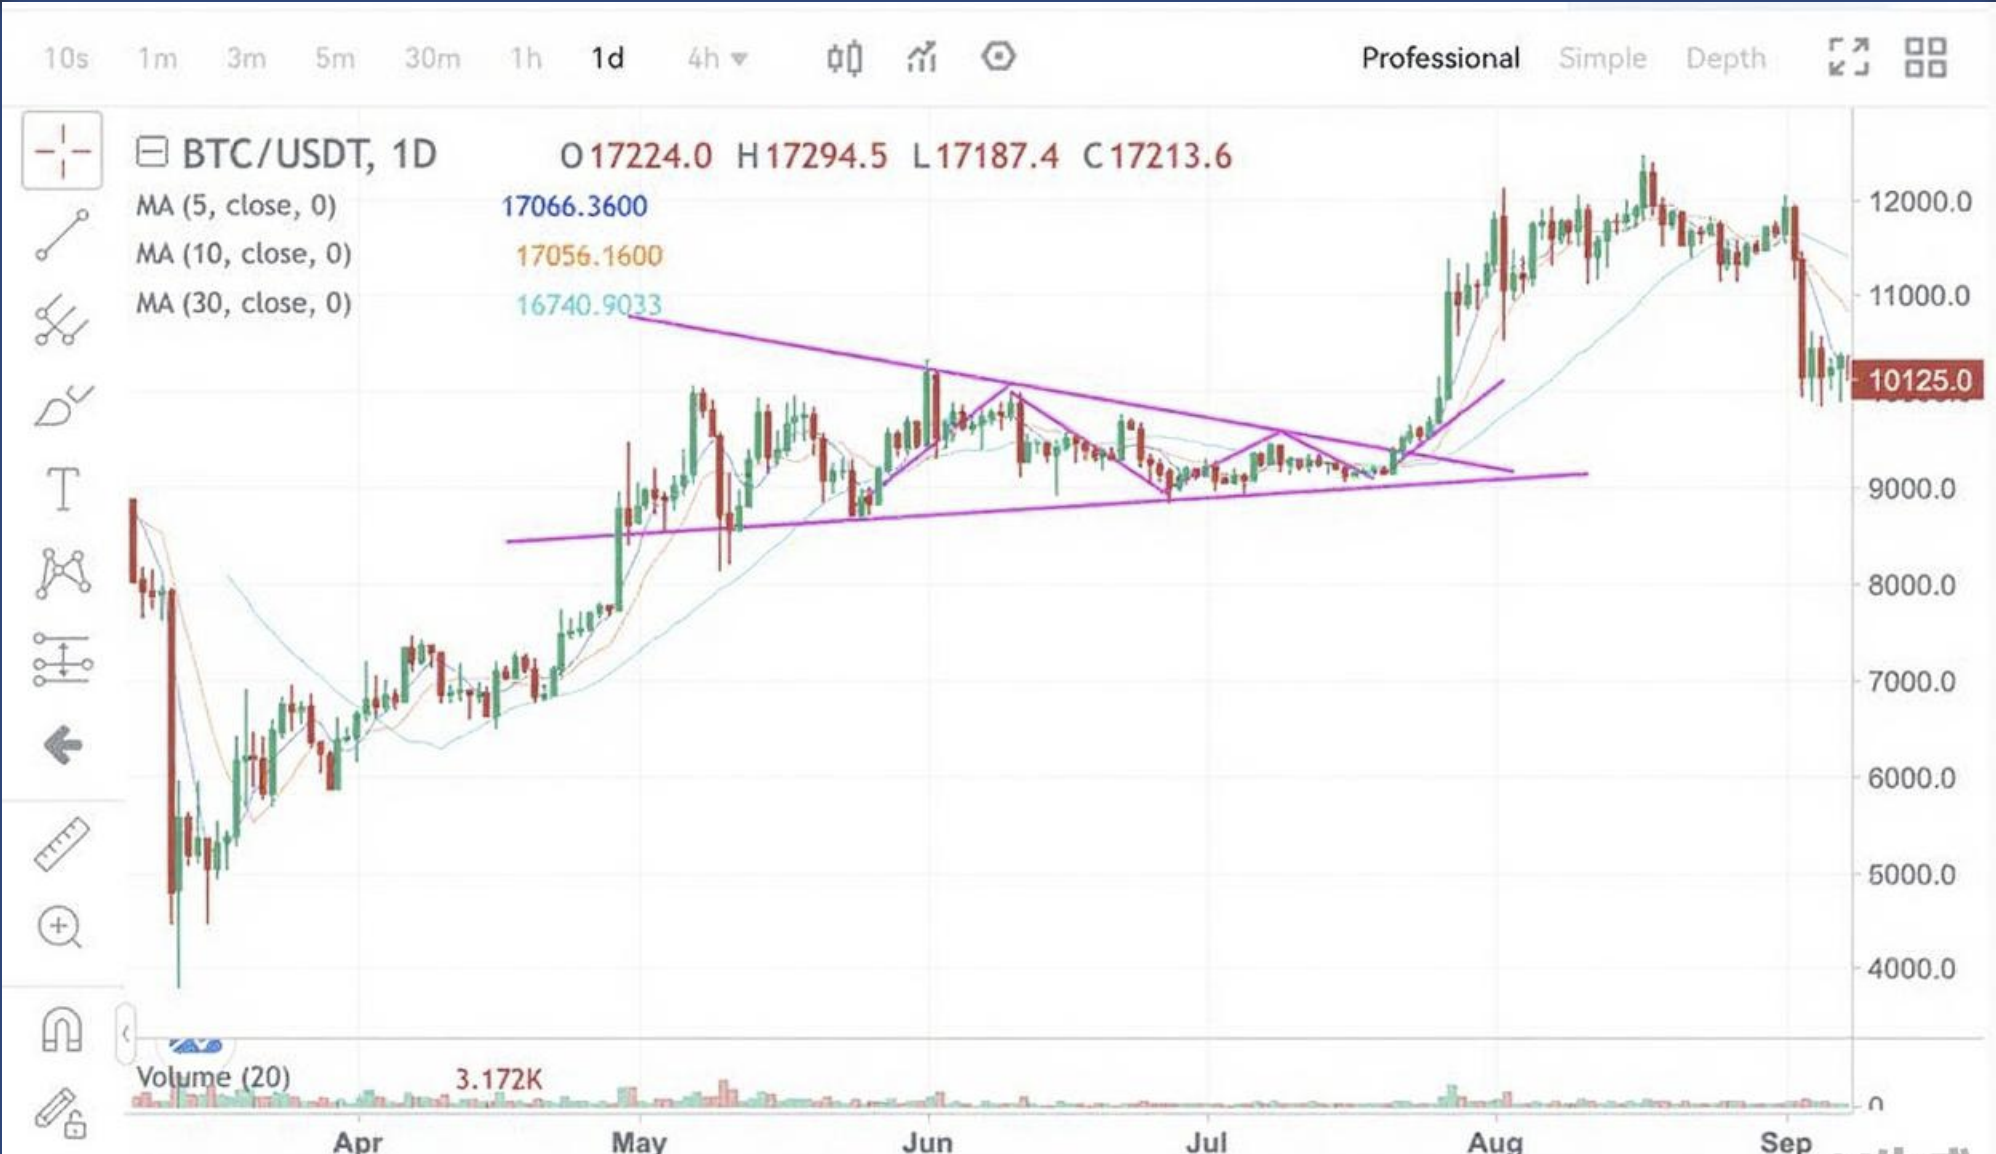
The chart above represents the daily candlestick pattern for Gate BTC futures, covering the period from April 29, 2020, to July 27, 2020. Starting in March 2020, BTC embarked on a robust upward trend, moving from around $5,000 and peaking above $10,000 on June 11, 2020. It then oscillated at these higher levels, with the trend progressively converging, culminating in a distinct converging triangle pattern. On July 21, 2020, the coin's price surged past $9,500, breaking the upper boundary of the converging triangle towards its conclusion, which then paved the way for a significant bullish trend.
②. When the triangle is broken at the lower edge:
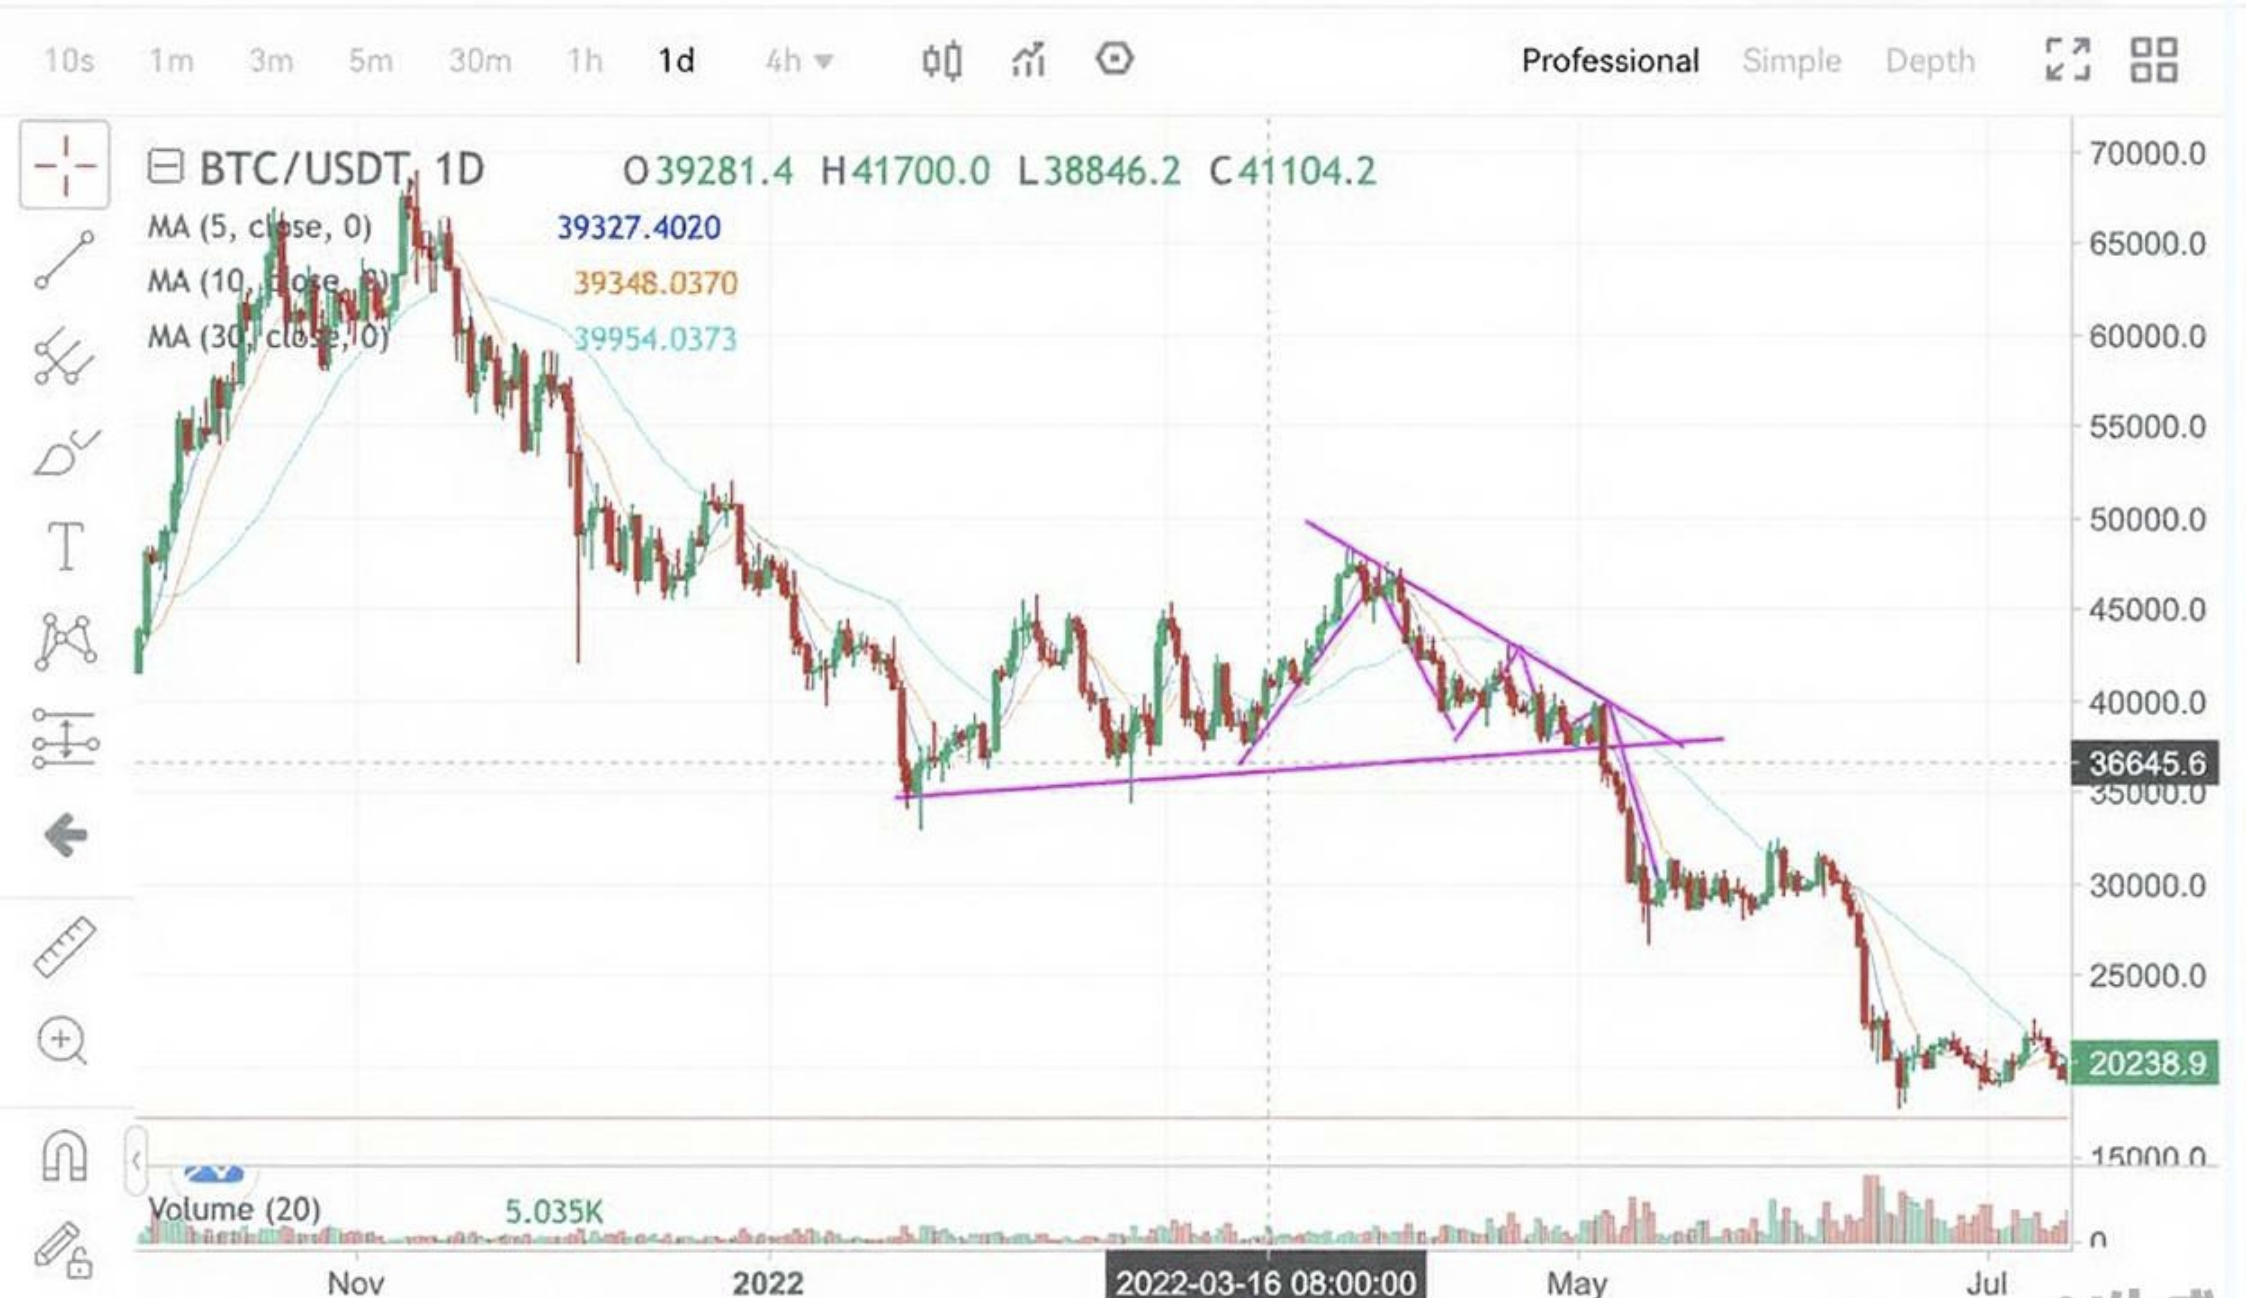
The chart above displays the daily candlestick for Gate BTC futures, covering the period from January 23, 2021, to May 1, 2021. BTC experienced a sharp decline from a peak of $66,000, bottoming out at $35,000, before oscillating between $35,000 and $47,000. As the balance between bulls and bears leveled out, a converging triangle emerged. Once the coin price dipped below $37,000, surpassing the triangle's lower boundary, it heralded the onset of a new bearish phase in the market.
6. Summary
It's essential to note that these three triangles, like all technical patterns, merely signal a possibility and do not guarantee a specific trend. As such, they should not be solely relied upon for decision-making. When trading signals are detected using these triangles, it's recommended to employ other technical methods for further confirmation.
The technical interpretation of triangles isn't about their shape or position but rather the direction in which the pattern is breached.
Start trading futures by registering on Gate Futures.

Disclaimer
This article is for informational purposes only and does not constitute investment advice. Gate is not responsible for any investment decisions you make. Content related to technical analysis, market assessments, trading skills, and traders' insights should not be considered a basis for investment. Investing carries potential risks and uncertainties. This article offers no guarantees or assurances of returns on any type of investment.
Disclaimer
The content provided herein is for reference and educational purposes only and does not constitute any financial, investment, trading, or legal advice, nor does it constitute an offer or solicitation to buy or sell any digital assets. Gate makes no express or implied representations or warranties regarding the accuracy, completeness, or timeliness of the information contained herein. Product features, interfaces, rules, and fee structures may be updated or adjusted at any time. Please refer to the latest announcements and the actual information displayed on the Gate platform for the most accurate details.
Digital asset investments involve significant risk, and prices may fluctuate substantially. You may lose the entire amount of your investment. Please make decisions cautiously based on your own financial situation and risk tolerance after fully understanding the associated risks. If necessary, you are advised to consult an independent professional financial or legal advisor.
For more information about potential risks, please refer to Gate's Risk Disclosure and User Agreement.
