Author: CryptoPunk
Five-year backtest shows: 3x leverage has almost no cost-effectiveness
Preliminary conclusion:
In the past five years of backtesting, the final return of a BTC triple leverage dollar-cost averaging strategy only outperformed a double leverage by 3.5%, but at the cost of nearly zeroing out the risk.
From a comprehensive view of risk, return, and implementability—spot dollar-cost averaging is actually the best long-term solution; 2x is the limit; 3x is not worth it.
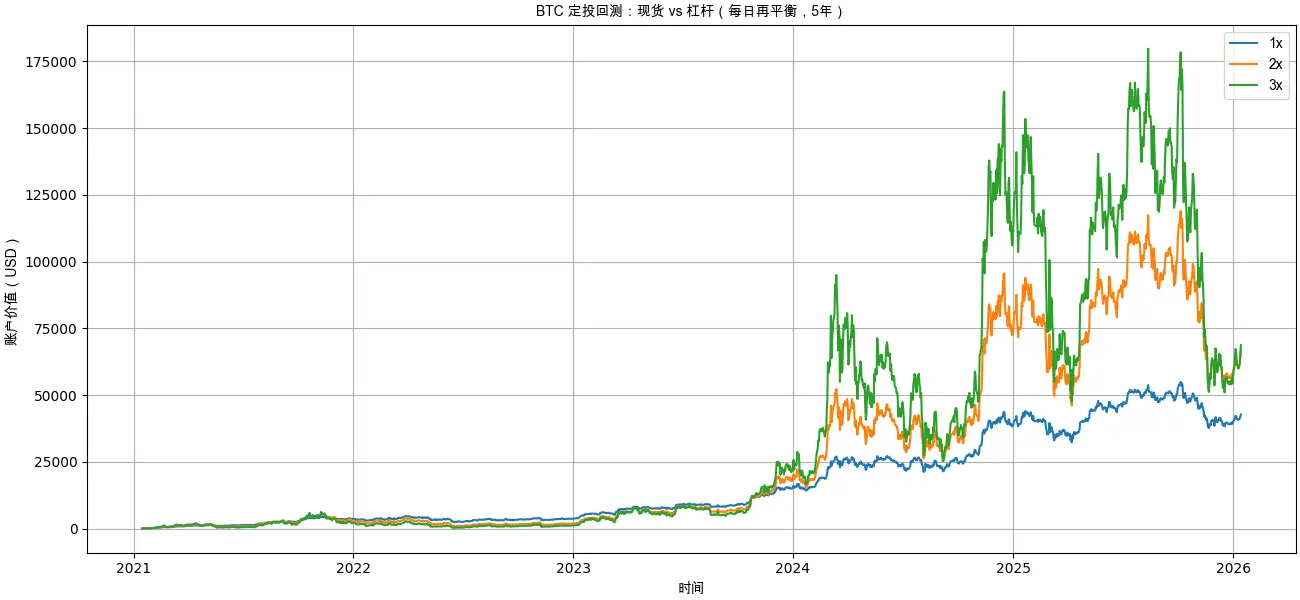
Part I | Five-year DCA net value curve: 3x does not “create a gap”
| Key Metrics | 1x Spot | 2x Leverage | 3x Leverage |
| Final Account Value (Final Value) | $42,717.35 | $66,474.13 | $68,832.55 |
| Total Invested (Total Invested) | $18,250.00 | $18,250.00 | $18,250.00 |
| Total Return (Total Return) | 134.07% | 264.24% | 277.16% |
| CAGR (CAGR) | 18.54% | 29.50% | 30.41% |
| Max Drawdown (Max Drawdown) | -49.94% | -85.95% | -95.95% |
| Sortino Ratio (Sortino Ratio) | 0.47 | 0.37 | 0.26 |
| Calmar Ratio (Calmar Ratio) | 0.37 | 0.34 | 0.32 |
| Ulcer Index (Ulcer Index) | 0.15 | 0.37 | 0.51 |
From the net value trend, it’s clear that:
- Spot (1x): The curve is smooth and upward, with controlled drawdowns
- 2x leverage: Significantly amplifies gains during bull markets
- 3x leverage: Multiple “ground-hugging” moves, long-term erosion due to oscillations
Although in the rebound of 2025–2026, 3x slightly outperformed 2x,
but over several years, the 3x net value always lagged behind 2x.
Note: This backtest used daily rebalancing for leverage, which introduces volatility decay.
This means:
The final victory of 3x heavily depends on “the last phase of the market”
Part II | Final return comparison: Marginal gains from leverage diminish rapidly
| Strategy |
Final Asset |
Total Invested |
CAGR |
| 1x Spot |
$42,717 |
$18,250 |
18.54% |
| 2x Leverage |
$66,474 |
$18,250 |
29.50% |
| 3x Leverage |
$68,833 |
$18,250 |
30.41% |
The key is not “who earns the most,” but how much extra:
- 1x → 2x: earns about $23,700 more
- 2x → 3x: earns only about $2,300 more
Returns hardly grow, but risks increase exponentially
Part III | Max Drawdown: 3x is approaching “structural failure”
| Strategy |
Max Drawdown |
| 1x |
-49.9% |
| 2x |
-85.9% |
| 3x |
-95.9% |
Here’s a very critical real-world issue:
- -50%: psychologically tolerable
- -86%: requires +614% to recover
- -96%: requires +2400% to recover
In the 2022 bear market, 3x leverage has essentially “gone bankrupt mathematically,”
and subsequent profits are almost entirely from new investments at the bottom of the bear market.
( Part IV | Risk-adjusted returns: spot is actually the best
![])https://img-cdn.gateio.im/webp-social/moments-1a4e977f53083f5453636bf46a7cb9a7.webp###
| Strategy |
Sortino |
Ulcer Index |
| 1x |
0.47 |
0.15 |
| 2x |
0.37 |
0.37 |
| 3x |
0.26 |
0.51 |
This data shows three things:
- Spot risk-adjusted return per unit is highest
- The higher the leverage, the worse the downside “cost-effectiveness”
- 3x remains in deep drawdown zones long-term, with extreme psychological pressure
What does an Ulcer Index of 0.51 mean?
The account stays “underwater” for a long time, almost giving no positive feedback
( Why does 3x leverage perform so poorly long-term?
The reason is simple:
Daily rebalancing + high volatility = continuous decay
In oscillating markets:
- Rising → add to position
- Falling → reduce position
- No change → account continues to shrink
This is a classic volatility drag.
And its destructive power is proportional to the square of the leverage multiple.
On high-volatility assets like BTC,
3x leverage bears a 9-fold volatility penalty.
) Final conclusion: BTC itself is already a “high-risk asset”
The answer from this five-year backtest is very clear:
- Spot dollar-cost averaging: optimal risk-return ratio, suitable for long-term
- 2x leverage: aggressive upper limit, only for a few
- 3x leverage: extremely low long-term cost-effectiveness, not suitable as a dollar-cost averaging tool
If you believe in BTC’s long-term value,
the most rational choice is often not “adding another layer of leverage,”
but letting time work in your favor, not against you.
Disclaimer: The information on this page may come from third parties and does not represent the views or opinions of Gate. The content displayed on this page is for reference only and does not constitute any financial, investment, or legal advice. Gate does not guarantee the accuracy or completeness of the information and shall not be liable for any losses arising from the use of this information. Virtual asset investments carry high risks and are subject to significant price volatility. You may lose all of your invested principal. Please fully understand the relevant risks and make prudent decisions based on your own financial situation and risk tolerance. For details, please refer to
Disclaimer.
