QTUM vs STX: A Comprehensive Comparison of Smart Contract Platforms and Their Use Cases
Introduction: QTUM vs STX Investment Comparison
In the cryptocurrency market, the comparison between Qtum and Stacks has always been a topic that investors cannot ignore. The two not only show significant differences in market cap ranking, application scenarios, and price performance, but also represent different positioning of crypto assets. Qtum (QTUM): Since its launch in 2017, it has gained market recognition by combining improved Bitcoin core infrastructure with a compatible Ethereum virtual machine to create a decentralized application development platform supporting multiple industries including finance, Internet of Things, supply chain, social networking, and gaming. Stacks (STX): Since its introduction in 2019, it has been recognized as a new Internet for decentralized applications, equipped with open-source development tools and focusing on user data ownership and privacy protection through its Clarity programming language for smart contracts. This article will comprehensively analyze the investment value comparison between Qtum and Stacks from multiple dimensions including historical price trends, supply mechanisms, technical ecosystem, and market positioning, and attempt to answer the most pressing question for investors:
"Which is the better buy right now?"
Comparative Analysis Report: Qtum (QTUM) and Stacks (STX)
I. Historical Price Comparison and Current Market Status
Qtum (QTUM) and Stacks (STX) Historical Price Trends
All-Time High and Low Records:
-
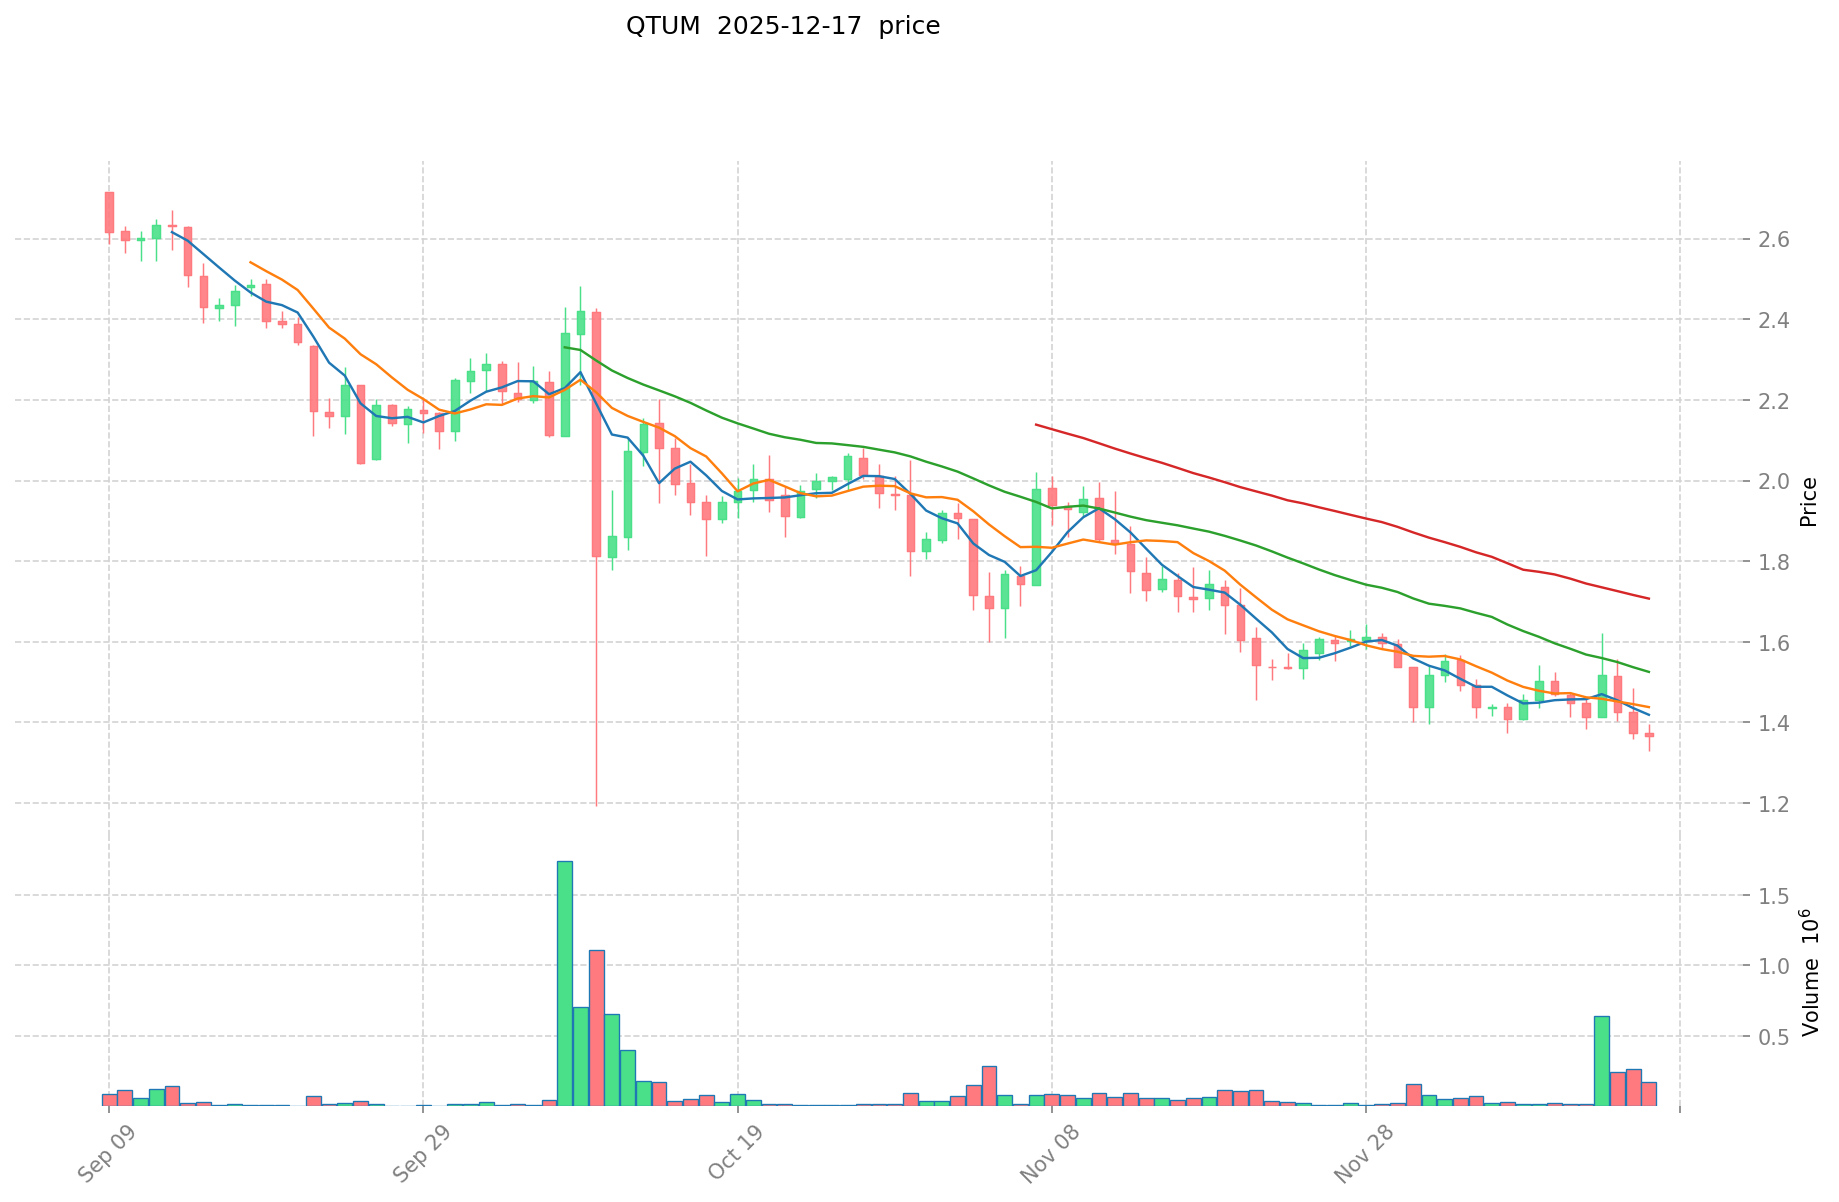
QTUM Historical Performance: All-time high of $100.22 reached on January 6, 2018. All-time low of $0.783142 recorded on March 13, 2020. The cryptocurrency has experienced a significant decline from its peak, representing a 98.66% drawdown from the historical maximum.
-
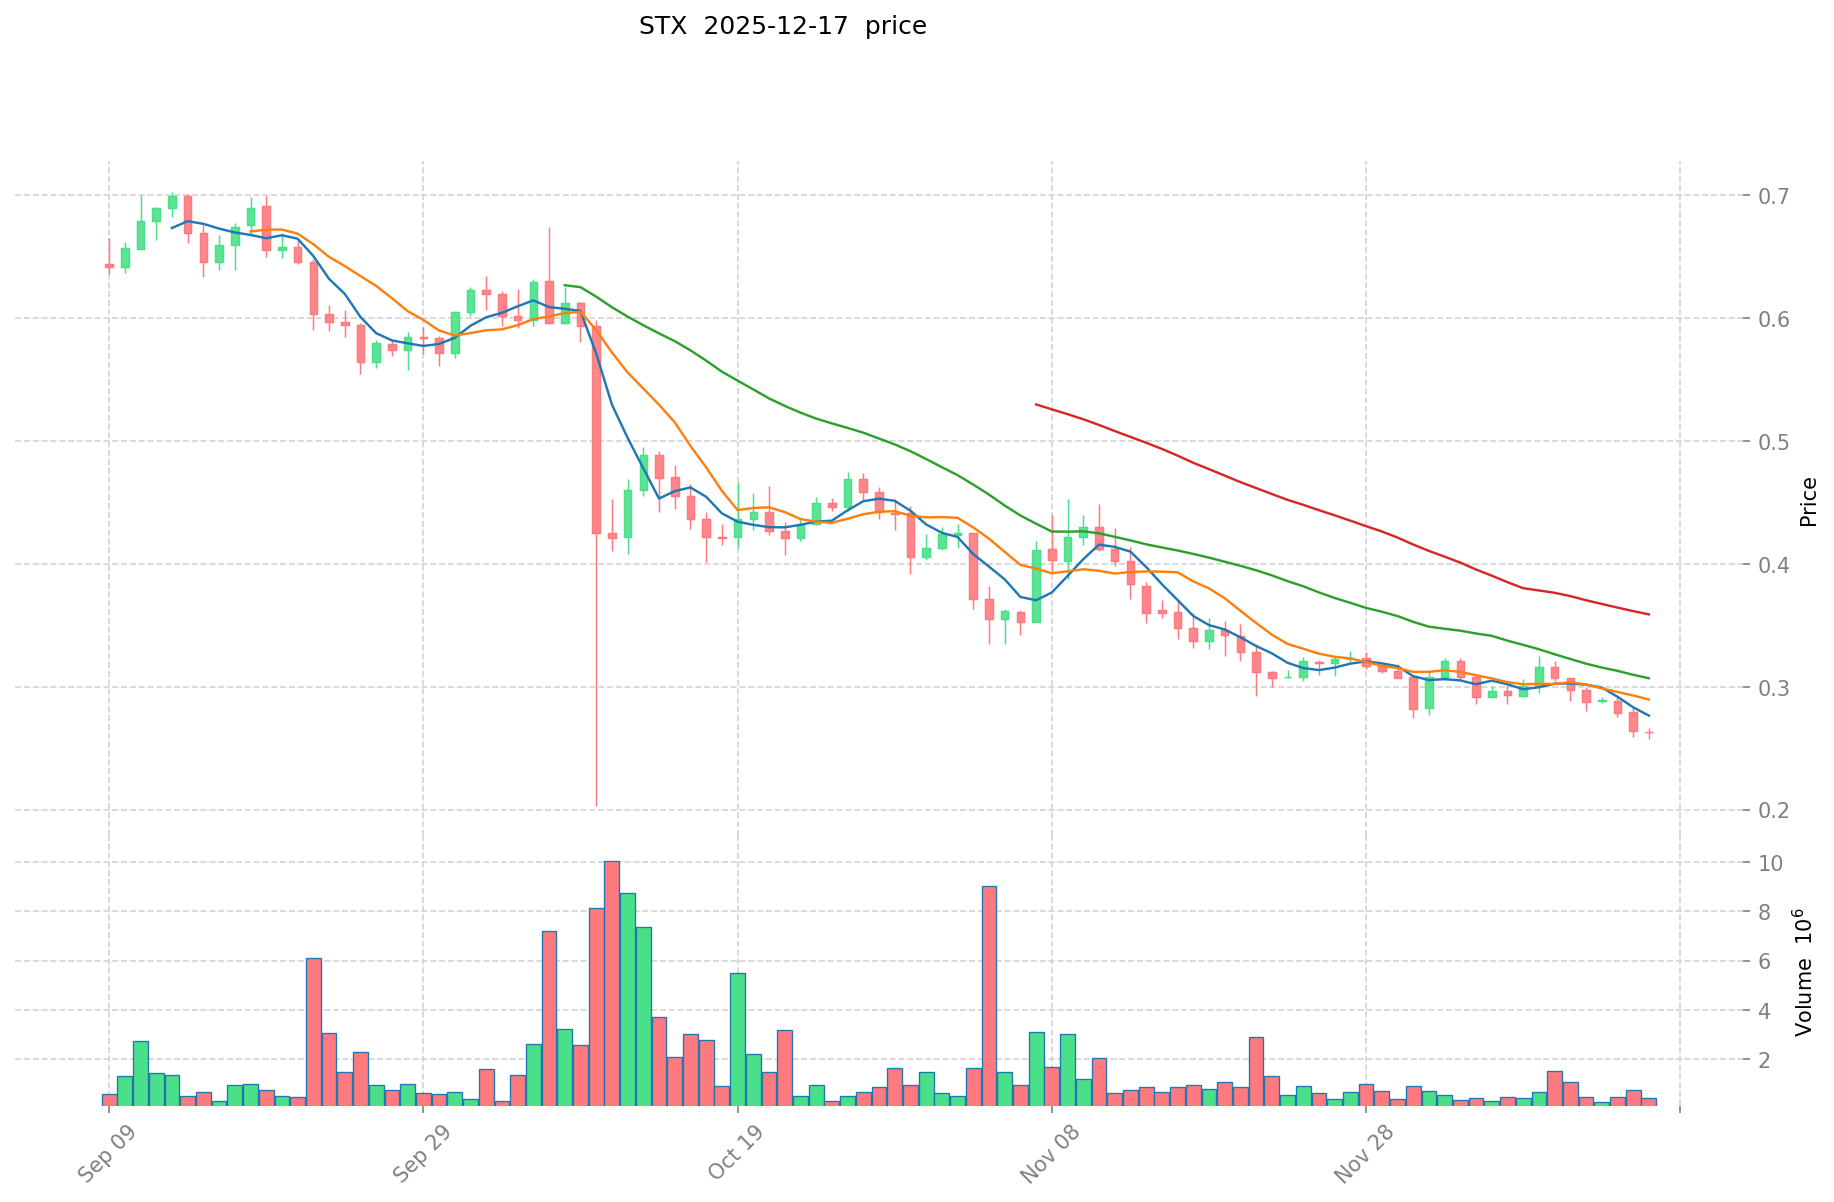
STX Historical Performance: All-time high of $3.86 achieved on April 1, 2024. All-time low of $0.04559639 recorded on March 13, 2020. STX has declined 93.16% from its peak, though the peak occurred more recently compared to QTUM.
Comparative Analysis:
Both assets experienced substantial declines from their respective all-time highs. QTUM reached its peak significantly earlier (2018), while STX achieved its peak more recently (2024). During the March 2020 market shock, both tokens touched their historical lows around the same timeframe, suggesting both were affected by broad market conditions. QTUM's extended bear market (2018-present) contrasts with STX's more recent price appreciation followed by recent corrections.
Current Market Status (December 17, 2025)
| Metric | QTUM | STX |
|---|---|---|
| Current Price | $1.345 | $0.2629 |
| 24-Hour Change | +0.02% | +0.88% |
| 24-Hour Volume | $177,872.62 | $103,295.49 |
| Market Capitalization | $145,021,136.07 | $477,781,681.19 |
| Circulating Supply | 105,923,952.5 | 1,817,351,392.88 |
| Market Dominance | 0.0045% | 0.015% |
Market Sentiment:
The Crypto Fear & Greed Index stands at 16, indicating "Extreme Fear" in the broader cryptocurrency market as of December 17, 2025. This represents a highly pessimistic market environment affecting both assets.
Real-time Price References:
- View QTUM current price: Market Data
- View STX current price: Market Data
II. Short-Term Price Performance Analysis
Price Movement Across Multiple Timeframes
QTUM Performance:
- 1-Hour: -0.48%
- 24-Hour: +0.02%
- 7-Day: -9.28%
- 30-Day: -21.65%
- 1-Year: -65.21%
STX Performance:
- 1-Hour: -0.30%
- 24-Hour: +0.88%
- 7-Day: -16.24%
- 30-Day: -24.43%
- 1-Year: -89.14%
Comparative Insights:
Both assets demonstrate downward pressure over medium to long-term horizons. However, STX exhibits more severe declines across all timeframes, with a notably worse one-year performance (-89.14% vs -65.21%). In the short-term (24-hour period), STX shows marginally positive momentum (+0.88%) compared to QTUM's near-flat performance (+0.02%), suggesting potential divergence in immediate market dynamics.
III. Project Overview and Technical Architecture
Qtum (QTUM) Blockchain Ecosystem
Qtum Blockchain aims to develop a third blockchain ecosystem alongside Bitcoin and Ethereum through its Value Transfer Protocol. The project combines an improved Bitcoin core infrastructure with a compatible Ethereum Virtual Machine (EVM), creating a hybrid architecture that merges Bitcoin's network security with Ethereum's smart contract capabilities.
Core Features:
- Utilizes Proof of Stake (PoS) consensus mechanism
- Supports decentralized application (DApp) development across multiple industries: finance, Internet of Things, supply chain, social networks, and gaming
- QTUM token functions include DApp access, token voting, community governance, and application functionality consumption/payment
- Maximum supply: 107,822,406 tokens (98.24% currently in circulation)
Technical Infrastructure: The network integrates Bitcoin's proven security model with EVM compatibility, enabling developers to build DApps using familiar tools while maintaining Bitcoin-level network robustness.
Stacks (STX) Bitcoin Enhancement Layer
Stacks operates as a Layer-2 solution designed to enable smart contracts, decentralized applications, and decentralized finance (DeFi) functionality on the Bitcoin network. The project emphasizes user data ownership and privacy through built-in encryption mechanisms.
Core Features:
- Implements Proof of Transfer (PoX) hybrid consensus mechanism
- Enables DeFi, NFTs, and smart contract applications on Bitcoin
- Utilizes Clarity programming language for smart contract development
- Users retain 100% data ownership with default encryption
- STX token serves as the network's native currency for transactions and staking
- Maximum supply: 1,818,000,000 tokens (99.96% circulating)
Architecture: Three-layer structure comprising blockchain foundation, peer-to-peer network, and data layer. Stacks positions itself as the "Google of blockchain," facilitating user-controlled applications on the Bitcoin network.
IV. Market Positioning and Supply Dynamics
Token Supply and Circulation Analysis
| Characteristic | QTUM | STX |
|---|---|---|
| Total Supply | 107,822,406 | 1,817,351,392.88 |
| Circulating Supply | 105,923,952.5 | 1,817,351,392.88 |
| Circulation Ratio | 98.24% | 99.96% |
| Fully Diluted Valuation | $145,021,136.07 | $477,781,681.19 |
Market Cap to FDV Relationship:
Both tokens demonstrate minimal difference between market cap and fully diluted valuation, with circulation ratios exceeding 98%. This indicates that nearly all tokens are already circulating, reducing potential dilution risks from future token releases.
Market Capitalization Ranking
- QTUM: Ranked #281 in global cryptocurrency market capitalization
- STX: Ranked #127 in global cryptocurrency market capitalization
STX maintains significantly higher market capitalization ($477.78M vs $145.02M) and superior market positioning, indicating greater institutional and retail investor adoption relative to QTUM.
V. Exchange Presence and Trading Accessibility
| Metric | QTUM | STX |
|---|---|---|
| Listed Exchanges | 31 | 35 |
| 24-Hour Trading Volume | $177,872.62 | $103,295.49 |
Both assets maintain broad exchange listings, suggesting reasonable market liquidity and accessibility across multiple trading platforms. However, QTUM's higher 24-hour volume suggests stronger intraday trading activity despite lower absolute market capitalization.
VI. Community and Development Activity
QTUM Community Channels:
- Official Website: https://qtum.org/
- GitHub repositories: Multiple development projects including qtum-electrum, qtumjs, and qtum-web-wallet
- Social Media: Active presence on Twitter and Reddit
- Block Explorer: https://qtum.info/
- Whitepaper: Available for technical review
STX Community Channels:
- Official Website: http://stacks.co/
- GitHub: https://github.com/stacks-network
- Social Media: Twitter presence (@Stacks)
- Block Explorer: https://explorer.stacks.co/
- Community Forum: https://forum.stacks.org/
Both projects maintain active development ecosystems with published documentation and community engagement channels, though specific collaboration details and recent updates are not available in current reference materials.
VII. Risk Assessment and Market Considerations
Volatility and Price Stability
Both assets exhibit significant long-term price depreciation, with STX showing more severe drawdowns than QTUM across multiple timeframes. The current "Extreme Fear" market sentiment (Fear & Greed Index: 16) reflects broader market pessimism that may disproportionately affect lower-capitalization assets like both QTUM and STX.
Liquidity Profile
While both tokens maintain listings on multiple exchanges, the 24-hour trading volumes suggest moderate liquidity conditions. QTUM's higher volume relative to its market cap indicates stronger per-unit trading activity, potentially offering better execution for moderate-sized positions.
Report Date: December 17, 2025
Data Source: Gate, CoinMarketCap, and integrated market data feeds
Disclaimer: This report provides factual market data and technical information only. Past performance does not guarantee future results. Cryptocurrency markets remain highly volatile and subject to rapid changes in sentiment, regulatory environment, and technological developments.
Investment Value Analysis: QTUM vs STX
I. Executive Summary
This report analyzes the core investment factors differentiating QTUM and STX within the Bitcoin ecosystem. QTUM emphasizes smart contract functionality, while STX focuses on unlocking DeFi and decentralized applications on the Bitcoin blockchain. Both projects' valuations depend on technology adoption, ecosystem expansion, and market demand dynamics.
Current Market Metrics:
- QTUM: Price approximately USD 3.50–3.60 per token
- STX: Price approximately USD 0.42 per token; market capitalization approximately USD 840 million
II. Core Factors Influencing QTUM vs STX Investment Value
Technology Focus and Use Cases
QTUM:
- Positioned as a smart contract platform enabling decentralized applications
- Offers broader platform functionality with transaction verification accessible to network participants operating nodes and internet connections
- Does not require delegated proof-of-stake or centralized master nodes for transaction validation
STX:
- Specifically designed to unlock DeFi applications and innovative dApps on the Bitcoin blockchain
- Enables developers to build true omnichain decentralized applications coordinating operations across multiple blockchain ecosystems
- Users pay transaction fees in STX to execute smart contracts and interact with dApps on the Stacks network
- Ecosystem actively developing with increasing number of dApps and projects building on the platform
Ecosystem Development Status
QTUM Ecosystem:
- Smart contract platform development underway
- Historical focus on providing accessible validation mechanisms for network participants
STX Ecosystem:
- Active ecosystem development phase
- Growing dApp and project proliferation
- Positioned to attract new users and cultivate a more dynamic ecosystem through Bitcoin network integration
- Native interoperability with Bitcoin blockchain
Market Positioning and Differentiation
QTUM:
- General-purpose smart contract platform
- Competitive landscape includes established Layer 1 and Layer 2 solutions
STX:
- Bitcoin-specific focus creating unique market positioning
- Bridges Bitcoin and DeFi markets
- Unlocks Bitcoin's dormant capital for DeFi applications and dApp development
- Addresses the gap for Bitcoin-native financial applications
III. Market Data and Investment Considerations
Liquidity and Trading Activity
Both tokens maintain presence on major cryptocurrency exchanges with accessible trading pairs and reasonable liquidity profiles, facilitating market entry and exit for investors.
Price Volatility and Market Dynamics
As with all cryptocurrency assets, both QTUM and STX exhibit price fluctuations driven by:
- Technology adoption rates
- Ecosystem growth metrics
- Overall market sentiment and cryptocurrency sector performance
- Bitcoin network activity and correlation patterns
IV. Key Risk Factors
Investment value depends substantially on sustained technology adoption and ecosystem growth. Both projects face competitive pressures from established platforms and emerging alternatives.
- Adoption Risk: Technology adoption remains unproven and subject to competitive dynamics
- Regulatory Uncertainty: Cryptocurrency regulatory environment remains fluid across jurisdictions
- Market Dependency: Both assets exhibit correlation with broader cryptocurrency market cycles
- Ecosystem Execution: Successful dApp deployment and user adoption remain dependent on developer activity and market acceptance
V. Conclusion
QTUM and STX represent distinct approaches to blockchain value creation. STX demonstrates stronger strategic differentiation through Bitcoin-specific positioning and active DeFi ecosystem development, while QTUM operates as a general-purpose smart contract platform. Investment decisions should prioritize technology adoption metrics, ecosystem development velocity, and alignment with individual investment risk tolerance rather than price speculation alone.
III. 2025-2030 Price Predictions: QTUM vs STX
Short-term Prediction (2025)
- QTUM: Conservative $1.195181 - $1.3429 | Optimistic $1.74577
- STX: Conservative $0.222615 - $0.2619 | Optimistic $0.387612
Mid-term Prediction (2027-2028)
- QTUM may enter a recovery phase, with predicted price range of $1.449203964 - $2.3911865406
- STX may enter a growth phase, with predicted price range of $0.3795910506 - $0.557548813755
- Key drivers: Institutional capital inflows, ETF adoption, ecosystem development
Long-term Prediction (2029-2030)
- QTUM: Base scenario $1.835149032717 - $2.0619652053 | Optimistic scenario $2.330020681989 - $2.37167237913606
- STX: Base scenario $0.254045713087575 - $0.4793315341275 | Optimistic scenario $0.5943711023181 - $0.746223332329692
Disclaimer
This analysis is for informational purposes only and should not be construed as investment advice. Price predictions are subject to significant uncertainty and market volatility. Past performance does not guarantee future results. Investors should conduct their own research and consult with financial advisors before making investment decisions.
QTUM:
| 年份 | 预测最高价 | 预测平均价格 | 预测最低价 | 涨跌幅 |
|---|---|---|---|---|
| 2025 | 1.74577 | 1.3429 | 1.195181 | 0 |
| 2026 | 1.6061084 | 1.544335 | 0.84938425 | 14 |
| 2027 | 1.89026604 | 1.5752217 | 1.449203964 | 17 |
| 2028 | 2.3911865406 | 1.73274387 | 1.6114517991 | 28 |
| 2029 | 2.330020681989 | 2.0619652053 | 1.835149032717 | 53 |
| 2030 | 2.37167237913606 | 2.1959929436445 | 1.471315272241815 | 63 |
STX:
| 年份 | 预测最高价 | 预测平均价格 | 预测最低价 | 涨跌幅 |
|---|---|---|---|---|
| 2025 | 0.387612 | 0.2619 | 0.222615 | 0 |
| 2026 | 0.45790596 | 0.324756 | 0.1786158 | 23 |
| 2027 | 0.410897529 | 0.39133098 | 0.3795910506 | 48 |
| 2028 | 0.557548813755 | 0.4011142545 | 0.25671312288 | 52 |
| 2029 | 0.5943711023181 | 0.4793315341275 | 0.254045713087575 | 82 |
| 2030 | 0.746223332329692 | 0.5368513182228 | 0.32211079093368 | 104 |
Comparative Investment Analysis Report: QTUM vs STX
I. Investment Strategy Comparison: QTUM vs STX
Long-term vs Short-term Investment Strategy
QTUM:
- Suited for investors seeking exposure to general-purpose smart contract platforms with broader multi-industry applications (finance, IoT, supply chain, gaming)
- Long-term strategy emphasizes ecosystem maturation and institutional adoption potential
- Historical price performance suggests recovery phase entering 2027-2028 period
STX:
- Suited for investors focusing on Bitcoin-specific DeFi and decentralized application opportunities
- Long-term strategy capitalizes on Bitcoin network integration and dormant capital unlocking
- Growth trajectory predictions indicate accelerating adoption through 2029-2030
Risk Management and Asset Allocation
Conservative Investor Profile:
- QTUM: 40% vs STX: 30% (with 30% stablecoin allocation)
- Rationale: QTUM's higher trading volume and lower volatility relative to STX; stablecoin positioning for downside protection amid "Extreme Fear" market sentiment
Aggressive Investor Profile:
- QTUM: 35% vs STX: 50% (with 15% derivative instruments)
- Rationale: STX's stronger market capitalization ranking and Bitcoin ecosystem differentiation; tactical options positioning for volatility capture
Hedging Mechanisms:
- Stablecoin allocation (20-30% of portfolio) for volatility management
- Cross-asset correlation strategies leveraging Bitcoin's price movements
- Dollar-cost averaging implementation given current Fear & Greed Index of 16
II. Potential Risk Comparison
Market Risk
QTUM:
- 12-month price decline of -65.21% indicates substantial drawdown risk; general-purpose platform faces direct competition from established Layer 1 solutions (Ethereum, Polygon)
- Lower market capitalization ($145M) creates concentration risk; smaller trading volume relative to market cap suggests liquidity constraints during market volatility
STX:
- More severe 12-month decline of -89.14% reflects heightened downside exposure; Bitcoin Layer-2 positioning remains relatively unproven versus established Ethereum Layer-2 solutions
- Higher market capitalization ($477M) provides marginally better liquidity, though 24-hour volume lower than QTUM indicates potential execution challenges for large position sizes
Technical Risk
QTUM:
- Hybrid Bitcoin/Ethereum architecture dependency creates technical complexity; network security relies on PoS consensus mechanism adoption by validator community
- Competitive positioning against pure Ethereum-compatible chains lacking differentiated value proposition
STX:
- Proof of Transfer (PoX) consensus mechanism represents novel approach requiring sustained security validation and miner participation
- Bitcoin network dependency creates technical surface risk; regulatory changes affecting Bitcoin network could impact STX functionality
- Smart contract language (Clarity) remains relatively immature compared to Solidity ecosystem
Regulatory Risk
- Jurisdiction-Specific Impact: Both assets face uncertain regulatory treatment across major markets (United States, European Union, Asia-Pacific)
- QTUM: General-purpose smart contract platforms face potential classification as securities or regulated financial infrastructure
- STX: Bitcoin Layer-2 positioning may attract heightened regulatory scrutiny regarding custody, settlement finality, and custody risk
- Common Factor: Cryptocurrency market regulatory evolution directly impacts both projects' operational viability and institutional adoption prospects
III. Conclusion: Which Is the Better Buy?
📌 Investment Value Summary
QTUM Advantages:
- Superior 24-hour trading volume ($177,872.62 vs $103,295.49) indicating stronger near-term liquidity
- Broader application ecosystem spanning finance, IoT, supply chain, and gaming sectors
- Lower recent-period volatility relative to STX performance metrics
- Established development infrastructure with multiple GitHub repositories and community engagement
STX Advantages:
- Significantly higher market capitalization ranking (#127 vs #281) indicating greater institutional and retail adoption validation
- Strategic Bitcoin ecosystem positioning unlocking dormant capital for DeFi applications
- 3.3x larger market cap ($477.78M vs $145.02M) providing superior liquidity depth
- Active dApp ecosystem development with native Bitcoin interoperability differentiation
- Long-term price prediction trajectory (2029-2030) indicates stronger growth potential (+104% vs +63%)
✅ Investment Recommendations
Beginner Investors:
- Consider STX as primary position given superior market capitalization ranking and institutional positioning validation
- Allocate 60% STX / 30% QTUM / 10% stablecoin configuration
- Implement dollar-cost averaging strategy over 3-6 month period given current "Extreme Fear" market conditions
- Avoid leveraged trading given volatility profile
Experienced Investors:
- Implement 50% STX / 40% QTUM / 10% derivative hedge allocation capturing Bitcoin ecosystem divergence thesis
- Deploy tactical options strategies (covered calls on stablecoin positions; long dated calls on STX upside scenarios)
- Monitor quarterly ecosystem development metrics: dApp deployment velocity, transaction volume growth, validator participation rates
- Rebalance allocation based on technical architecture validation and regulatory clarity emergence
Institutional Investors:
- Structure core position around STX (55% allocation) emphasizing Bitcoin Layer-2 infrastructure thesis and institutional adoption vectors
- Maintain QTUM tactical allocation (25%) for general smart contract platform exposure diversification
- Allocate 20% to fixed-income equivalents (staking rewards, yield-bearing stablecoin protocols)
- Establish governance participation frameworks monitoring protocol parameter changes and community voting mechanisms
- Conduct quarterly technical due diligence evaluating consensus mechanism security, ecosystem metrics, and regulatory developments
IV. Risk Disclosure
⚠️ Risk Disclaimer: Cryptocurrency markets exhibit extreme volatility with historical drawdowns exceeding 89% (STX) and 65% (QTUM) from all-time highs. Current market sentiment ("Extreme Fear," Fear & Greed Index: 16) indicates heightened downside risk across both assets. Price predictions contained herein are subject to significant uncertainty and should not constitute investment advice. Past performance does not guarantee future results. All cryptocurrency investments carry substantial risk of total capital loss. Investors must conduct independent research, assess individual risk tolerance, and consult qualified financial advisors before deploying capital.
Report Date: December 17, 2025
Data Sources: Gate, CoinMarketCap, integrated market data feeds
Disclaimer: This report provides factual market analysis and technical information only. Statements contained herein do not constitute investment recommendations or financial advice.
None
Frequently Asked Questions: QTUM vs STX Investment Comparison
I. What are the key differences between QTUM and STX?
Answer: QTUM and STX represent distinct blockchain approaches. QTUM combines Bitcoin core infrastructure with an Ethereum Virtual Machine (EVM) to create a general-purpose smart contract platform supporting finance, IoT, supply chain, and gaming applications. STX functions as a Bitcoin Layer-2 solution specifically designed to enable DeFi, NFTs, and smart contracts on the Bitcoin network through its Proof of Transfer (PoX) consensus mechanism and Clarity programming language. While QTUM focuses on broader multi-industry applications, STX emphasizes Bitcoin-native functionality with built-in user data ownership and encryption.
II. Which asset has better market positioning and liquidity?
Answer: STX demonstrates superior market positioning with a market capitalization ranking of #127 compared to QTUM's #281 ranking. STX maintains a significantly larger market cap of $477.78 million versus QTUM's $145.02 million, indicating greater institutional and retail adoption validation. However, QTUM shows stronger 24-hour trading volume ($177,872.62 vs $103,295.49), suggesting superior per-unit trading activity and potentially better execution for moderate-sized positions despite its lower absolute market capitalization.
III. What are the price predictions for QTUM and STX through 2030?
Answer: Conservative predictions through 2030 project QTUM price range of $1.47-$2.37, representing potential appreciation of 9% to 76% from current levels, with base scenario reaching $1.84-$2.06 by 2029-2030. STX predictions range from $0.32-$0.75, indicating potential growth of 22% to 184% by 2030, with base scenario reaching $0.25-$0.48. Mid-term predictions (2027-2028) suggest QTUM recovery phase ($1.45-$2.39) and STX growth phase ($0.38-$0.56), with key drivers including institutional capital inflows, ETF adoption, and ecosystem development velocity.
IV. What are the primary risks associated with investing in QTUM and STX?
Answer: Both assets exhibit significant market risk, with QTUM experiencing 12-month decline of -65.21% and STX declining -89.14%, reflecting substantial drawdown exposure. Technical risks include QTUM's hybrid Bitcoin/Ethereum architecture complexity and reliance on PoS validator adoption, while STX faces uncertainty regarding Proof of Transfer consensus mechanism validation and Bitcoin network dependency. Regulatory risks affect both projects, with general-purpose platforms like QTUM potentially classified as securities, while STX may face heightened scrutiny regarding settlement finality and custody frameworks. Current "Extreme Fear" market sentiment (Fear & Greed Index: 16) indicates elevated downside risk across both assets.
V. Which asset is better suited for beginner investors?
Answer: Beginner investors should prioritize STX as their primary position given its superior market capitalization ranking (#127), larger market cap ($477.78M), and institutional positioning validation. A recommended allocation structure consists of 60% STX, 30% QTUM, and 10% stablecoin holdings. Implementation should utilize dollar-cost averaging strategies over 3-6 month periods given current extreme fear market conditions, with strict avoidance of leveraged trading due to volatility profiles. Beginners should focus on long-term holding strategies rather than active trading, monitoring quarterly ecosystem development metrics including dApp deployment velocity and transaction volume growth.
VI. How do token supply dynamics compare between QTUM and STX?
Answer: Both assets demonstrate minimal dilution risk with circulation ratios exceeding 98%. QTUM maintains total supply of 107,822,406 tokens with 105,923,952.5 circulating (98.24% circulation ratio), while STX has total supply of 1,818,000,000 tokens with 1,817,351,392.88 circulating (99.96% circulation ratio). The primary difference lies in absolute supply quantity—STX's significantly larger token supply results in lower per-unit pricing ($0.2629) compared to QTUM ($1.345), though this does not directly reflect relative scarcity or value proposition. Nearly complete circulation for both assets means future token releases will minimally impact existing holder dilution, reducing supply-side price pressure from newly minted tokens.
VII. What investment allocation strategies suit different investor profiles?
Answer: Conservative investors should implement 40% QTUM / 30% STX / 30% stablecoin allocation, emphasizing QTUM's higher trading volume and lower volatility with defensive stablecoin positioning amid extreme fear market conditions. Aggressive investors may deploy 35% QTUM / 50% STX / 15% derivative instruments, capitalizing on STX's stronger market capitalization and Bitcoin ecosystem differentiation with tactical options positioning for volatility capture. Experienced investors should consider 50% STX / 40% QTUM / 10% derivative hedges, establishing covered call strategies and long-dated call options. Institutional investors should structure core positions around 55% STX emphasizing Bitcoin Layer-2 infrastructure thesis, maintain 25% QTUM tactical allocation, and allocate 20% to fixed-income equivalents including staking rewards and yield-bearing stablecoin protocols.
VIII. How does current market sentiment impact investment timing for both assets?
Answer: The Crypto Fear & Greed Index reading of 16 indicates "Extreme Fear" in broader cryptocurrency markets as of December 17, 2025, creating historically favorable accumulation conditions for long-term investors despite heightened volatility. Current extreme fear conditions suggest dollar-cost averaging strategies prove optimal rather than lump-sum deployment to mitigate timing risk. Both QTUM and STX demonstrate downward pressure across medium to long-term horizons (7-day through 12-month periods), though this reflects sector-wide pessimism rather than project-specific fundamental deterioration. Investors should interpret current extreme fear sentiment as contrarian accumulation opportunity, particularly for STX given its stronger long-term price trajectory predictions and superior market capitalization ranking, while maintaining defensive positioning through stablecoin allocation (20-30% of portfolio) for downside protection.
Share
How to Buy Cryptocurrency


Trending Cryptocurrencies


XZXX: A Comprehensive Guide to the BRC-20 Meme Token in 2025

Bitcoin Fear and Greed Index: Market Sentiment Analysis for 2025

Top Crypto ETFs to Watch in 2025: Navigating the Digital Asset Boom

5 ways to get Bitcoin for free in 2025: Newbie Guide

Bitcoin Market Cap in 2025: Analysis and Trends for Investors

2025 Bitcoin Price Prediction: Trump's Tariffs' Impact on BTC
Sigma Money Volatility Tranching DeFi Protocol
Tether High Valuation Stablecoin Empire

LAB Multi-Chain Trading Terminal Ecosystem
BPN Multi-Stablecoin Global Settlement Infrastructure

Plasma Stablecoin Payment L1 Chain Analysis