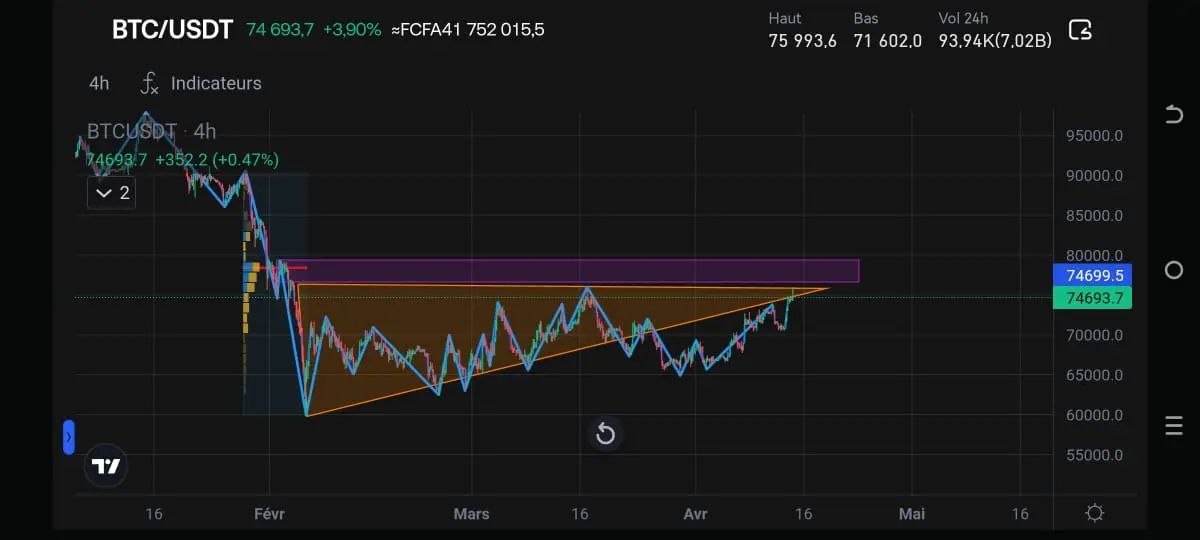
$BTC Technical analysis of BTC in Weekly (1W) 📊🔥bull-run
🪙 BTC Technical Analysis — Weekly
$BTC
📍 Current situation
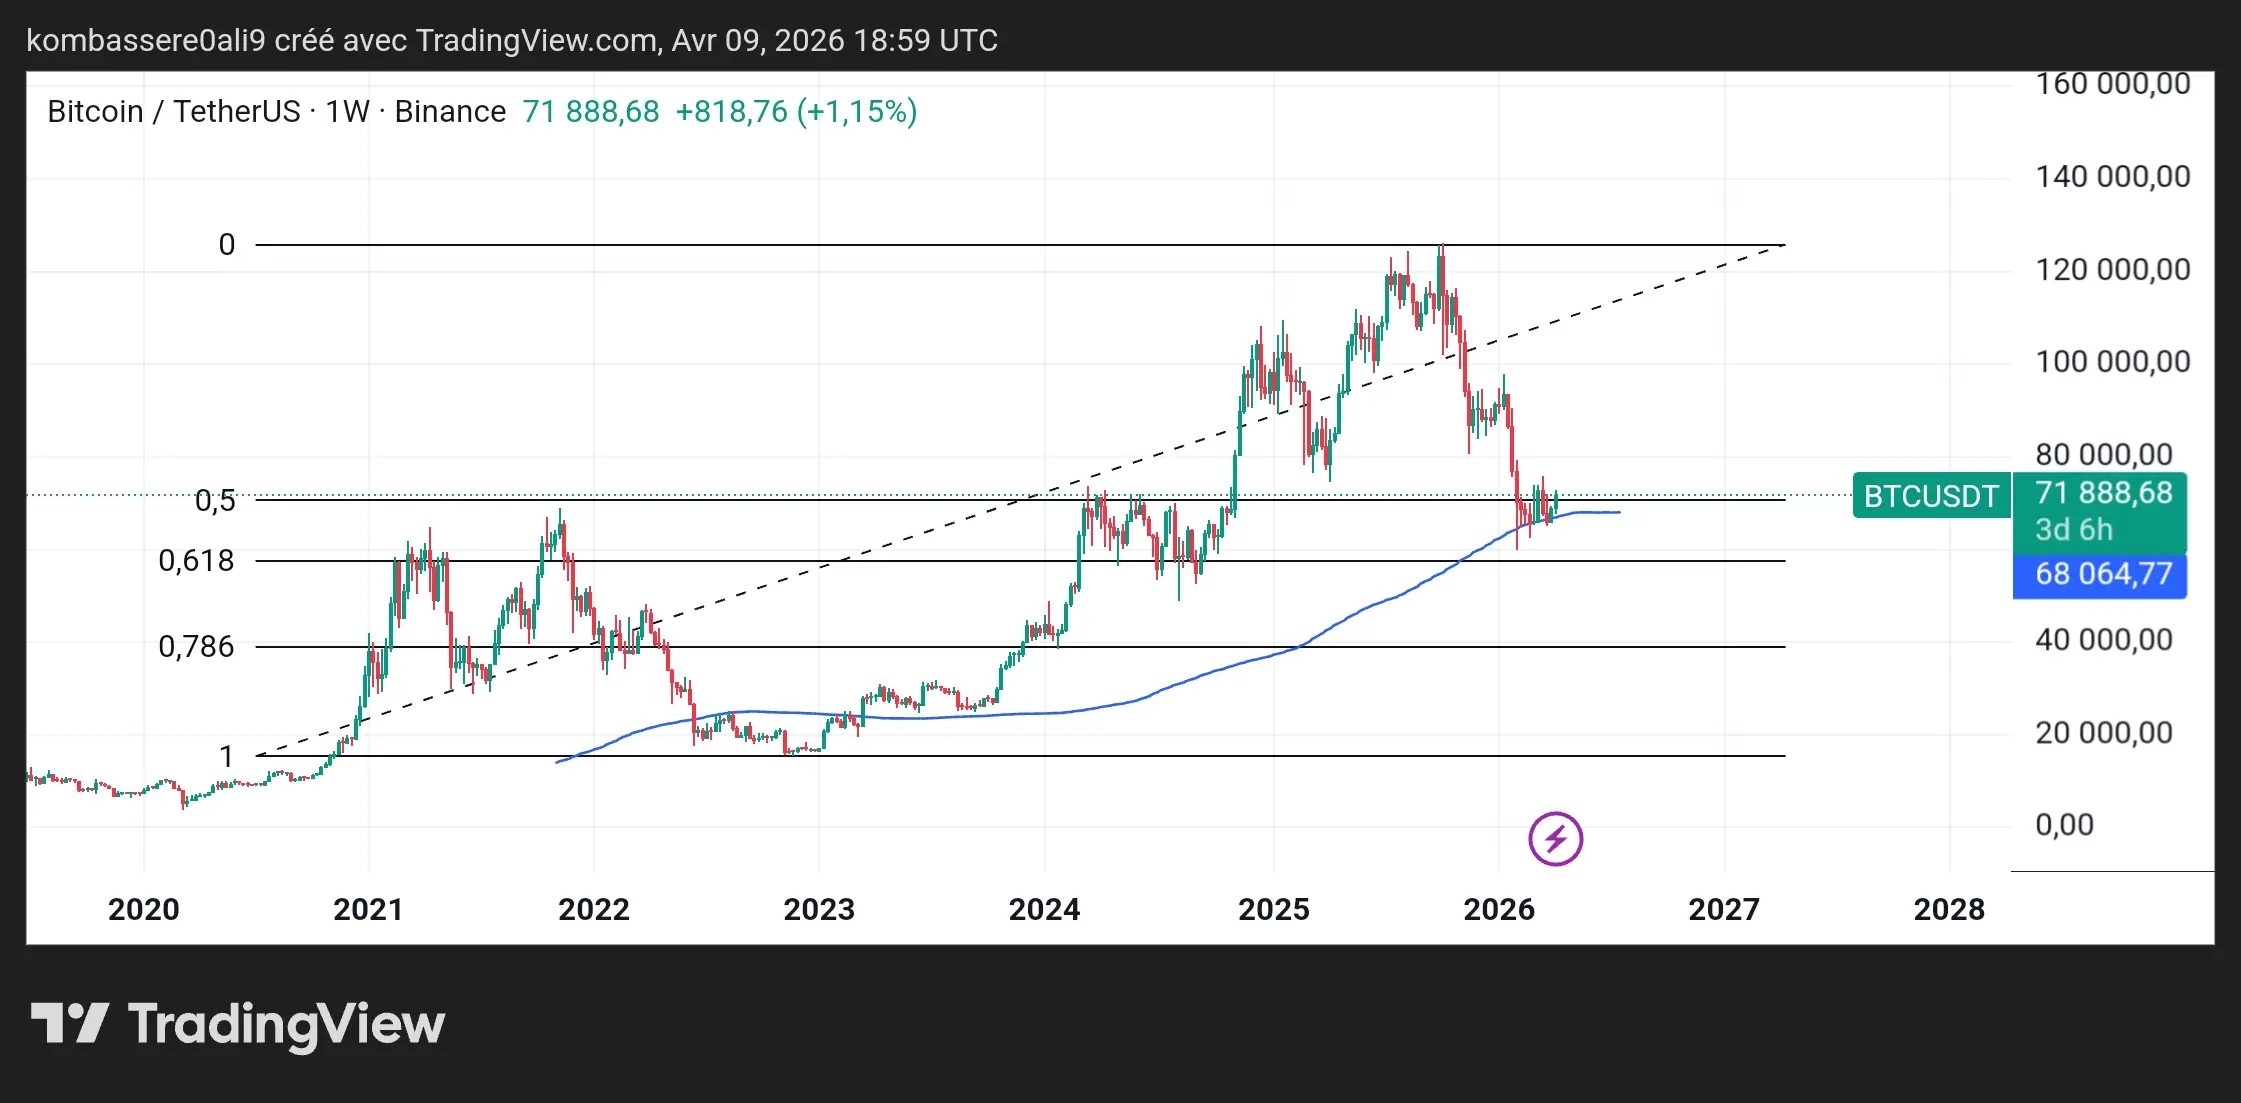
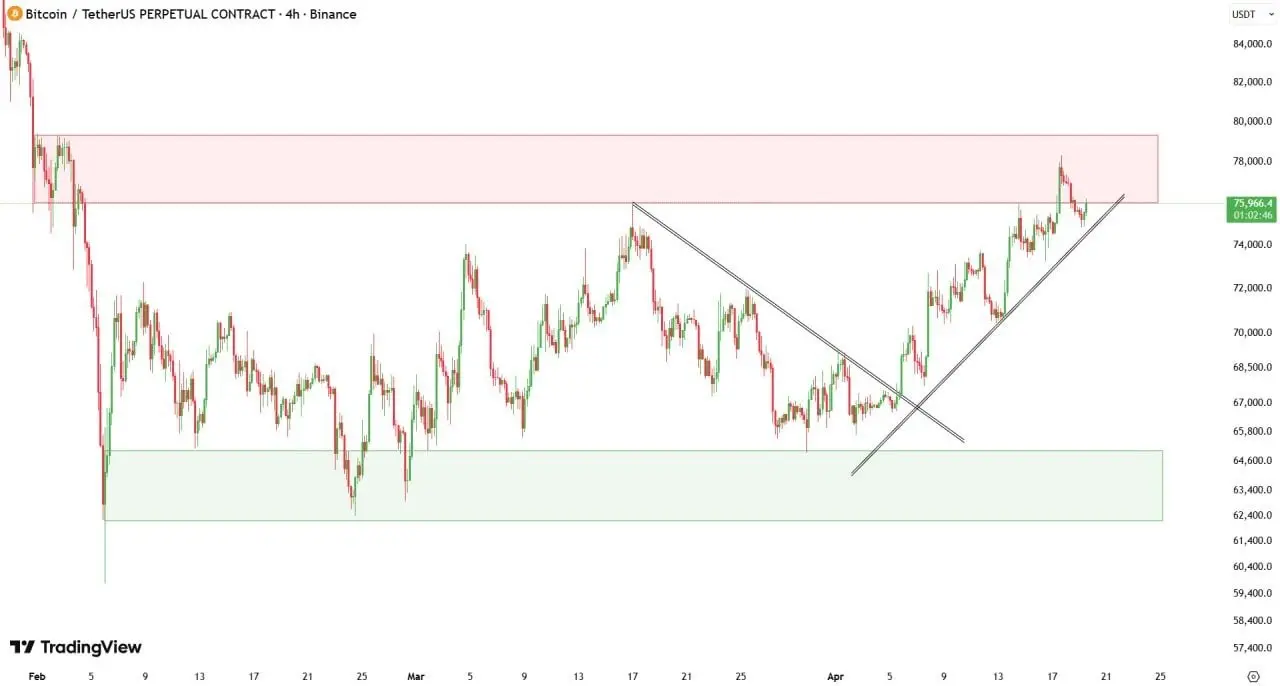
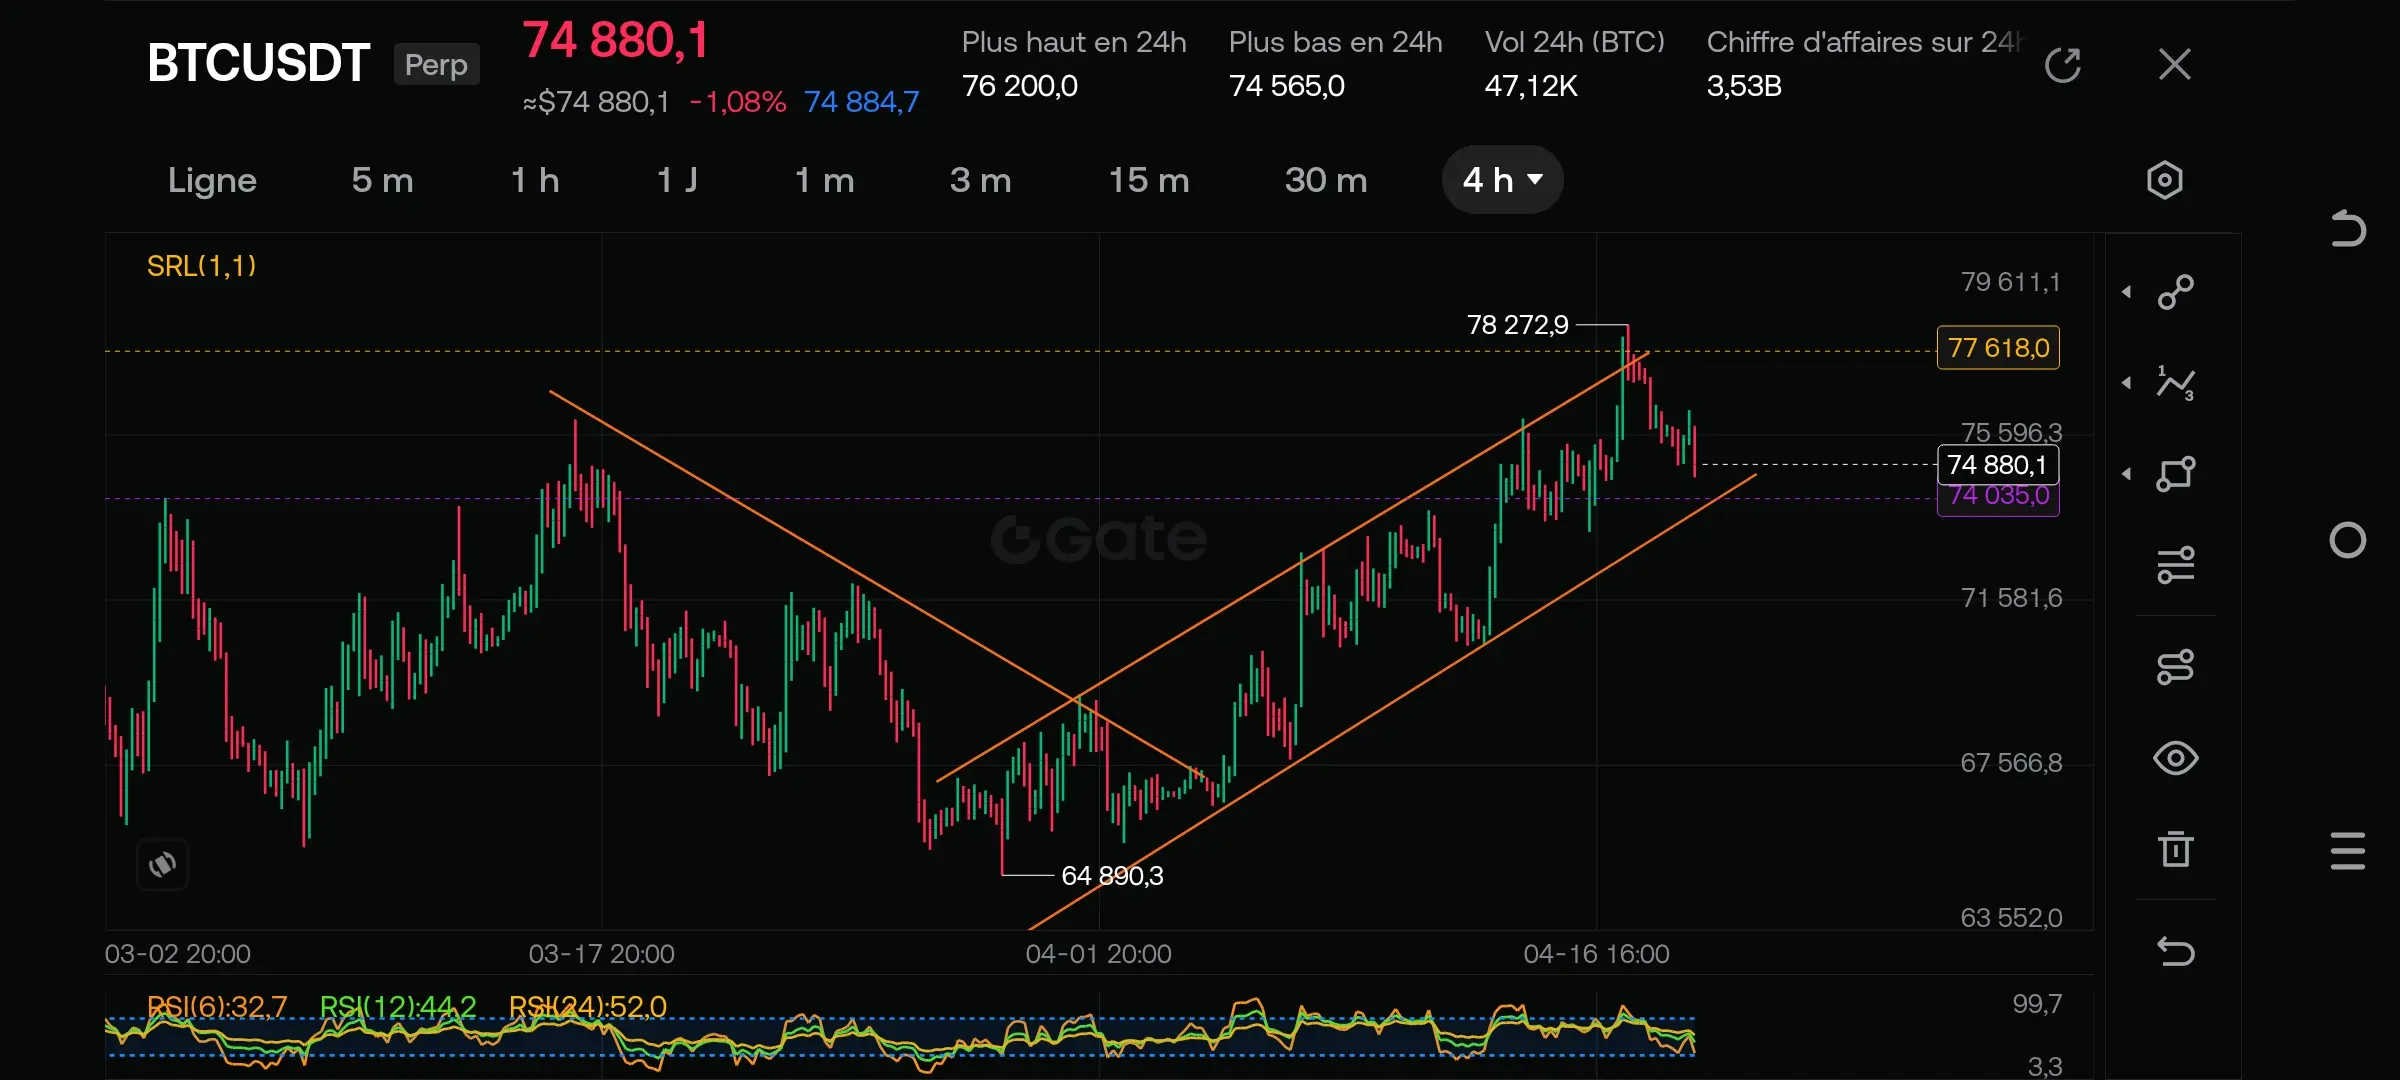
Current price: ~71,800 $
Timeframe: Weekly
Structure: Correction within a bull market
Clear observations:
A strong upward impulse up to ~120K
Then a violent correction
Now the price stabilizes around the key level 0.5 Fibonacci
📐 Important Fibonacci levels
According to your chart:
🔴 0.5 → ~70K (Current major support)
🟡 0.618 → ~60K (Critical support)
🟢 0.786 → ~40K-45K (Extreme support if a crash occurs)
👉 BTC is exactly on the 0.5 support. It’s a zone where whales often accumulate
📈 Market structure
Noticing:
1. Long-term trend still bullish
Higher Highs respected
Weekly MA (blue line) = dynamic support
BTC: Corrects
Lies on the moving average
Generally prepares the next impulse
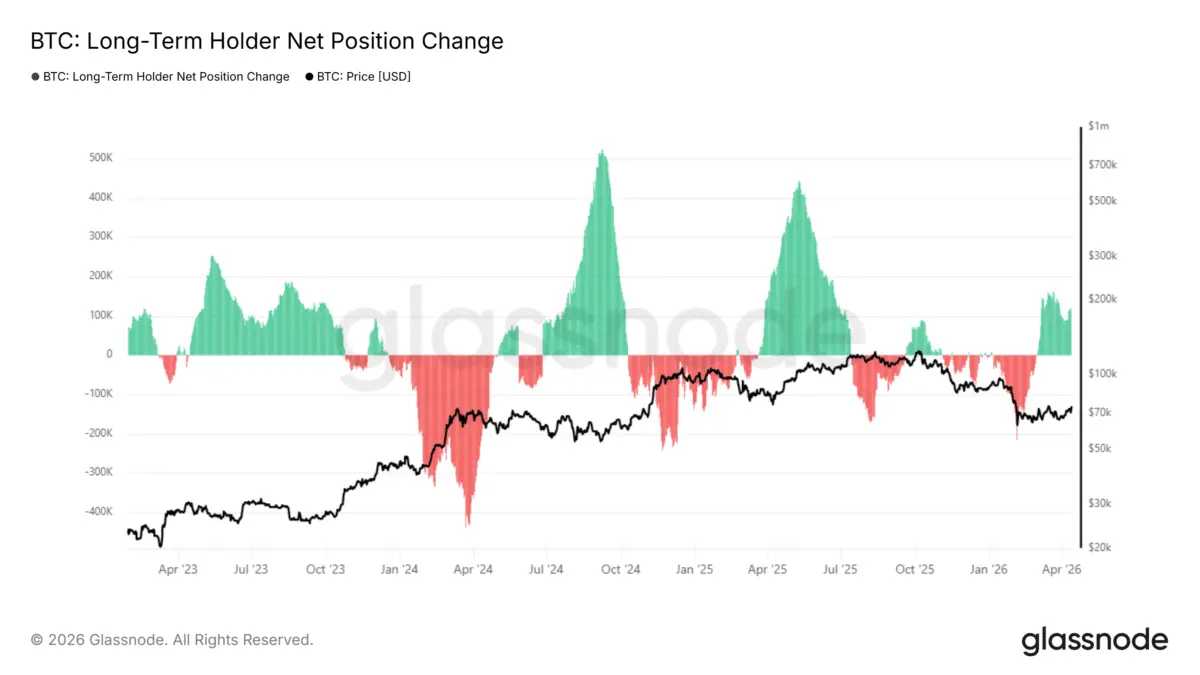
🐳 What whales are doing currently
Very important:
Violent dump (market fear)
Return to major support
Slow consolidation
👉 This is typically a silent accumulation zone
It’s exactly:
2020 before the bull run
2023 before the 2024 explosion
📊 Possible scenarios
🟢 Bullish scenario (most likely)
If BTC holds 70K
Targets:
85K
100K
120K (retest ATH)
140K — 160K (possible cycle peak)
🔴 Bearish scenario
If BTC breaks 70K
Next zones:
60K (0.618)
50K (psychological zone)
45K (extreme support)
But currently: 👉 The structure remains bullish
🧠 Market Psychological Reading
Currently:
Retail: fear
Whales: accumulation
Market: compression
➡️ Generally, this indicates a big explosion is coming
🔥 Very Important Signal
You notice:
Sharp drop
Then small weekly candles
Decreasing volatility
👉 This often precedes a major impulse
---
My Personal Opinion (as if I’m translating for myself)
I see:
Weekly accumulation zone
Major support respected
Bullish structure intact
➡️ I expect: a gradual bullish rebound then an explosive move
🧭 What pros are watching now
The confirmations:
Break 75K
Break 80K
Growing weekly volume
If this happens: 👉 The bull run seriously resumes