GateUser-b7a65f00
Trade
Trading Type
Spot
Trade crypto freely
Alpha
Points
Get promising tokens in streamlined on-chain trading
Pre-Market
Trade new tokens before they are officially listed
Margin
Magnify your profit with leverage
Convert & Block Trading
0 Fees
Trade any size with no fees and no slippage
Leveraged Tokens
Get exposure to leveraged positions simply
Futures
Futures
Hundreds of contracts settled in USDT or BTC
Options
HOT
Trade European-style vanilla options
Unified Account
Maximize your capital efficiency
Demo Trading
Futures Kickoff
Get prepared for your futures trading
Futures Events
Participate in events to win generous rewards
Demo Trading
Use virtual funds to experience risk-free trading
Earn
Launch
CandyDrop
Collect candies to earn airdrops
Launchpool
Quick staking, earn potential new tokens
HODLer Airdrop
Hold GT and get massive airdrops for free
Launchpad
Be early to the next big token project
Alpha Points
NEW
Trade on-chain assets and enjoy airdrop rewards!
Futures Points
NEW
Earn futures points and claim airdrop rewards
Investment
Simple Earn
Earn interests with idle tokens
Auto-Invest
Auto-invest on a regular basis
Dual Investment
Buy low and sell high to take profits from price fluctuations
Soft Staking
Earn rewards with flexible staking
Crypto Loan
0 Fees
Pledge one crypto to borrow another
Lending Center
One-stop lending hub
VIP Wealth Hub
Customized wealth management empowers your assets growth
Private Wealth Management
Customized asset management to grow your digital assets
Quant Fund
Top asset management team helps you profit without hassle
Staking
Stake cryptos to earn in PoS products
BTC Staking
HOT
Stake BTC and earn 10% APR
GUSD Minting
Use USDT/USDC to mint GUSD for treasury-level yields
More
GateUser-b7a65f00
No content yet
- Reward
- like
- Comment
- Repost
- Share
- Reward
- like
- Comment
- Repost
- Share
$TOTAL - [W]
- Reward
- like
- Comment
- Repost
- Share
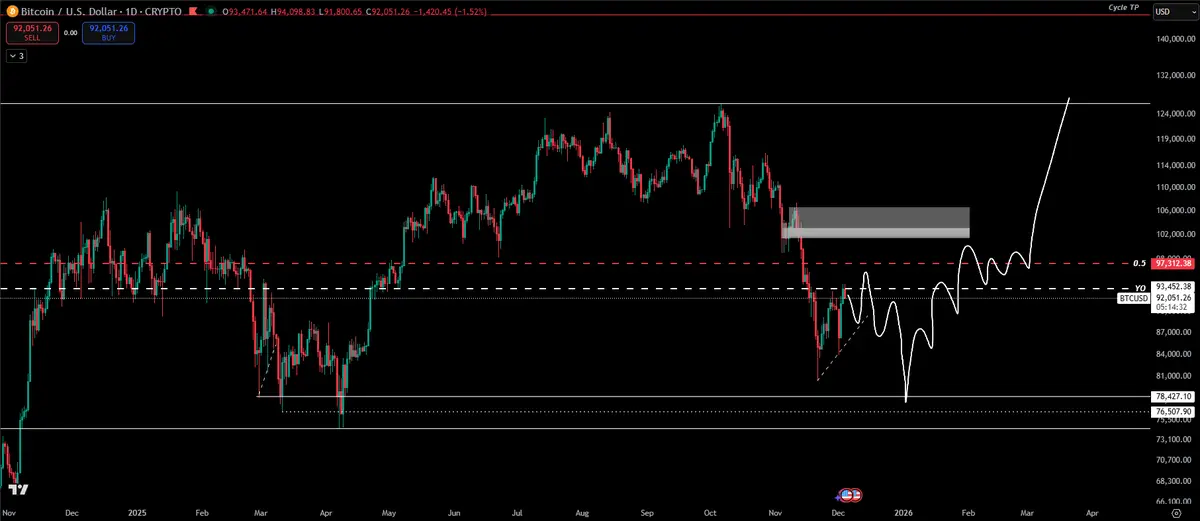
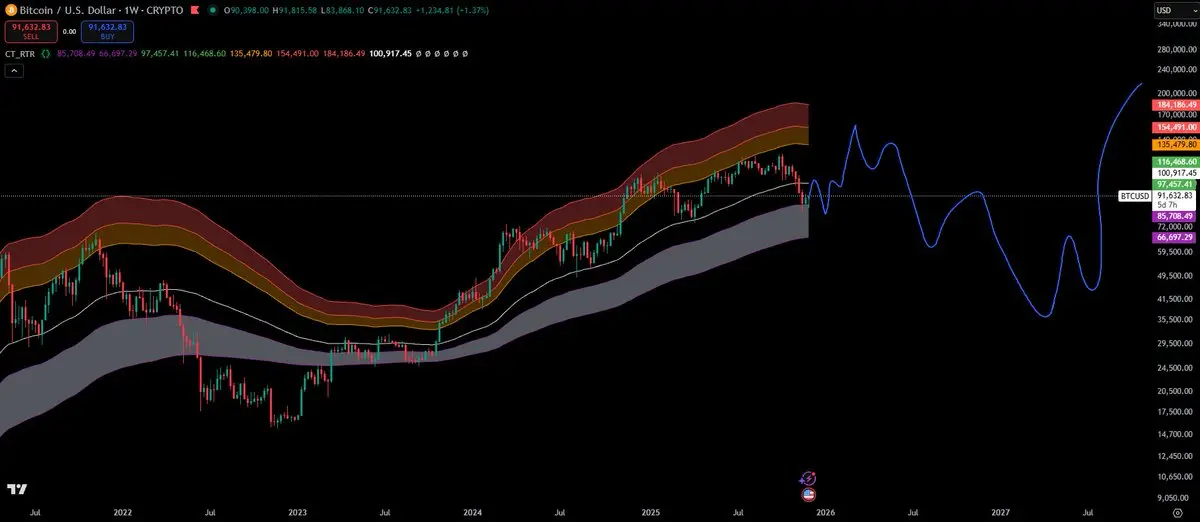
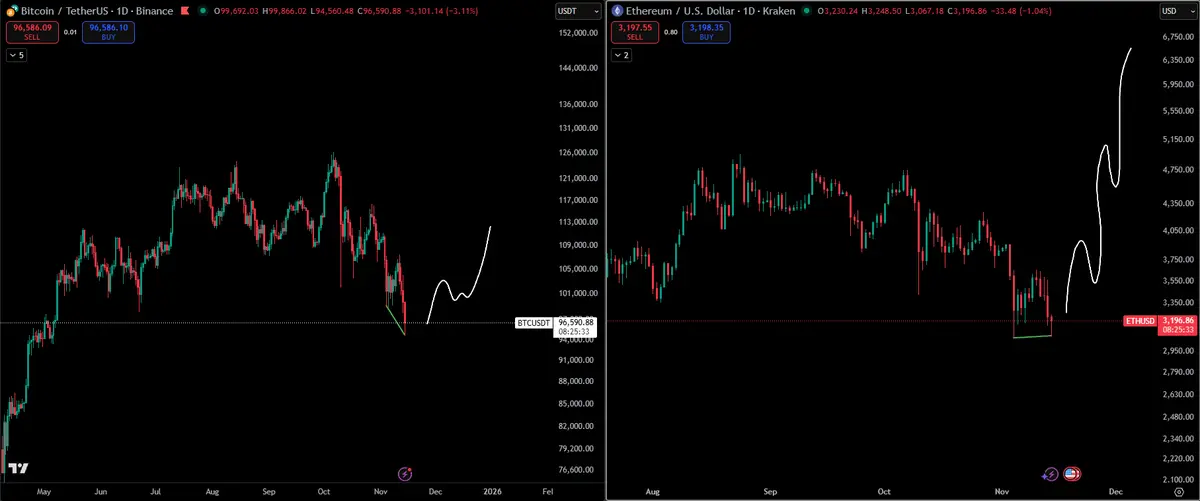
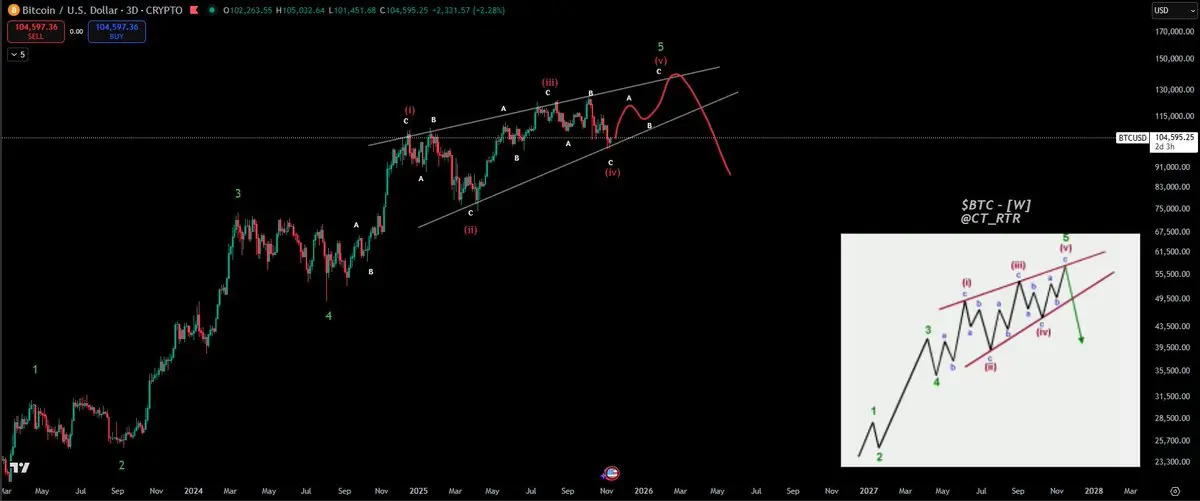
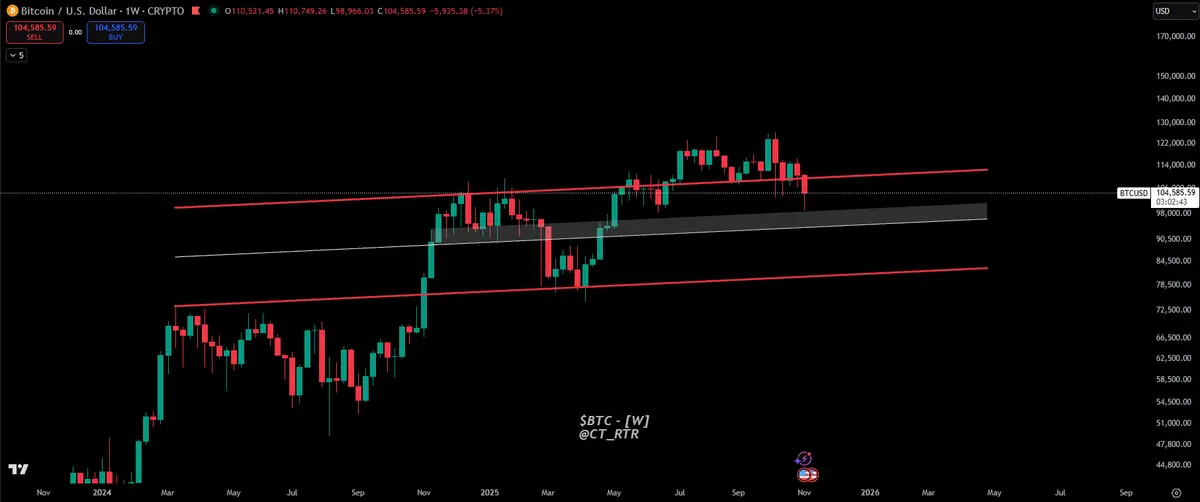
$BTC - [D]
Very easy chart to read.
I strongly believe the bottom formation won't be mirrored (three drives pattern excluded).
However, failing to push above the Yearly Open and mid-range levels soon enough suggests with a high probability the lows will be swept before any meaningful rally.
Rarely we have seen V-shape recoveries during the bull-run and I don't think it's the case here - hence I am trusting the white pattern to likely happen.
BTC-2.89%
- Reward
- like
- Comment
- Repost
- Share
- Reward
- like
- Comment
- Repost
- Share
- Reward
- like
- Comment
- Repost
- Share
Real resistance is at 100-105k$
- Reward
- like
- Comment
- Repost
- Share
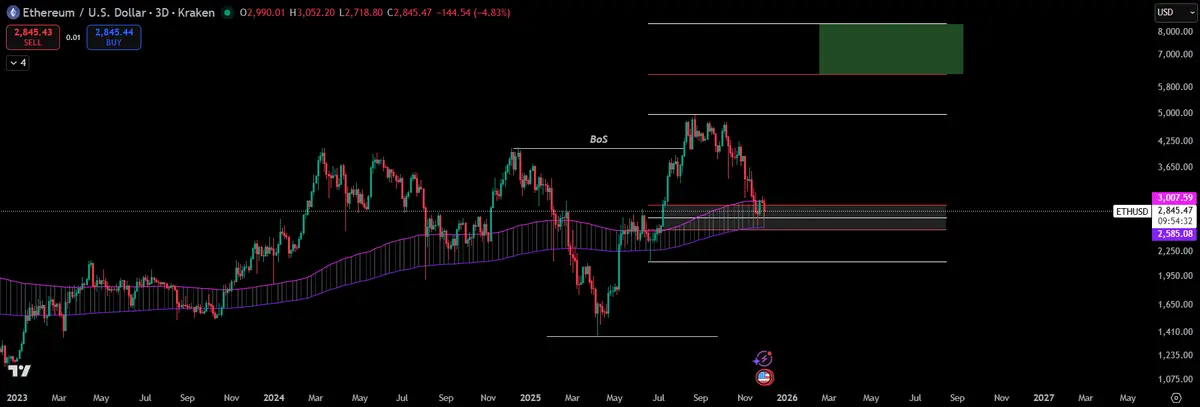
$ETH - [3D]
Timeline extra super bearish within support area.
Break of Structure to the upside (HH) and currently working on HL - bull trend intact.
Be bearish as much as you want, yes the market is brutal, but structure is intact and working on a bottom possibly.
Lose the bands and yes, you will be able to question the market, likely bear market confirmation.
ETH-4.96%
- Reward
- like
- Comment
- Repost
- Share
Back from London, let's see some charts
- Reward
- like
- Comment
- Repost
- Share
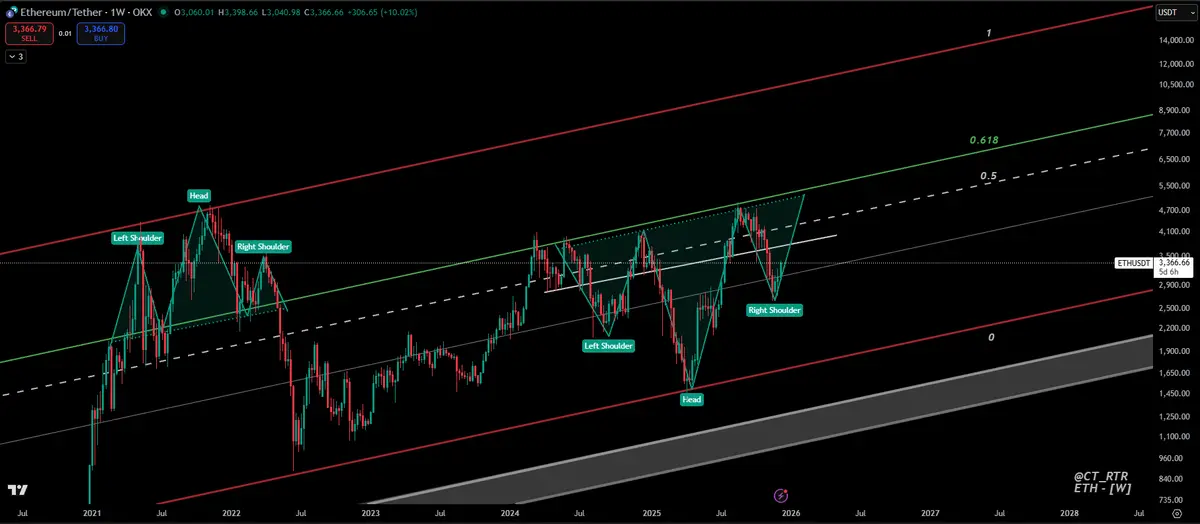
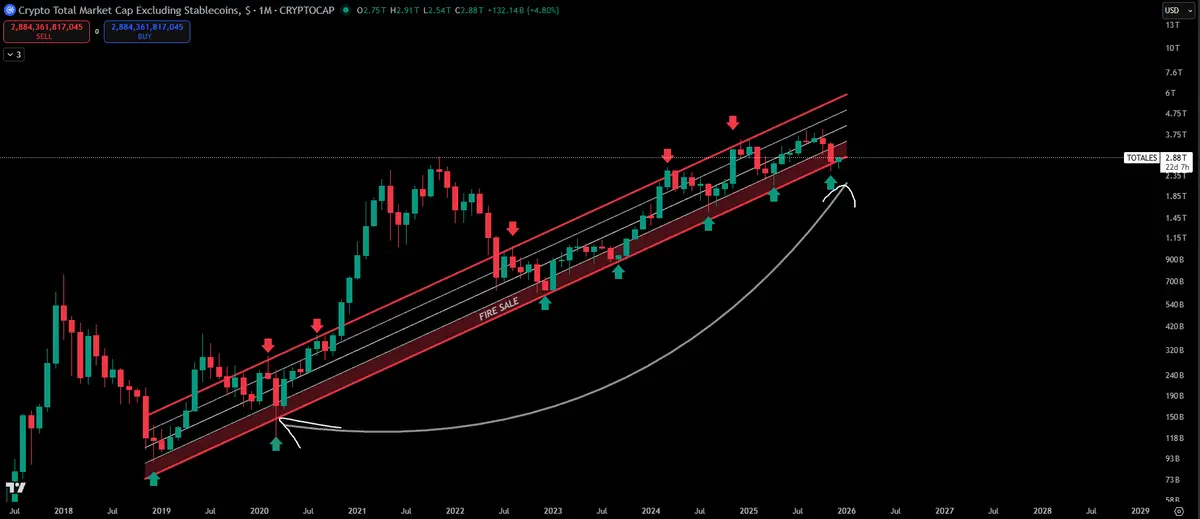
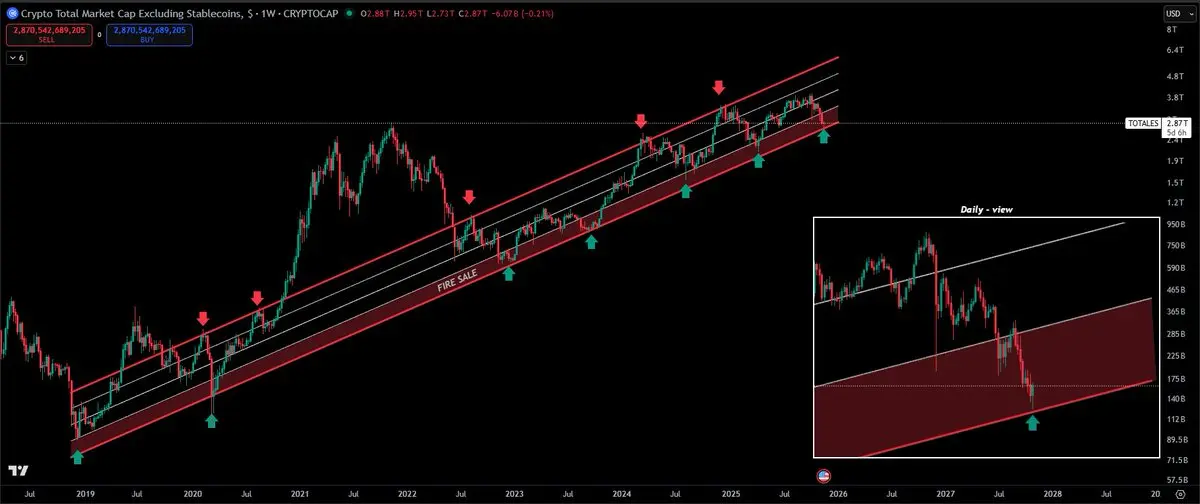
$TOTALES - [W]
Chart speaks for itself.
Chart speaks for itself.
- Reward
- like
- Comment
- Repost
- Share
- Reward
- like
- Comment
- Repost
- Share
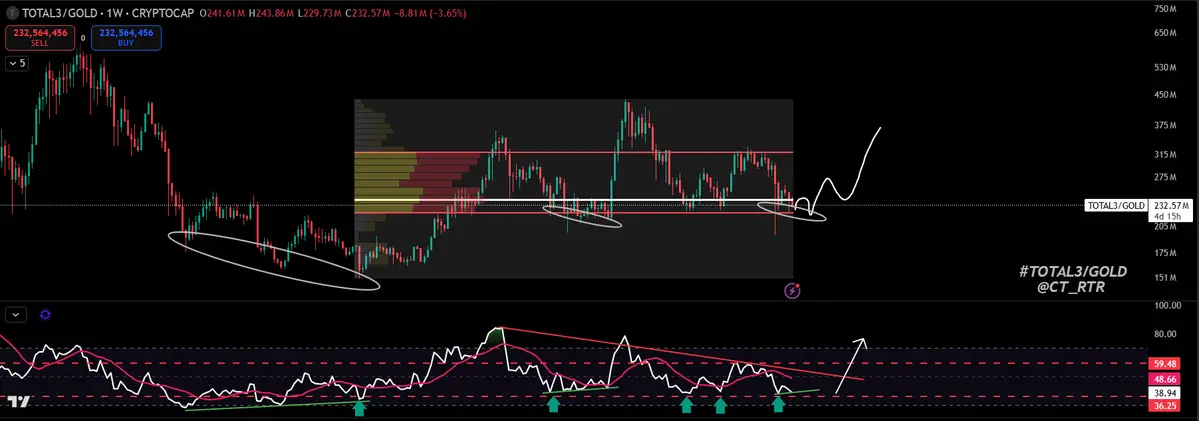
#TOTAL3/GOLD
Chart illustrates altcoins performance in relation to gold.
Now hovering between Value Area Low and Point of Control. Before the recent expansions, this area was used as accumulation zone.
Also near the 36RSI level, this is bear-trap RSI, my favorite bull-ignition level.
Would like to see some bullish divergences formed near here to build more confidence.
Notes:
1) Should the ratio break above the VAH - raging bull.
2) Ratio breaks below VAL - 25% correction.
- Reward
- like
- Comment
- Repost
- Share
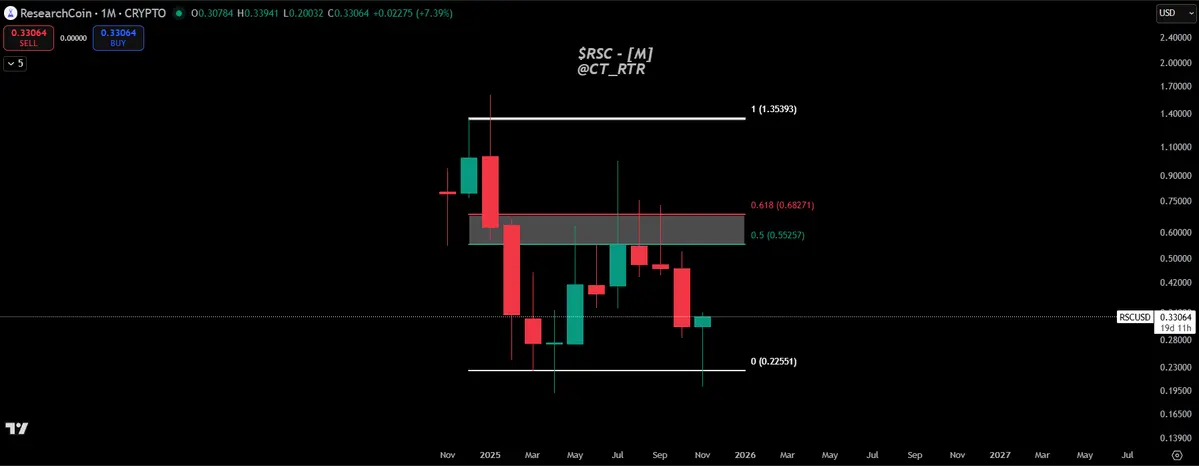
$RSC - [M]
Very good looking monthly chart.
Double bottom with hammer monthly candle at Range Lows?
Even if asset gets sort of pullback, still translates into a dragonfly doji.
Next monthly candle high possibility to be big green, followed by expansion over Fibs box.
Brian's Armstrong (Coinbase CEO) is the co-founder of this coin - doubt this don't get the chance to run before bear market.
RSC-3.6%
- Reward
- like
- Comment
- Repost
- Share
- Reward
- like
- Comment
- Repost
- Share
- Reward
- like
- Comment
- Repost
- Share
- Reward
- like
- Comment
- Repost
- Share
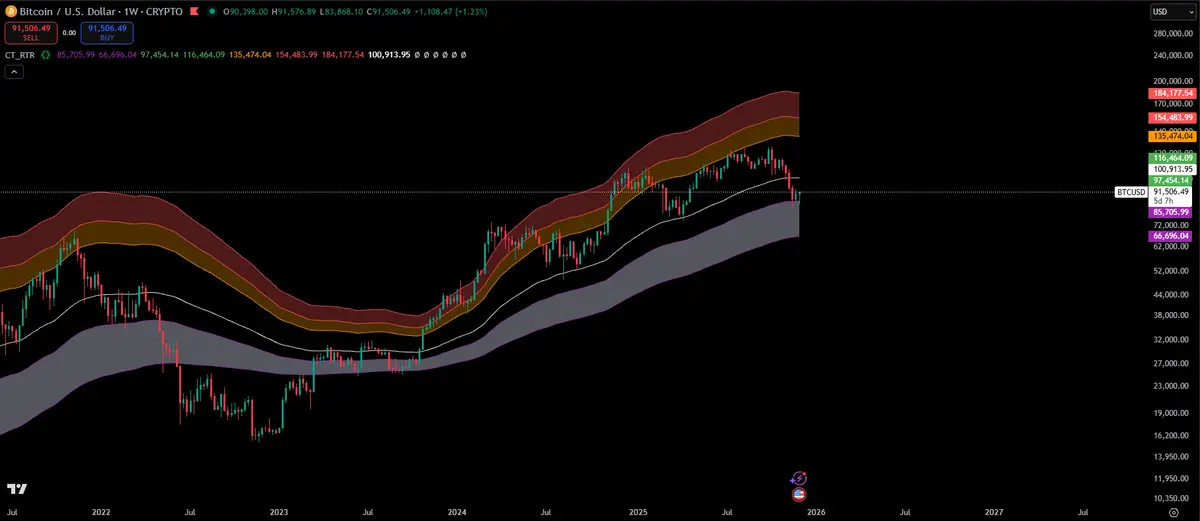
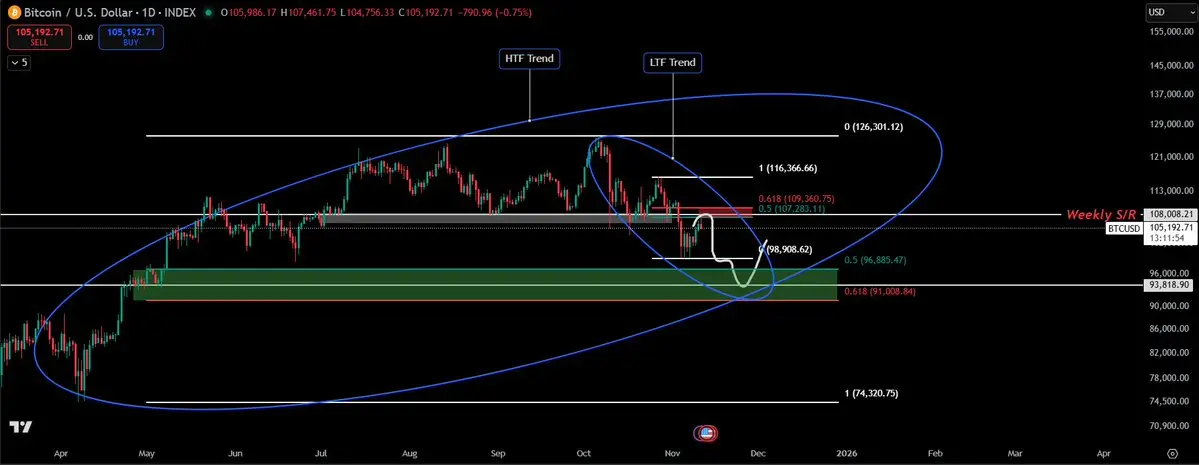
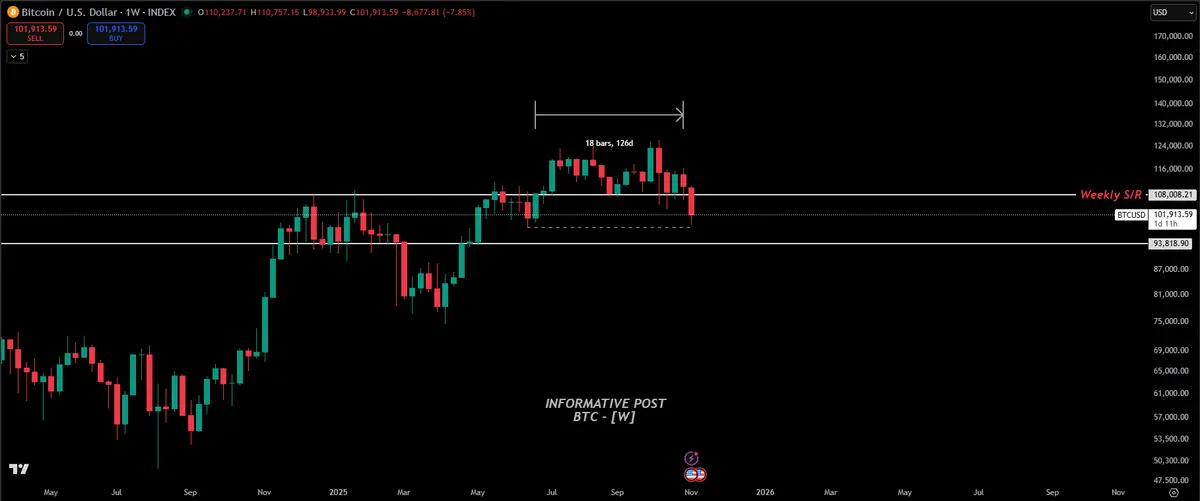
$BTC - [D]
This is some warning post you need to be aware of.
The situation is not clear yet, that's why I labelled it as informative.
The weekly candle has not closed yet, hence the reasonings above.
But if it closes like this, ain't a really good sign after 3 months spent bouncing from the support - price finds acceptance back below the weekly S/R, case it happens. (i.e. lower prices expected)
We'll update with a 100% clear answer upon weekly close.
BTC-2.89%
- Reward
- like
- Comment
- Repost
- Share
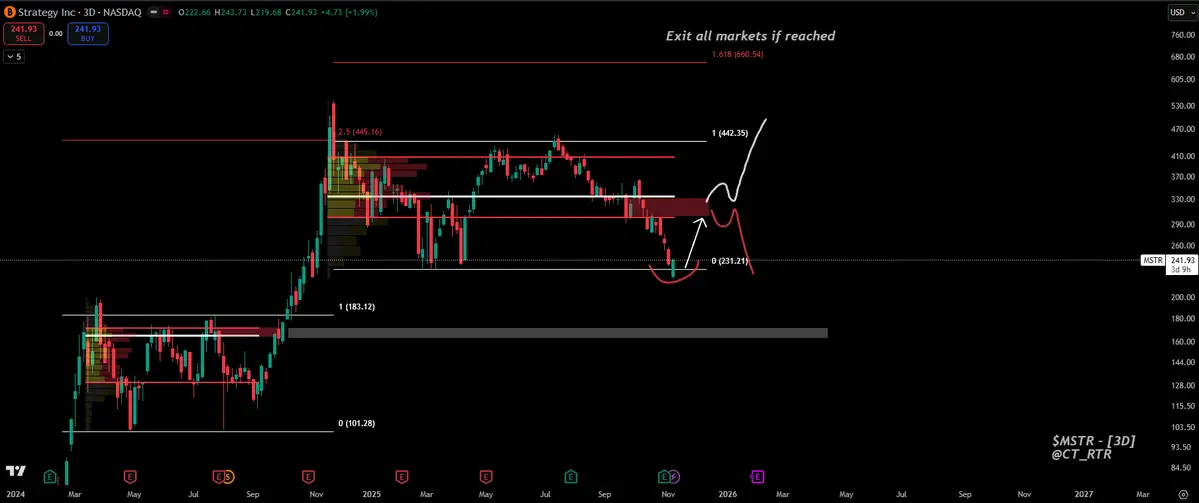
$MSTR - [3D]
Easy 30% gain here into Point - of - Control, where supply aligns, similarly with the previous range.
Should that point be reached, there comes the question whether that area gets flipped into support or is rejected.
Case it gets flipped, we can talk higher numbers, possible new highs, equivalent with Bitcoin pushing much, much higher.
Other than that, treat the range until proven otherwise.
BTC-2.89%
- Reward
- like
- Comment
- Repost
- Share
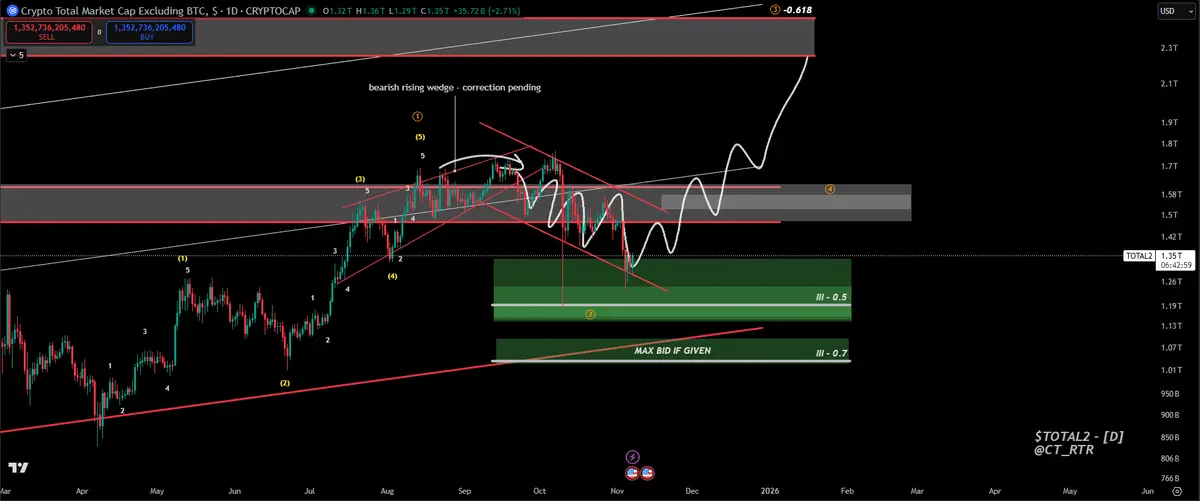
#TOTAL2 - [D]
Elliot-wave analysis for studying purposes.
Clear 5-wave impulsive move from the channel lower boundary.
At the moment, within second wave correction.
What is the next? - the third and the most impulsive leg of the whole count.
Elliot-wave analysis for studying purposes.
Clear 5-wave impulsive move from the channel lower boundary.
At the moment, within second wave correction.
What is the next? - the third and the most impulsive leg of the whole count.
- Reward
- like
- Comment
- Repost
- Share
- Reward
- like
- Comment
- Repost
- Share