


$BTC
🔷️The Calm Before the Storm? Decoding Bitcoin’s Consolidation at $66,375
#CreatorLeaderboard
In the fast-paced world of cryptocurrency, the landscape can change in the blink of an eye. Yet, as we analyze the current state of the BTC/USDT pair, we are witnessing a moment of intense equilibrium.
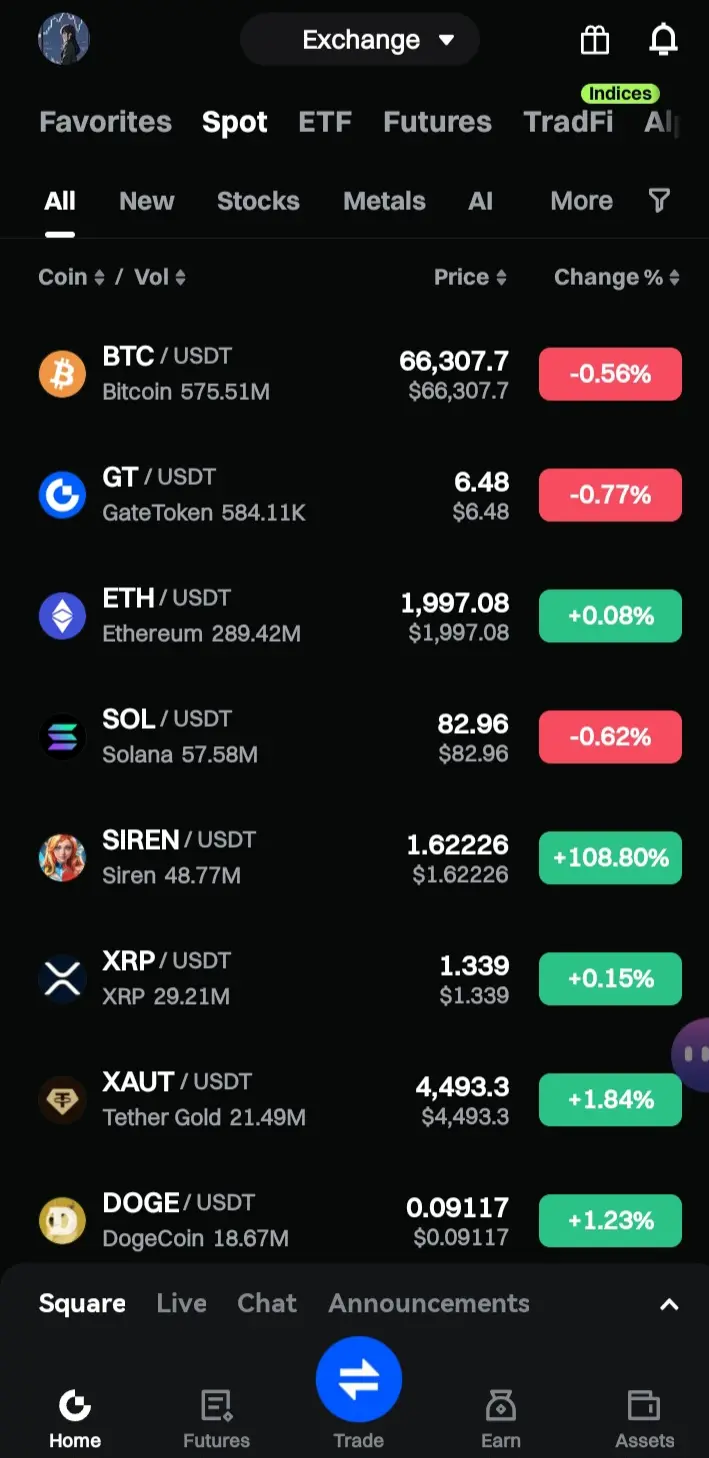
At a current price of $66,375.9, Bitcoin is down 3.38% over the last 24 hours, but to dismiss this as mere bearish momentum would be to miss the deeper technical narrative unfolding beneath the surface.
Bitcoin finds itself at a critical technical juncture. After a rejection from the local highs of $68,953, the market has retreated to consolidate. However, this is not a capitulation; it is a coiling of the spring.
🔹️The Technical Picture: Divergence in the Details
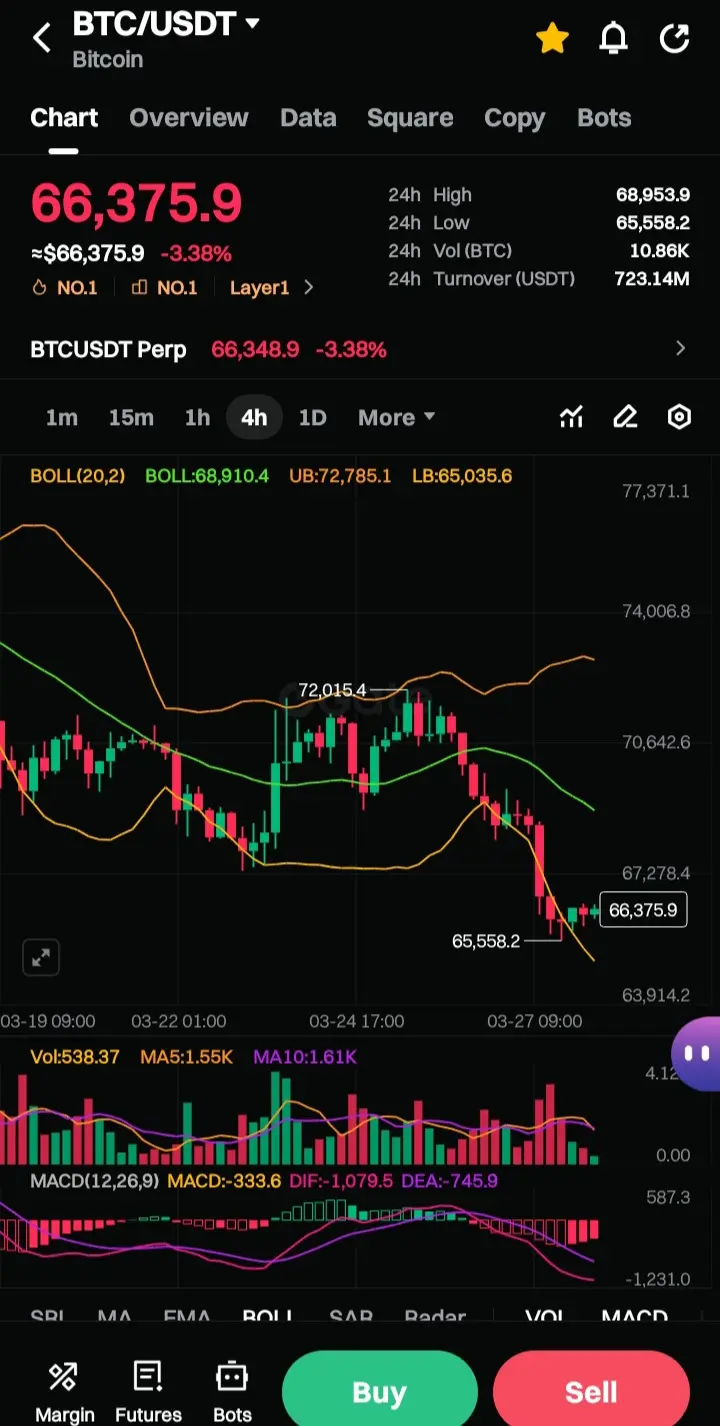
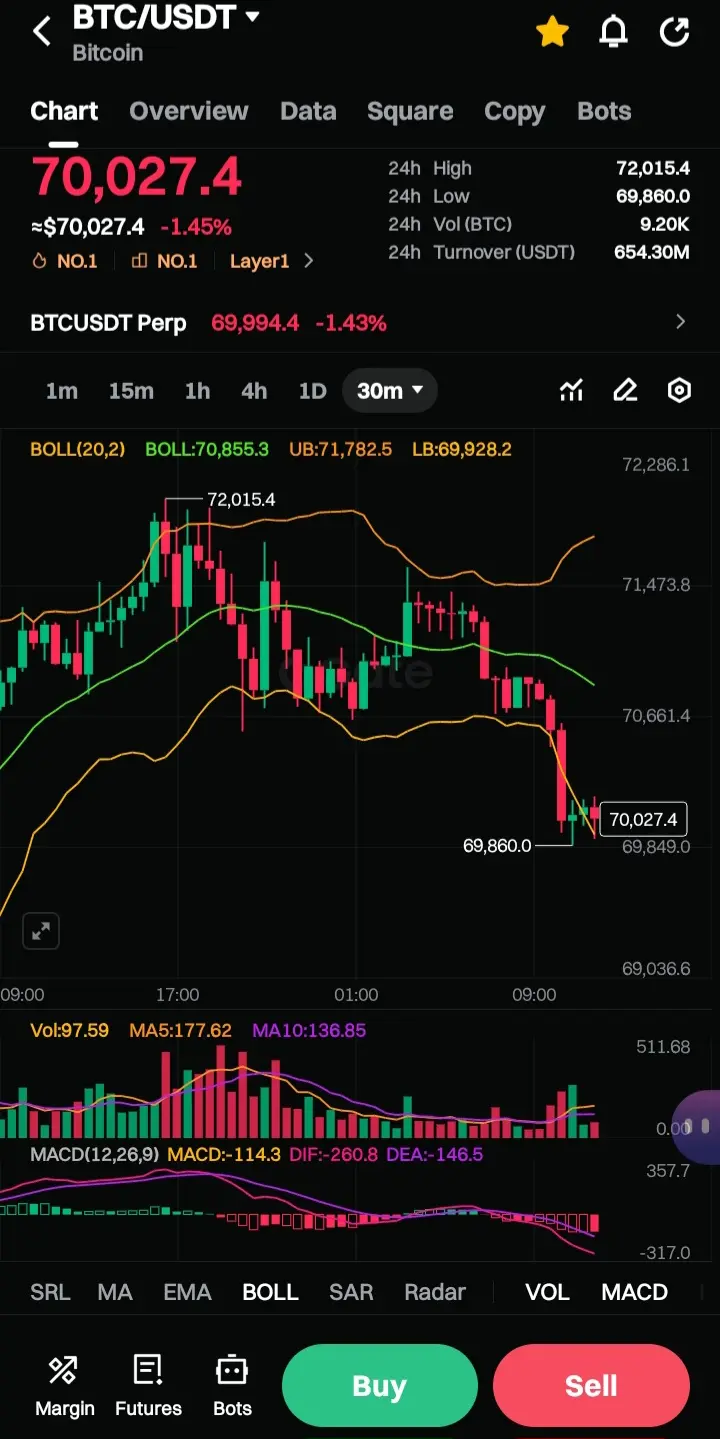
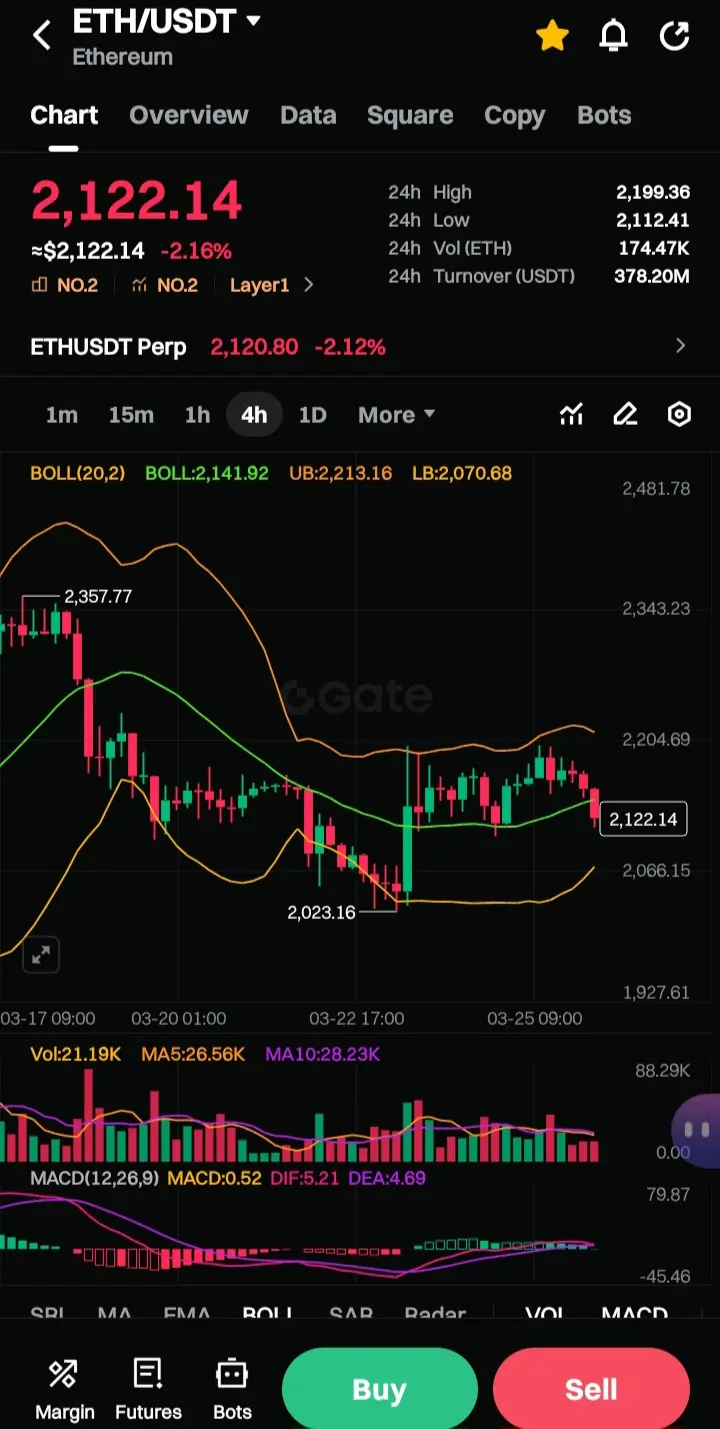
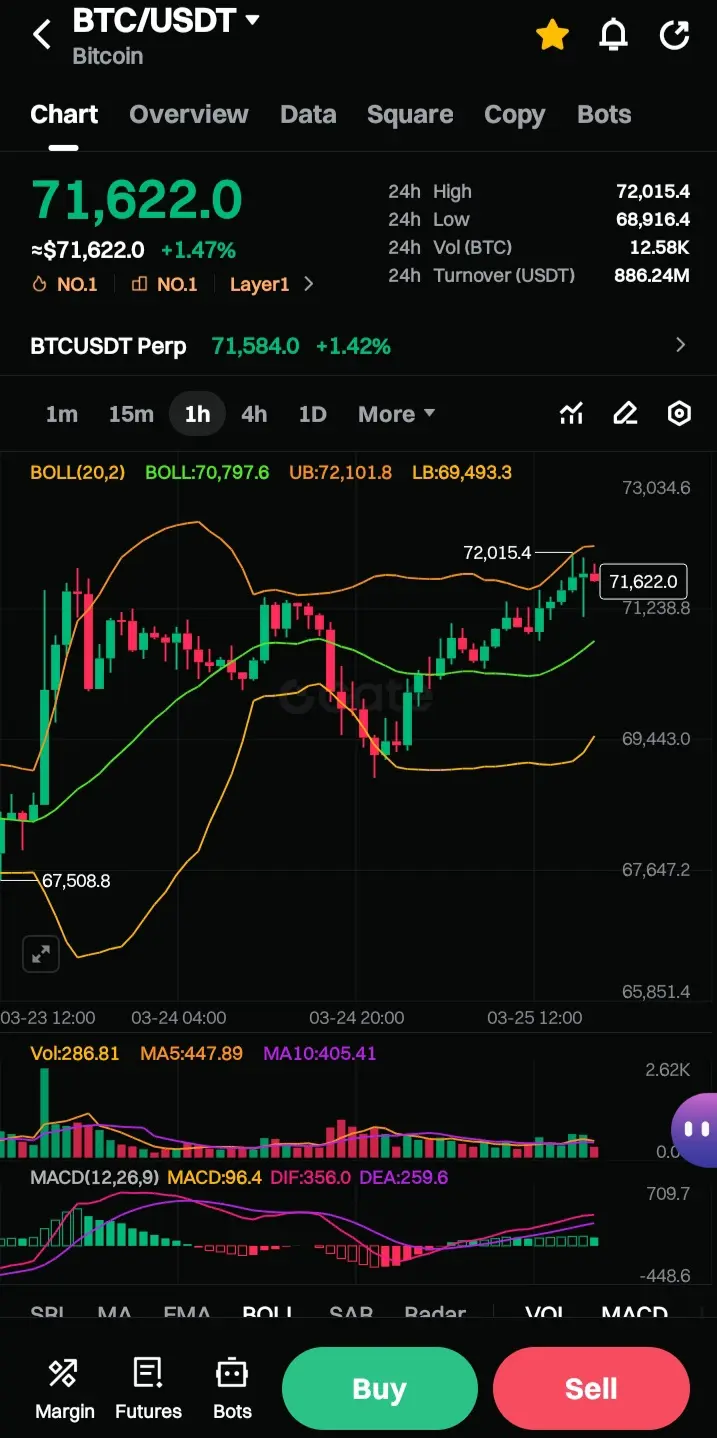
The three distinct timeframes provided tell a story of compression. On the higher timeframe (the 4-day view), we see the Bollinger Bands (20,2) stretched with an upper band at $72,785 and a lower band at $65,035. This wide range indicates the massive volatility that preceded this moment.
Yet, as we zoom into the hourly and 📍10-second charts, we see the true nature of the current market: compression.
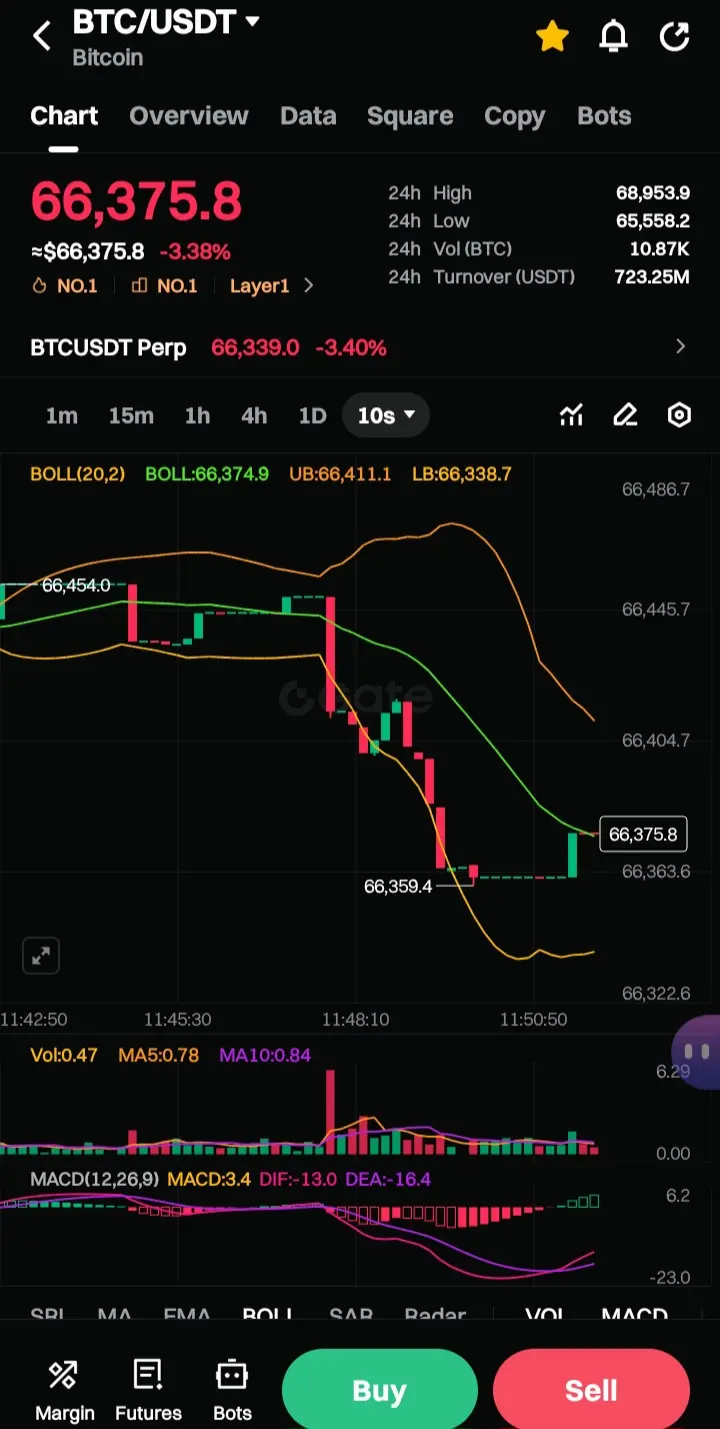
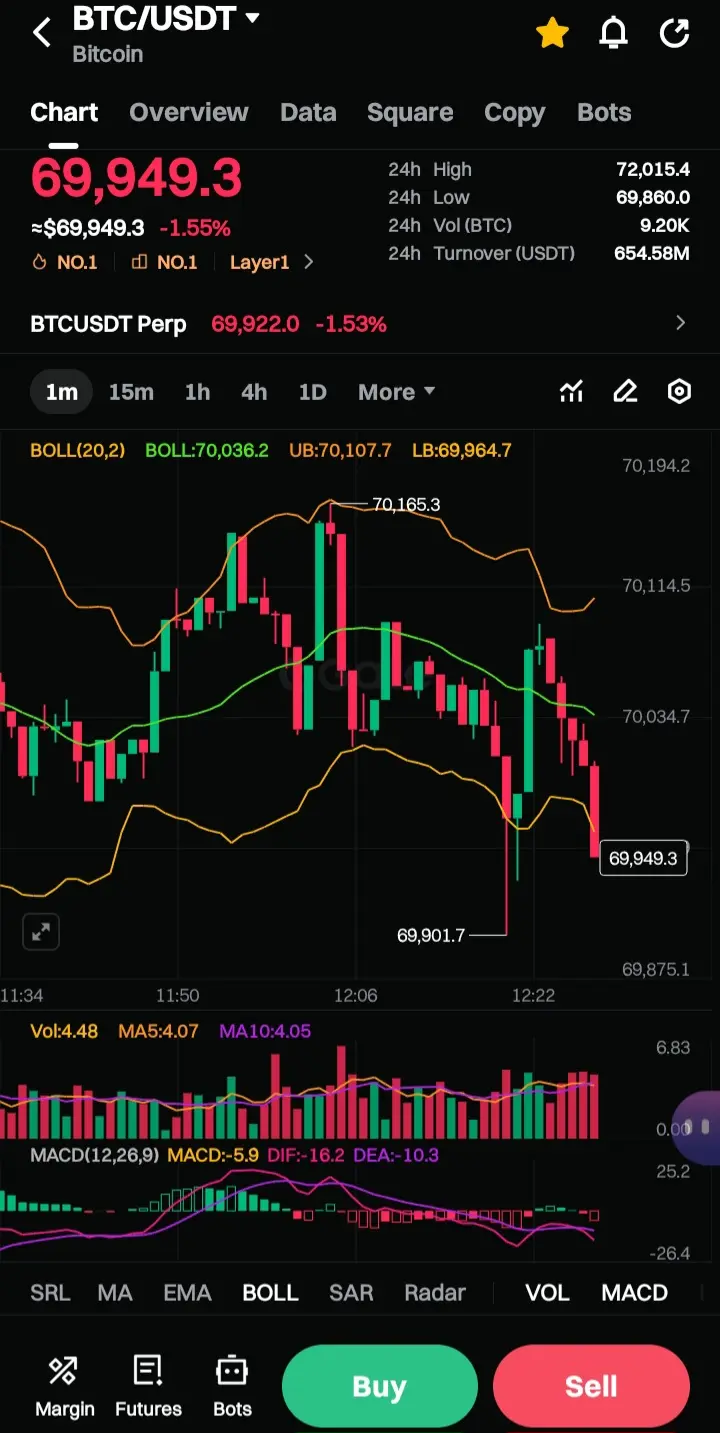
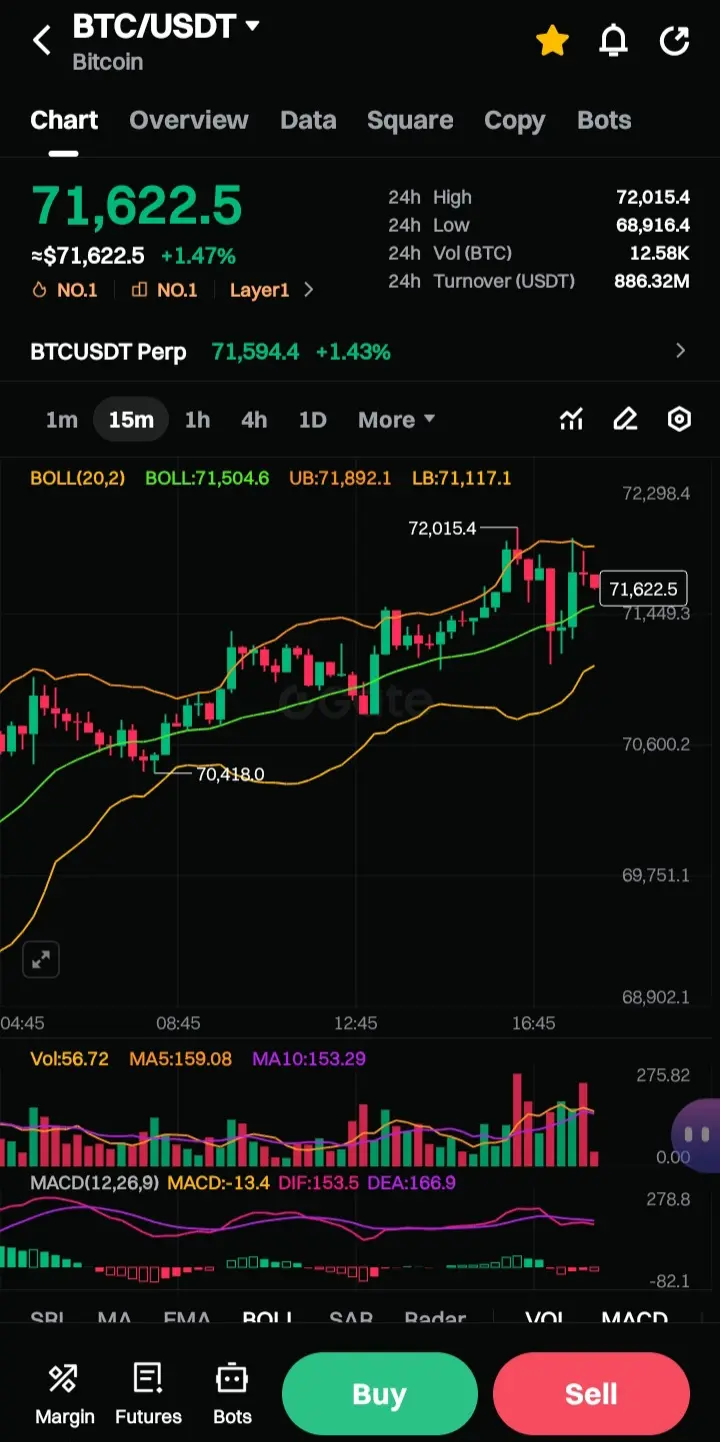
Looking at the most recent 📍10-second chart the Bollinger Bands are nearly touching. The Upper Bollinger Band (UB) sits at $66,411 while the Lower Bollinger Band (LB) sits at $66,338. This incredibly tight squeeze on the 10-second timeframe is often the precursor to an explosive move.
The price is hovering exactly at the middle band ($66,374), signaling a perfect balance between buyers and sellers.
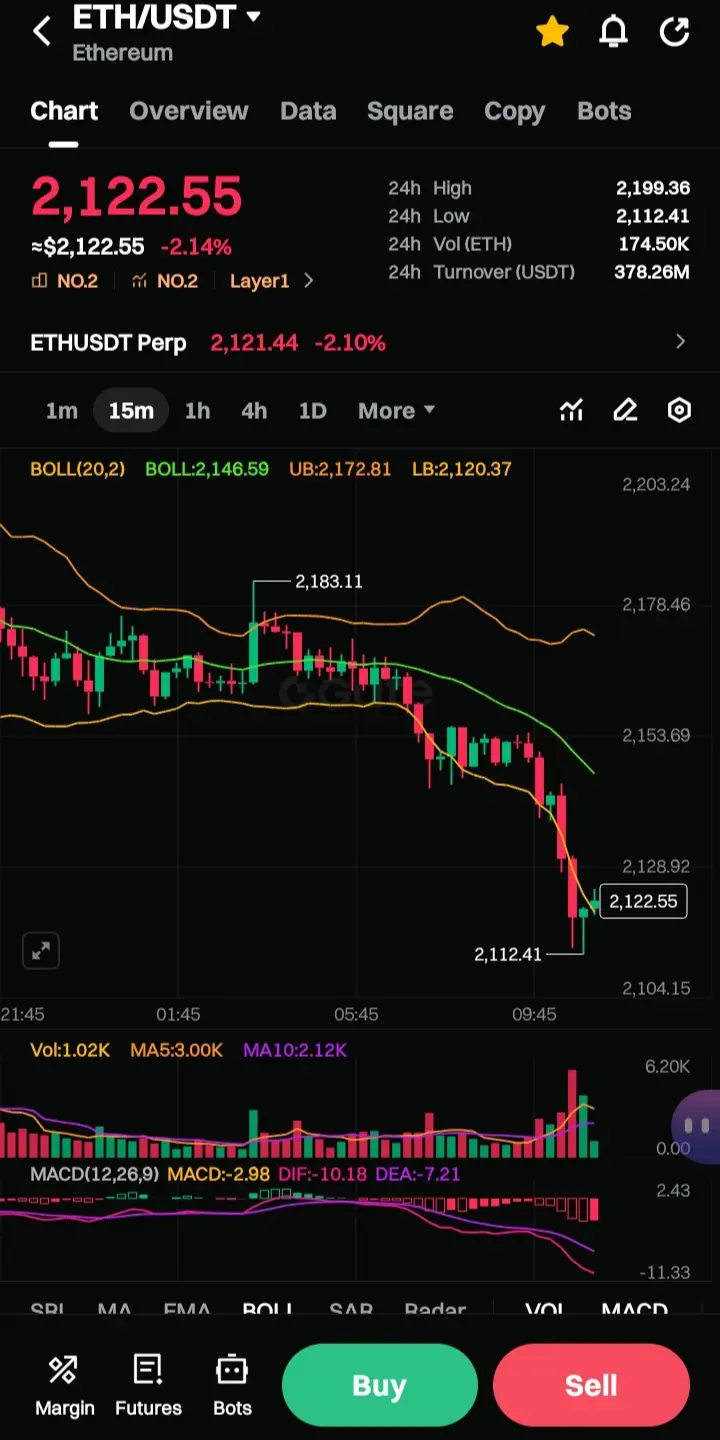
This equilibrium is further supported by the Moving Average Convergence Divergence (MACD) on the shorter timeframe. While the 4-hour MACD shows deep negative momentum (DIF: -1,079), suggesting we are coming out of a significant downturn, the latest📍 10-second data shows the MACD line has flipped positive (3.4) against a diverging signal line.
This micro-structure suggests that the selling pressure that dominated the move from $68,000 is exhausting itself.
Volume Analysis: The Quiet Accumulation
Perhaps the most telling indicator is the volume. Across the board, we see declining volume levels. The 24-hour turnover hovers around $723 million, but the high-frequency data tells a story of drying up liquidity. On the 📍10-second chart, the Volume is currently 0.47, sitting well below the MA5 of 0.78 and MA10 of 0.84.
🔹️In technical analysis, a price consolidation accompanied by decreasing volume typically indicates a lack of strong directional conviction. It suggests that the aggressive sellers from the recent dip have been absorbed, and the aggressive buyers are waiting for a catalyst. We are witnessing a market in "waiting mode."
🔹️The Battle Lines are Drawn
For traders, the current levels define the battlefield. The immediate resistance zone is the $66,450 to $66,500 area. A breakout above this level, particularly if accompanied by a spike in volume, could signal a retest of the $68,900 highs.
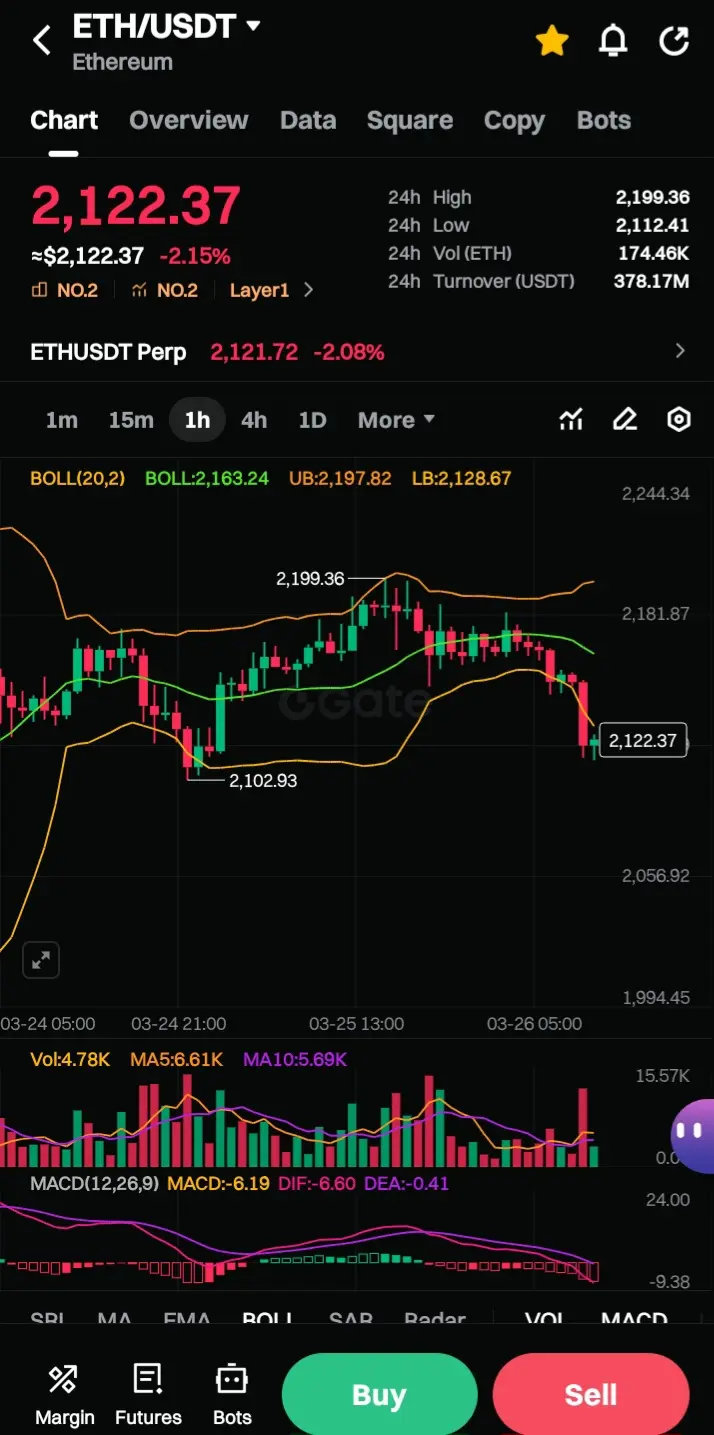
Conversely, the support zone is currently defined by the lower Bollinger Band on the hourly chart at $65,694 and the recent 24-hour low of $65,558. A breach below this level could open the door to a retest of the $63,900 range seen in previous sessions.
🔹️Conclusion: Patience Yields Profit
The current state of Bitcoin is a testament to the maturity of the asset class. We are no longer seeing the wild, uncontrolled swings of the past without technical structure. Instead, we are observing a well-defined consolidation pattern.
The Bollinger Band squeeze on the lower timeframes is a powerful signal: volatility is on the horizon. Whether Bitcoin breaks upwards to reclaim $68,000 or tests the lower supports, the high-probability trade lies in waiting for the breakout of this narrow range.
For investors, this period of sideways movement is not boredom—it is opportunity. It is the quiet accumulation before the next significant trend is established. Keep your eyes on the volume, watch the Band squeeze, and prepare for the breakout. The calmest waters often precede the strongest tides.
🔸️Disclaimer: This article is for informational purposes only and does not constitute financial advice. Always conduct your own research before making any investment.
🔷️The Calm Before the Storm? Decoding Bitcoin’s Consolidation at $66,375
#CreatorLeaderboard
In the fast-paced world of cryptocurrency, the landscape can change in the blink of an eye. Yet, as we analyze the current state of the BTC/USDT pair, we are witnessing a moment of intense equilibrium.
At a current price of $66,375.9, Bitcoin is down 3.38% over the last 24 hours, but to dismiss this as mere bearish momentum would be to miss the deeper technical narrative unfolding beneath the surface.
Bitcoin finds itself at a critical technical juncture. After a rejection from the local highs of $68,953, the market has retreated to consolidate. However, this is not a capitulation; it is a coiling of the spring.
🔹️The Technical Picture: Divergence in the Details
The three distinct timeframes provided tell a story of compression. On the higher timeframe (the 4-day view), we see the Bollinger Bands (20,2) stretched with an upper band at $72,785 and a lower band at $65,035. This wide range indicates the massive volatility that preceded this moment.
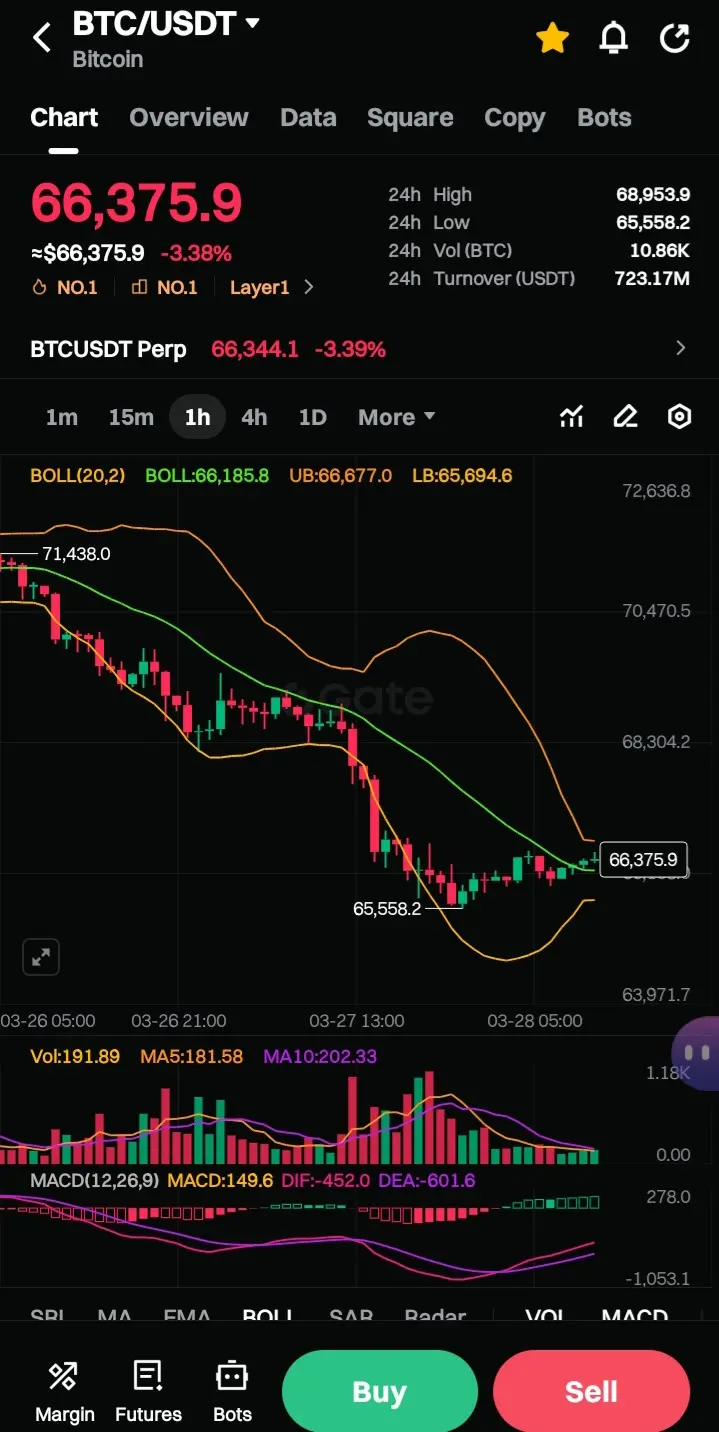
Yet, as we zoom into the hourly and 📍10-second charts, we see the true nature of the current market: compression.
Looking at the most recent 📍10-second chart the Bollinger Bands are nearly touching. The Upper Bollinger Band (UB) sits at $66,411 while the Lower Bollinger Band (LB) sits at $66,338. This incredibly tight squeeze on the 10-second timeframe is often the precursor to an explosive move.
The price is hovering exactly at the middle band ($66,374), signaling a perfect balance between buyers and sellers.
This equilibrium is further supported by the Moving Average Convergence Divergence (MACD) on the shorter timeframe. While the 4-hour MACD shows deep negative momentum (DIF: -1,079), suggesting we are coming out of a significant downturn, the latest📍 10-second data shows the MACD line has flipped positive (3.4) against a diverging signal line.
This micro-structure suggests that the selling pressure that dominated the move from $68,000 is exhausting itself.
Volume Analysis: The Quiet Accumulation
Perhaps the most telling indicator is the volume. Across the board, we see declining volume levels. The 24-hour turnover hovers around $723 million, but the high-frequency data tells a story of drying up liquidity. On the 📍10-second chart, the Volume is currently 0.47, sitting well below the MA5 of 0.78 and MA10 of 0.84.
🔹️In technical analysis, a price consolidation accompanied by decreasing volume typically indicates a lack of strong directional conviction. It suggests that the aggressive sellers from the recent dip have been absorbed, and the aggressive buyers are waiting for a catalyst. We are witnessing a market in "waiting mode."
🔹️The Battle Lines are Drawn
For traders, the current levels define the battlefield. The immediate resistance zone is the $66,450 to $66,500 area. A breakout above this level, particularly if accompanied by a spike in volume, could signal a retest of the $68,900 highs.
Conversely, the support zone is currently defined by the lower Bollinger Band on the hourly chart at $65,694 and the recent 24-hour low of $65,558. A breach below this level could open the door to a retest of the $63,900 range seen in previous sessions.
🔹️Conclusion: Patience Yields Profit
The current state of Bitcoin is a testament to the maturity of the asset class. We are no longer seeing the wild, uncontrolled swings of the past without technical structure. Instead, we are observing a well-defined consolidation pattern.
The Bollinger Band squeeze on the lower timeframes is a powerful signal: volatility is on the horizon. Whether Bitcoin breaks upwards to reclaim $68,000 or tests the lower supports, the high-probability trade lies in waiting for the breakout of this narrow range.
For investors, this period of sideways movement is not boredom—it is opportunity. It is the quiet accumulation before the next significant trend is established. Keep your eyes on the volume, watch the Band squeeze, and prepare for the breakout. The calmest waters often precede the strongest tides.
🔸️Disclaimer: This article is for informational purposes only and does not constitute financial advice. Always conduct your own research before making any investment.