- Ultra-liquid asset price forecasts: Ultra-liquid asset prices rise with increased perpetual trading of risk-weighted assets, crude oil volume exceeds one billion dollars:
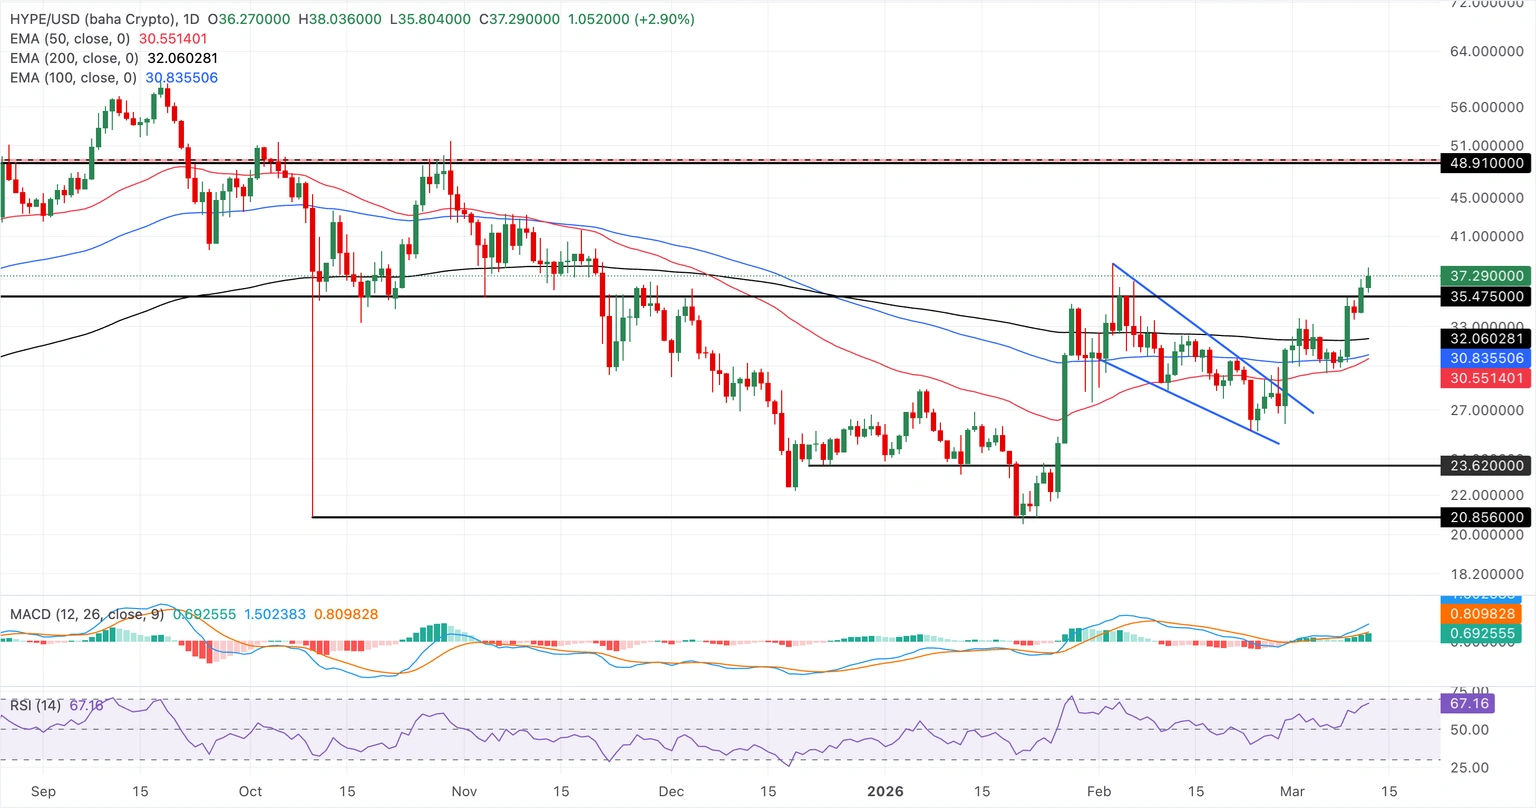
Hyperliquid ((HYPE)), a decentralized trading platform, saw its price increase by 3% at the time of writing this report on Thursday, continuing its 6% recovery from the previous day, achieving weekly gains of approximately 20% so far. This platform, specialized in perpetual futures, experienced increased demand for real asset perpetual contracts, raising open trading volume to 1.3 billion dollars.
The high-liquidity trading market may continue its upward trend with increased demand for an institutional trading platform operating 24/7 amid escalating Middle East tensions affecting oil prices.
- Adopting high liquidity leads to increased oil price volatility:
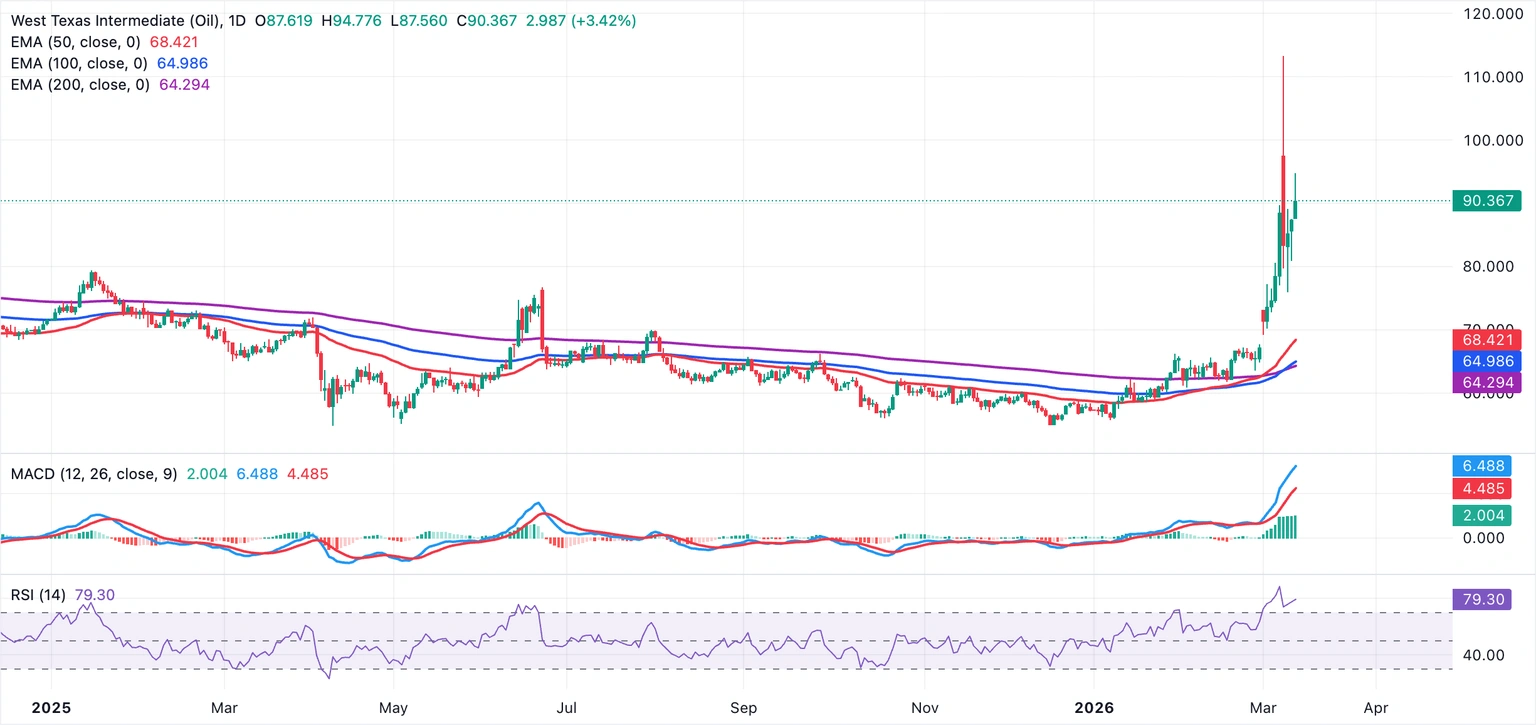
Despite the International Energy Agency's attempts to cool rising oil prices, the Middle East conflict is fueling upward pressures as a result of restricted oil supplies from the Strait of Hormuz. The increasing demand for highly volatile crude oil price trading has driven both individual and institutional traders toward Hyperliquid, a 24/7 decentralized trading platform.
Hyperliquid expanded to include RWA perpetual futures through the Hyperliquid-3 ((HIP)) improvement proposal, which allows users to deploy perpetual contracts by depositing one million HYPE tokens.
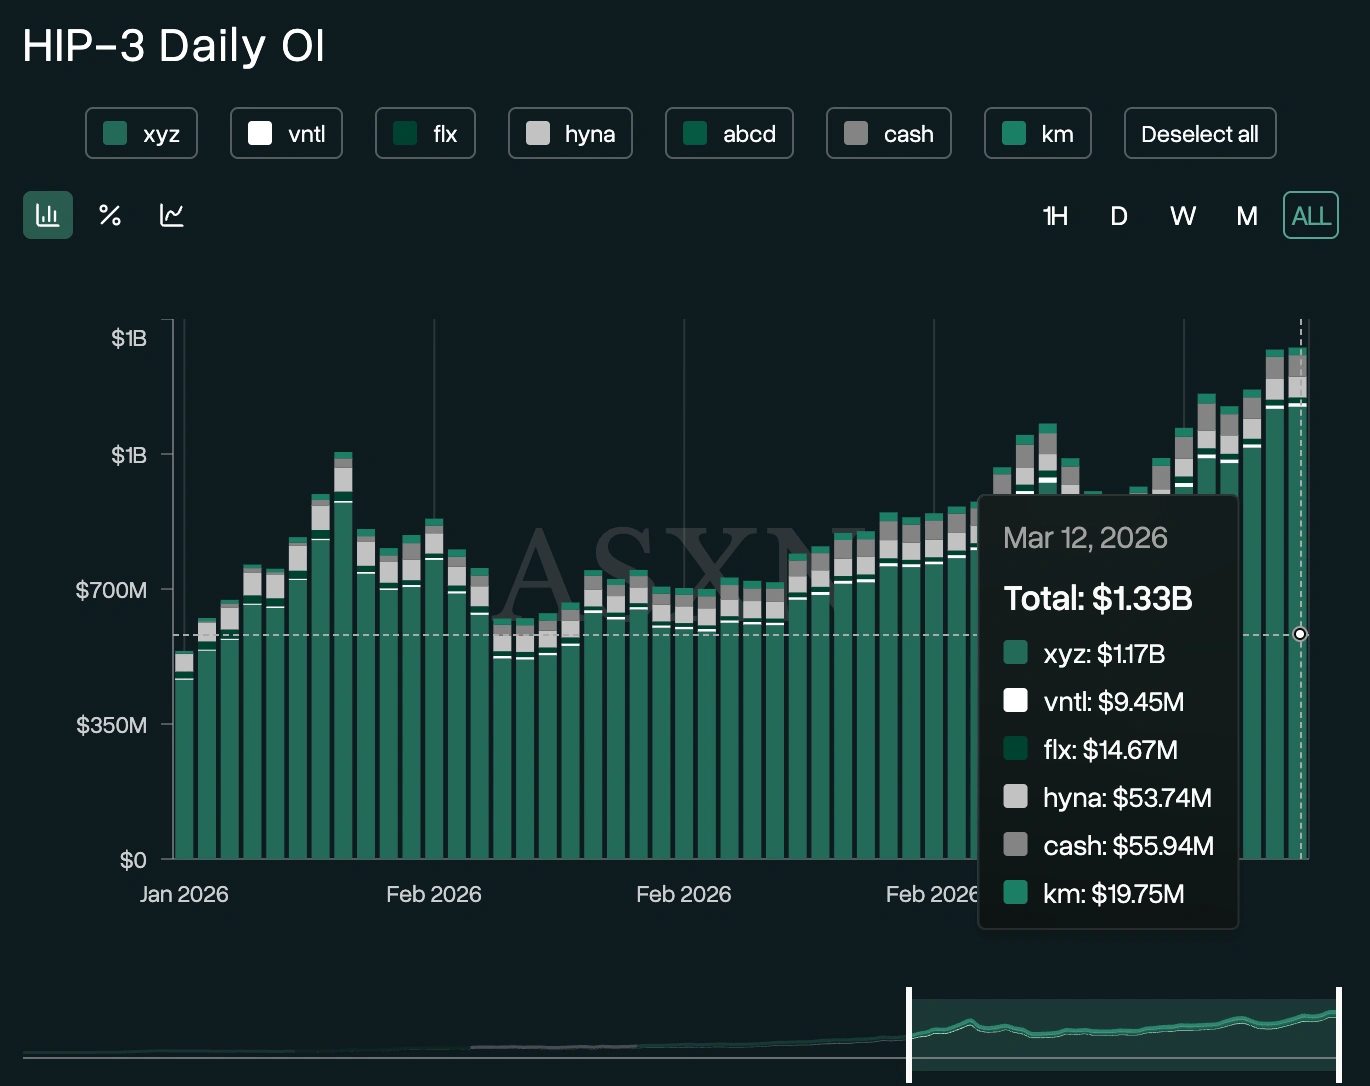
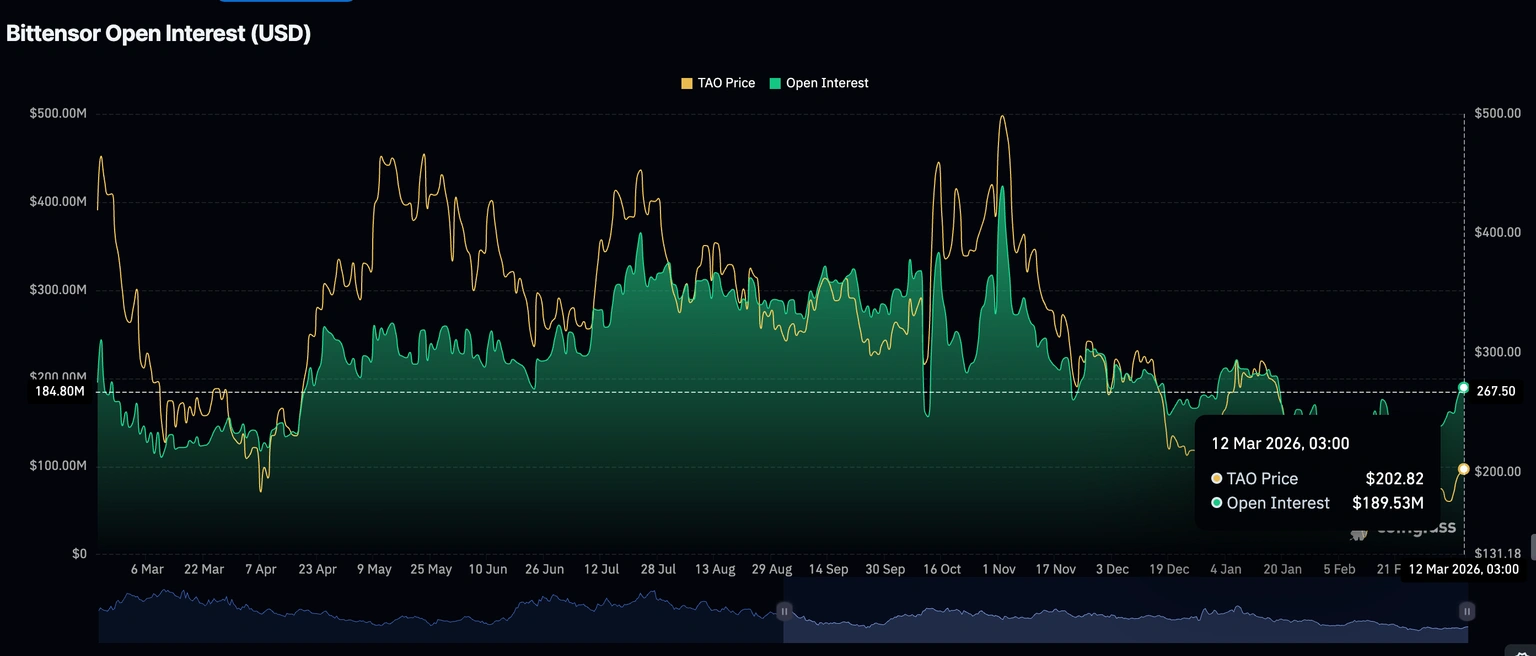
The open interest ((OI)) volume for the HIP-3 index, which indicates the notional value of existing contracts, particularly for risk-weighted assets ((RWA)), reached a record level of 1.33 billion dollars on Thursday. The sharp increases in HIP-3 open interest volume during weekends confirm that demand is shifting toward high-liquidity trading ((Hyperliquid)) when traditional markets are closed.
Daily open interest data for HIP-3 index. Source: Hyperscreener
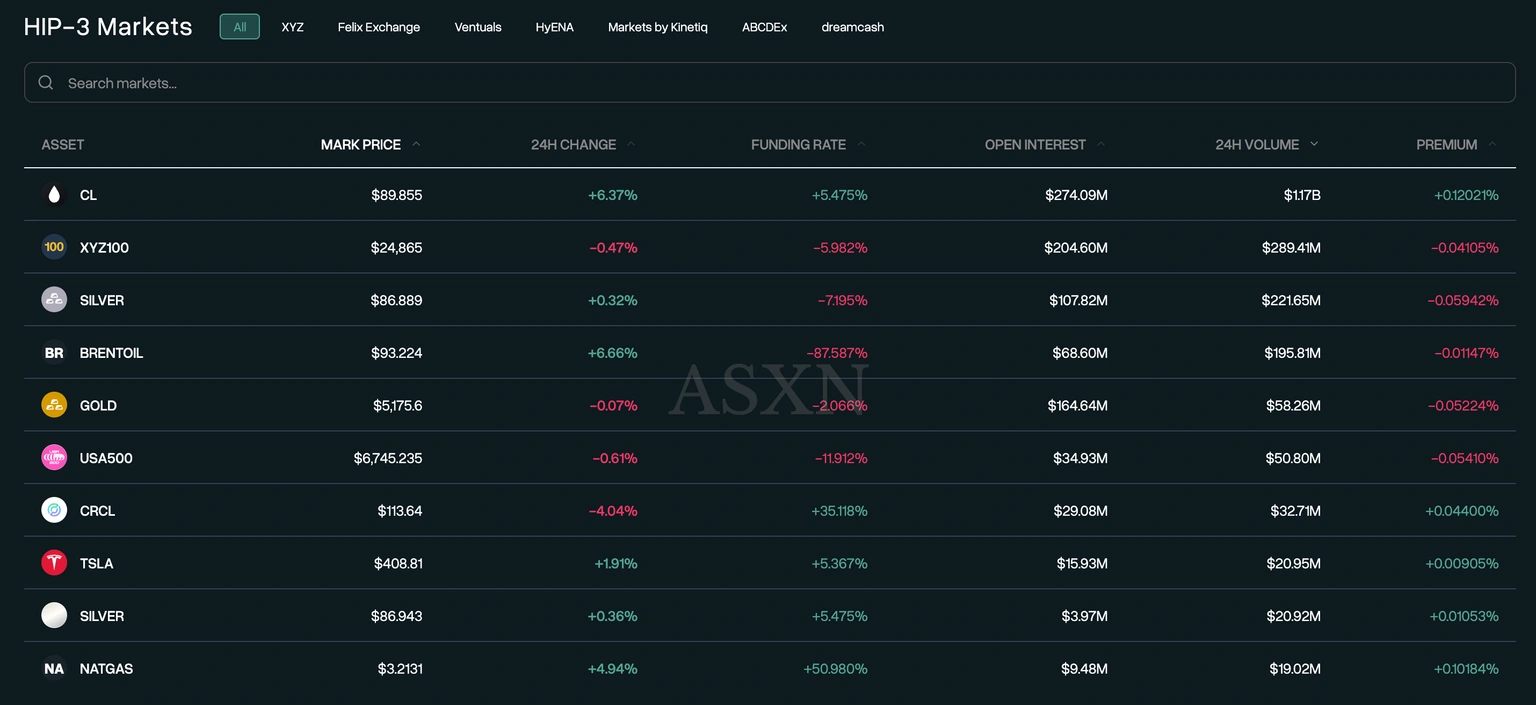
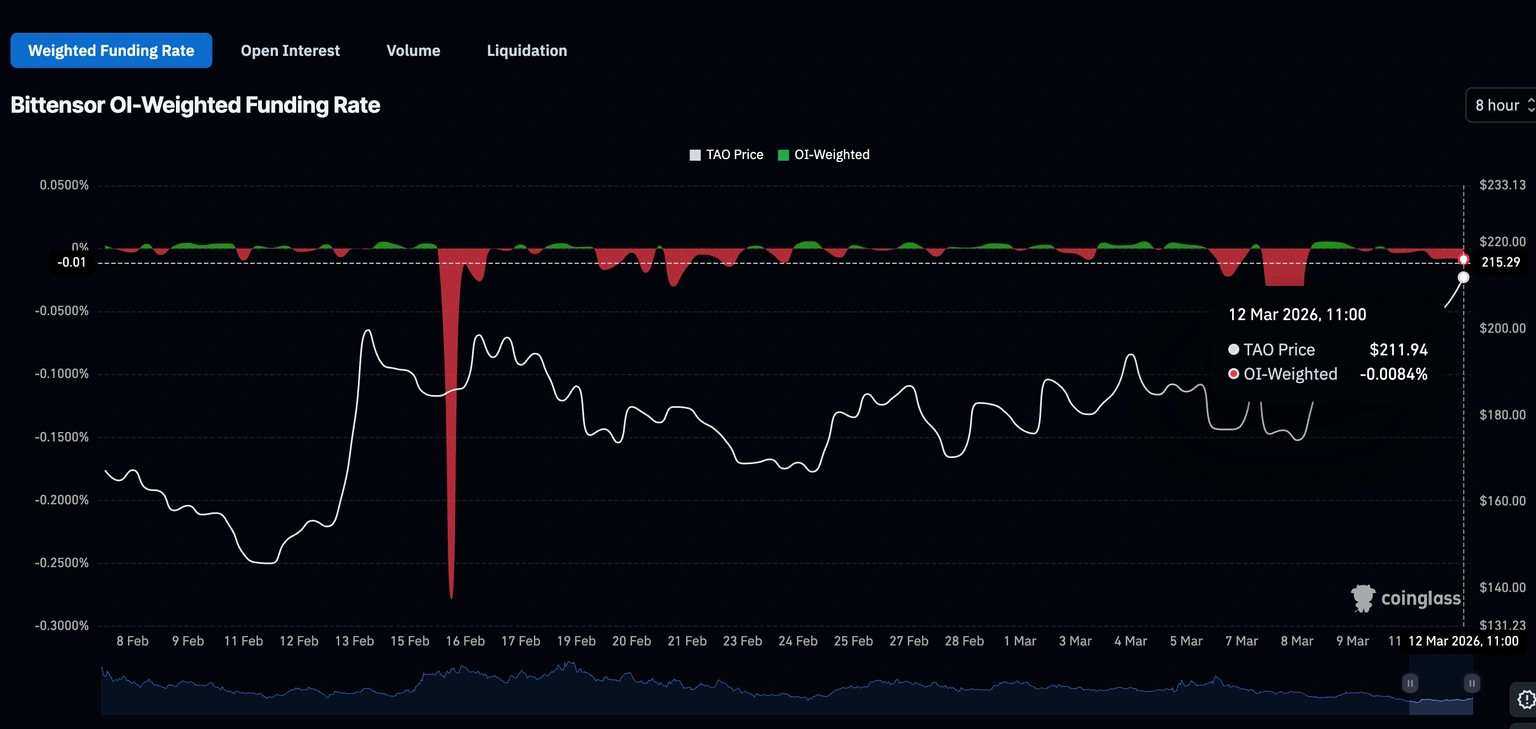
Additionally, the significant surge in 24-hour crude oil trading volume to 1.17 billion dollars on the decentralized trading platform confirms that demand is primarily driven by oil.
HIP-3 market data. Source: Hyperscreener
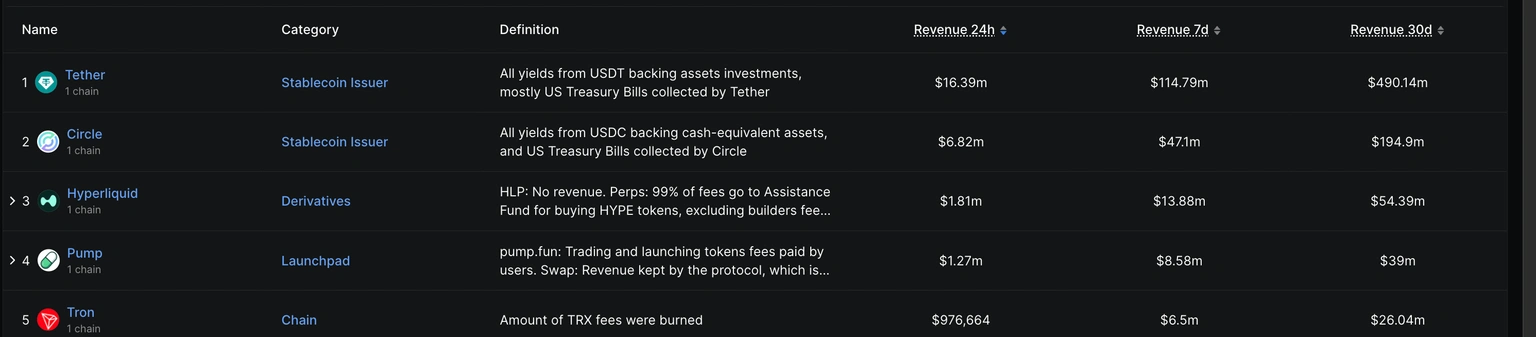
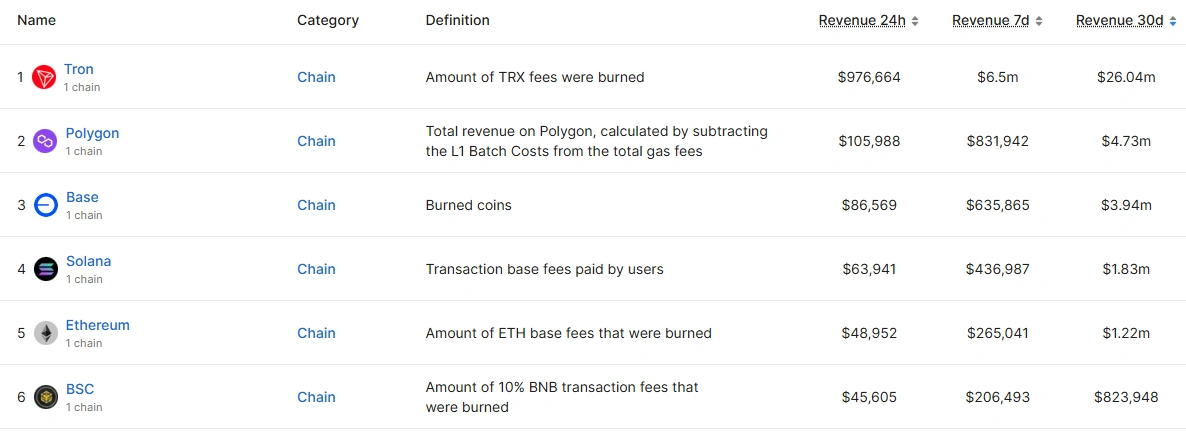
In line with increasing demand, the Hyperliquid protocol remains the leading protocol by revenue, aside from stablecoins, generating 54.39 million dollars over the past thirty days, surpassing Pump.fun and the Tron ecosystem.
Hyperliquid ((HYPE)), a decentralized trading platform, saw its price increase by 3% at the time of writing this report on Thursday, continuing its 6% recovery from the previous day, achieving weekly gains of approximately 20% so far. This platform, specialized in perpetual futures, experienced increased demand for real asset perpetual contracts, raising open trading volume to 1.3 billion dollars.
The high-liquidity trading market may continue its upward trend with increased demand for an institutional trading platform operating 24/7 amid escalating Middle East tensions affecting oil prices.
- Adopting high liquidity leads to increased oil price volatility:
Despite the International Energy Agency's attempts to cool rising oil prices, the Middle East conflict is fueling upward pressures as a result of restricted oil supplies from the Strait of Hormuz. The increasing demand for highly volatile crude oil price trading has driven both individual and institutional traders toward Hyperliquid, a 24/7 decentralized trading platform.
Hyperliquid expanded to include RWA perpetual futures through the Hyperliquid-3 ((HIP)) improvement proposal, which allows users to deploy perpetual contracts by depositing one million HYPE tokens.
The open interest ((OI)) volume for the HIP-3 index, which indicates the notional value of existing contracts, particularly for risk-weighted assets ((RWA)), reached a record level of 1.33 billion dollars on Thursday. The sharp increases in HIP-3 open interest volume during weekends confirm that demand is shifting toward high-liquidity trading ((Hyperliquid)) when traditional markets are closed.
Daily open interest data for HIP-3 index. Source: Hyperscreener
Additionally, the significant surge in 24-hour crude oil trading volume to 1.17 billion dollars on the decentralized trading platform confirms that demand is primarily driven by oil.
HIP-3 market data. Source: Hyperscreener
In line with increasing demand, the Hyperliquid protocol remains the leading protocol by revenue, aside from stablecoins, generating 54.39 million dollars over the past thirty days, surpassing Pump.fun and the Tron ecosystem.