Trade
Trading Type
Spot
Trade crypto freely
Alpha
Points
Get promising tokens in streamlined on-chain trading
Pre-Market
Trade new tokens before they are officially listed
Margin
Magnify your profit with leverage
Convert & Block Trading
0 Fees
Trade any size with no fees and no slippage
Leveraged Tokens
Get exposure to leveraged positions simply
Futures
Futures
Hundreds of contracts settled in USDT or BTC
Options
HOT
Trade European-style vanilla options
Unified Account
Maximize your capital efficiency
Demo Trading
Futures Kickoff
Get prepared for your futures trading
Futures Events
Participate in events to win generous rewards
Demo Trading
Use virtual funds to experience risk-free trading
Earn
Launch
CandyDrop
Collect candies to earn airdrops
Launchpool
Quick staking, earn potential new tokens
HODLer Airdrop
Hold GT and get massive airdrops for free
Launchpad
Be early to the next big token project
Alpha Points
NEW
Trade on-chain assets and enjoy airdrop rewards!
Futures Points
NEW
Earn futures points and claim airdrop rewards
Investment
Simple Earn
Earn interests with idle tokens
Auto-Invest
Auto-invest on a regular basis
Dual Investment
Buy low and sell high to take profits from price fluctuations
Soft Staking
Earn rewards with flexible staking
Crypto Loan
0 Fees
Pledge one crypto to borrow another
Lending Center
One-stop lending hub
VIP Wealth Hub
Customized wealth management empowers your assets growth
Private Wealth Management
Customized asset management to grow your digital assets
Quant Fund
Top asset management team helps you profit without hassle
Staking
Stake cryptos to earn in PoS products
BTC Staking
HOT
Stake BTC and earn 10% APR
GUSD Minting
Use USDT/USDC to mint GUSD for treasury-level yields
More
AAChenHaoyu
No content yet
AAChenHaoyu
 0
0
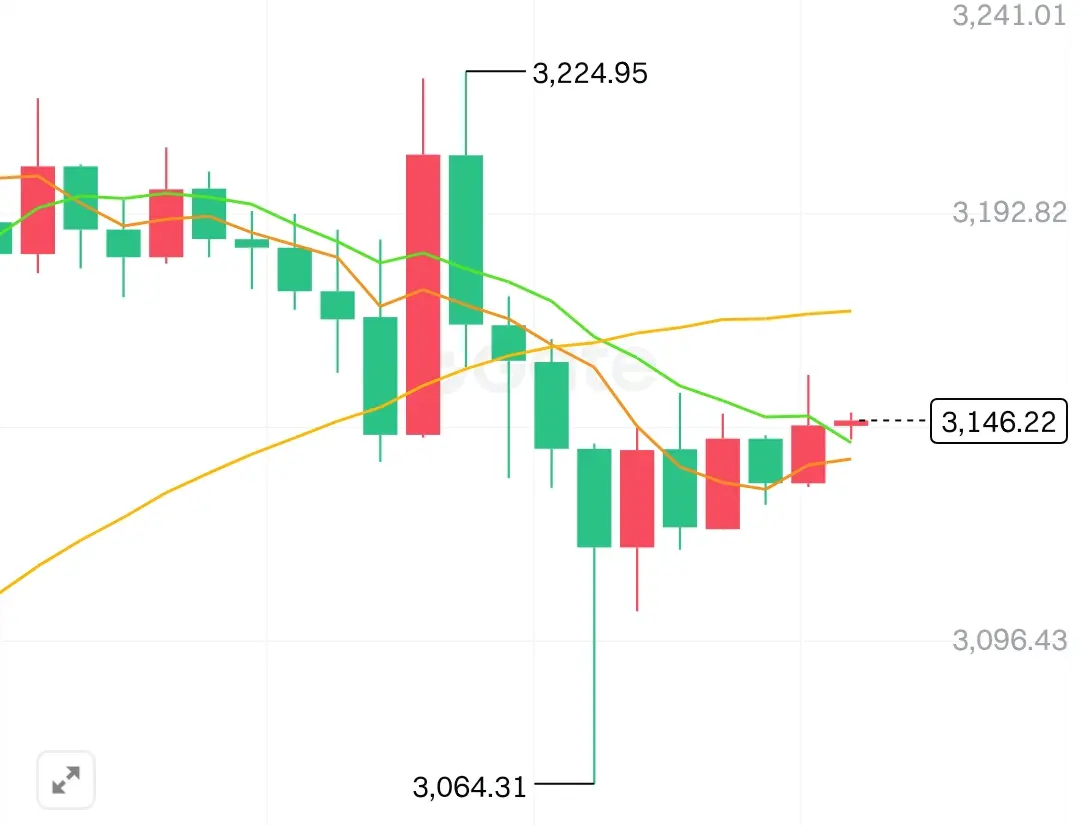
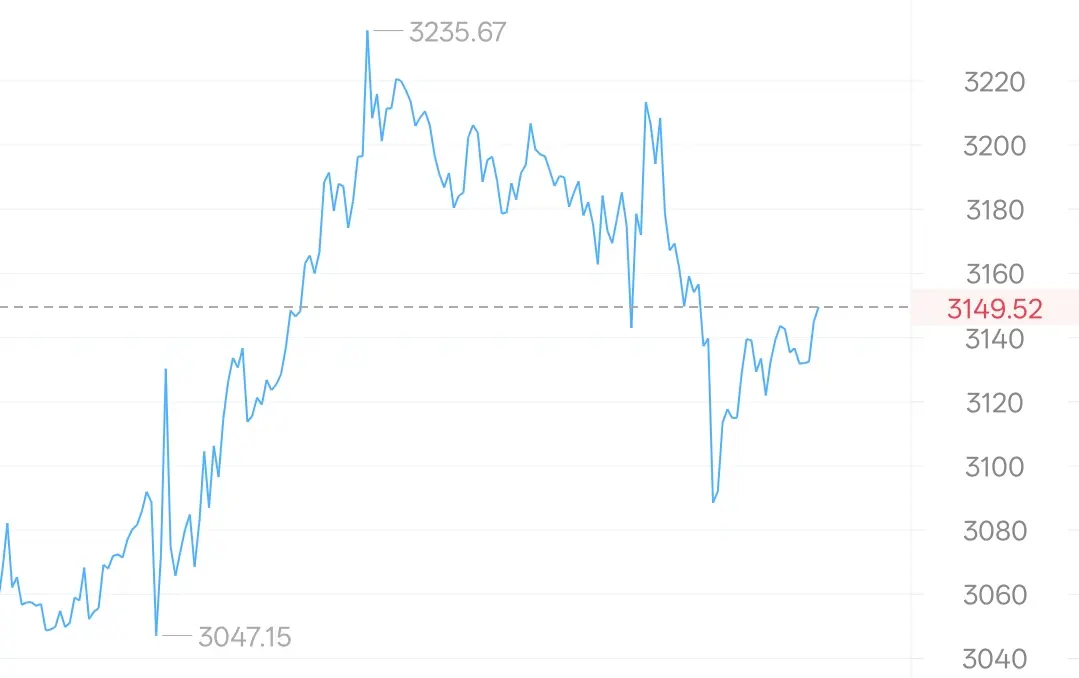
Morning of 12.5
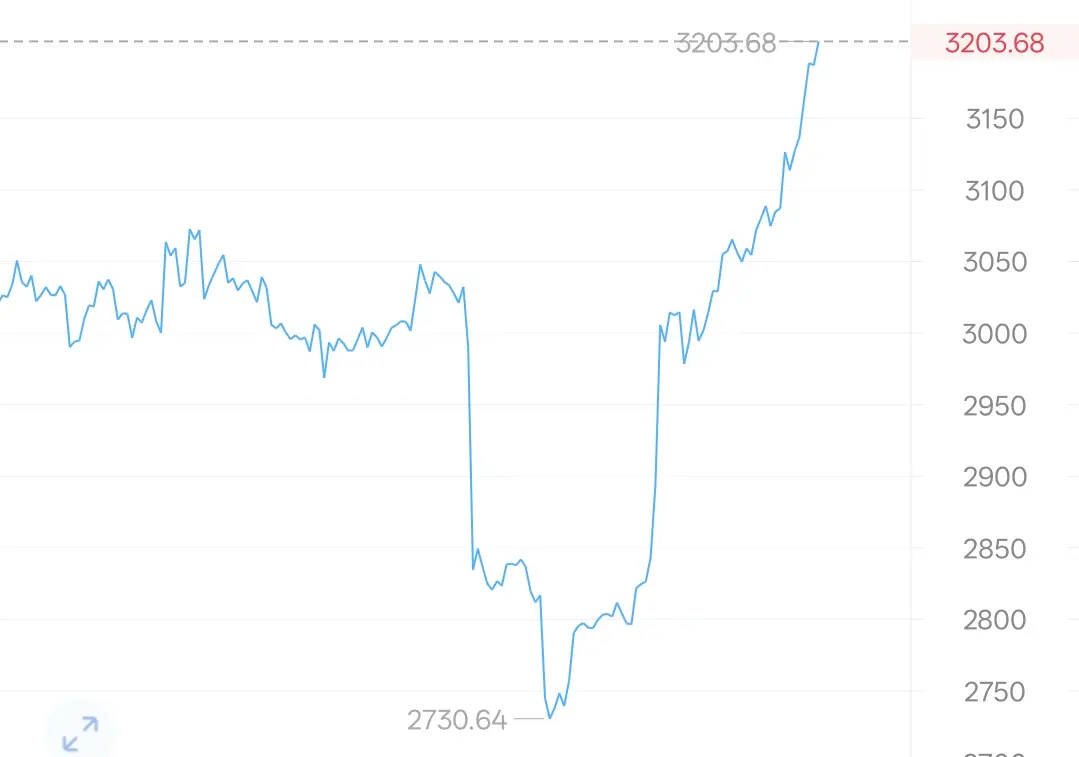
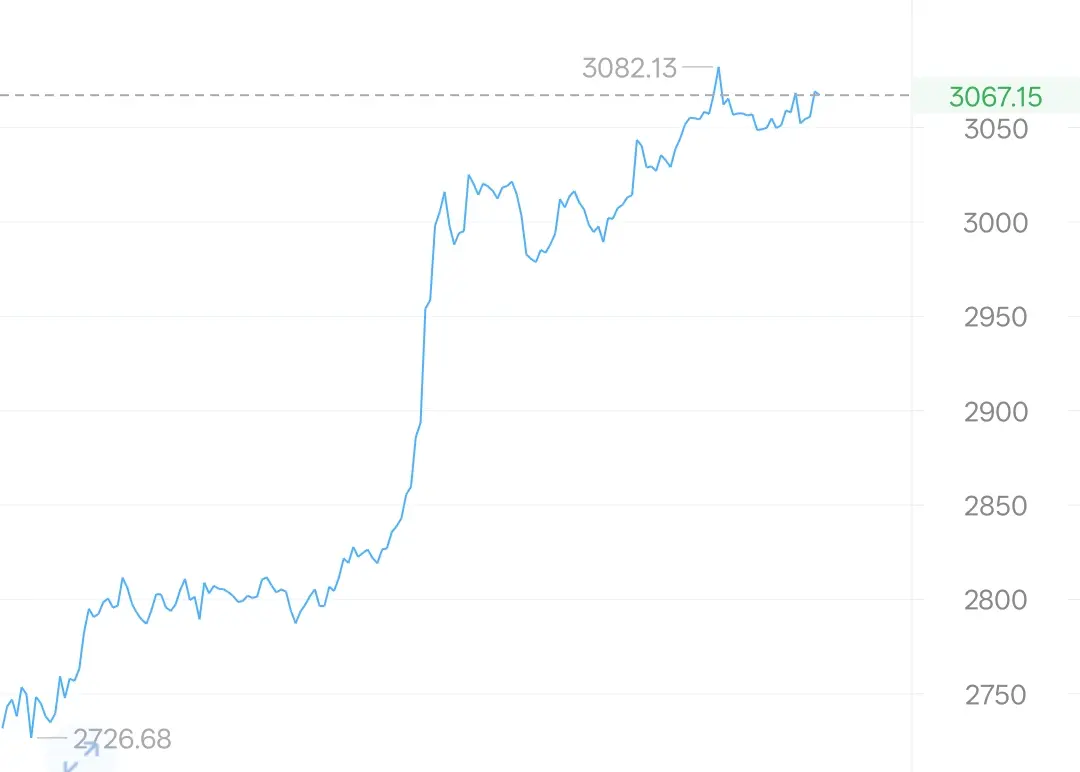
From the 1-hour ETH chart and technical indicators, the short term is in a weak rebound phase after a decline, with the overall trend still bearish. The rebound momentum is limited, and the candlesticks show a sharp drop followed by weak recovery. Previously, after surging to 3227, the price quickly dropped to a low of 3064, forming a long bearish candlestick, followed by a series of small bullish and bearish oscillating candles, typical of a weak recovery after a decline, without any reversal bullish candlestick pattern. The resistance is obvious, and the price failed to break
From the 1-hour ETH chart and technical indicators, the short term is in a weak rebound phase after a decline, with the overall trend still bearish. The rebound momentum is limited, and the candlesticks show a sharp drop followed by weak recovery. Previously, after surging to 3227, the price quickly dropped to a low of 3064, forming a long bearish candlestick, followed by a series of small bullish and bearish oscillating candles, typical of a weak recovery after a decline, without any reversal bullish candlestick pattern. The resistance is obvious, and the price failed to break
ETH-0.82%
MC:$3.56KHolders:4
0.17%
- Reward
- 1
- 1
- Repost
- Share
AAChenHaoyu:
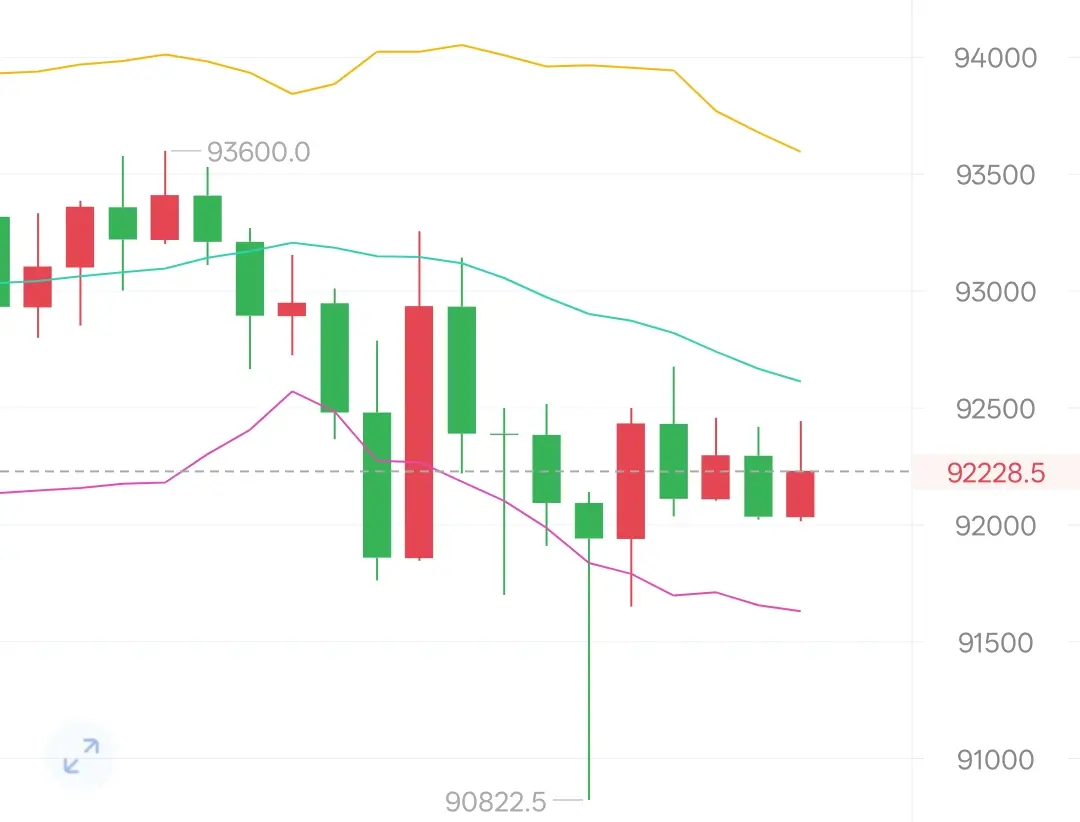
Hmm.Morning of 12.5
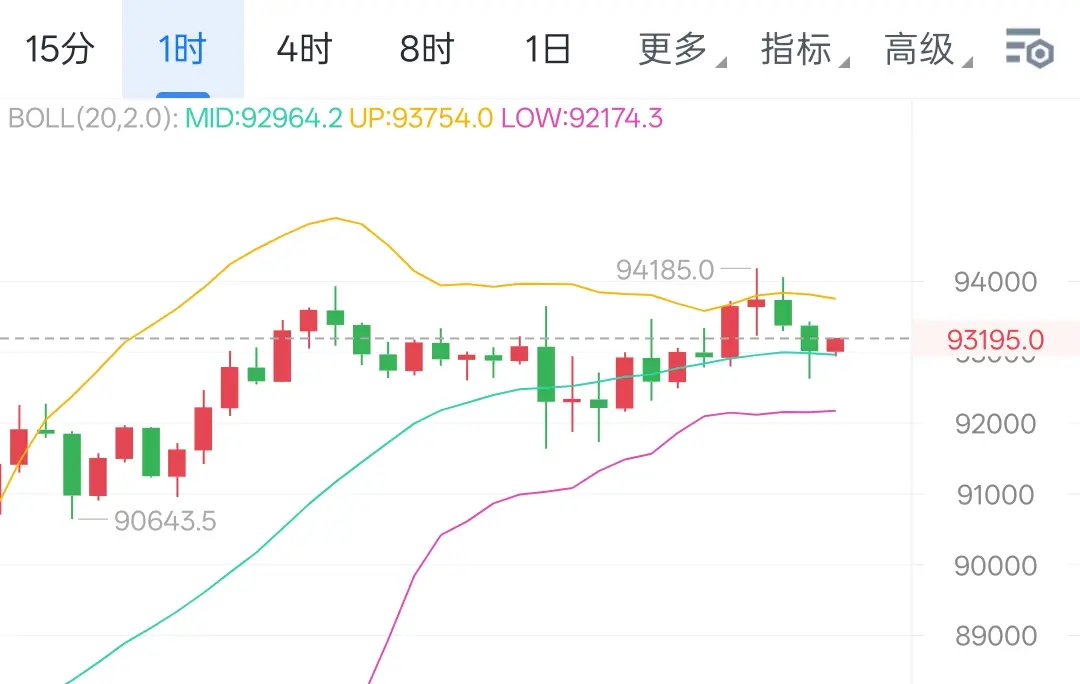
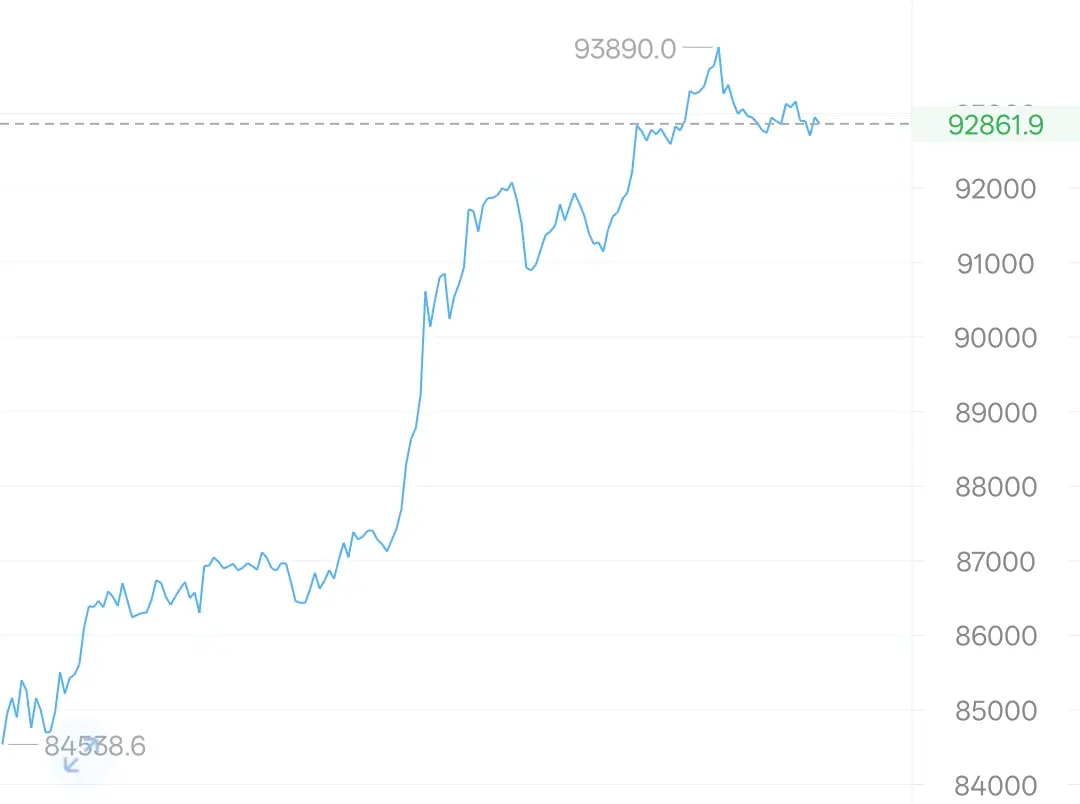
From the 1-hour chart and technical indicators, BTC is showing a short-term weak consolidation with a higher probability of testing support on the downside. Recently, it has formed a pattern of rising and then gradually declining. After hitting the high of 94185, the price has continued to close with bearish candles, breaking below the Bollinger Bands middle line at 92618 and forming a series of consecutive declining candles, indicating that short-term bullish momentum is exhausted and bears have taken the initiative. In addition, there has been a period of low-level consolidat
From the 1-hour chart and technical indicators, BTC is showing a short-term weak consolidation with a higher probability of testing support on the downside. Recently, it has formed a pattern of rising and then gradually declining. After hitting the high of 94185, the price has continued to close with bearish candles, breaking below the Bollinger Bands middle line at 92618 and forming a series of consecutive declining candles, indicating that short-term bullish momentum is exhausted and bears have taken the initiative. In addition, there has been a period of low-level consolidat
BTC-1.18%

MC:$3.42KHolders:2
0.00%
- Reward
- 1
- 1
- Repost
- Share
AAChenHaoyu:
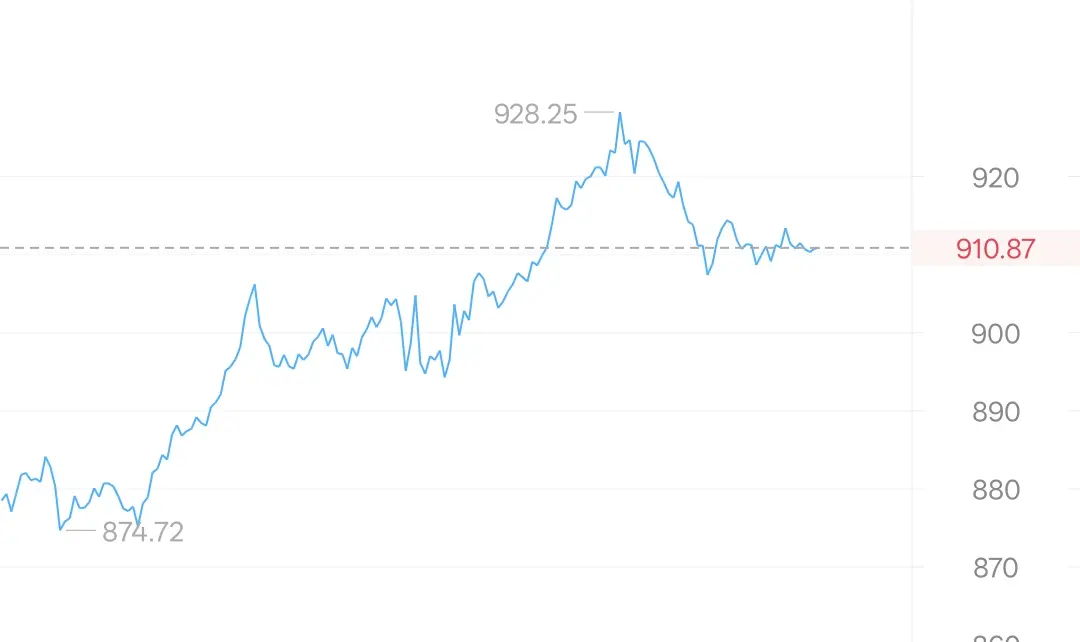
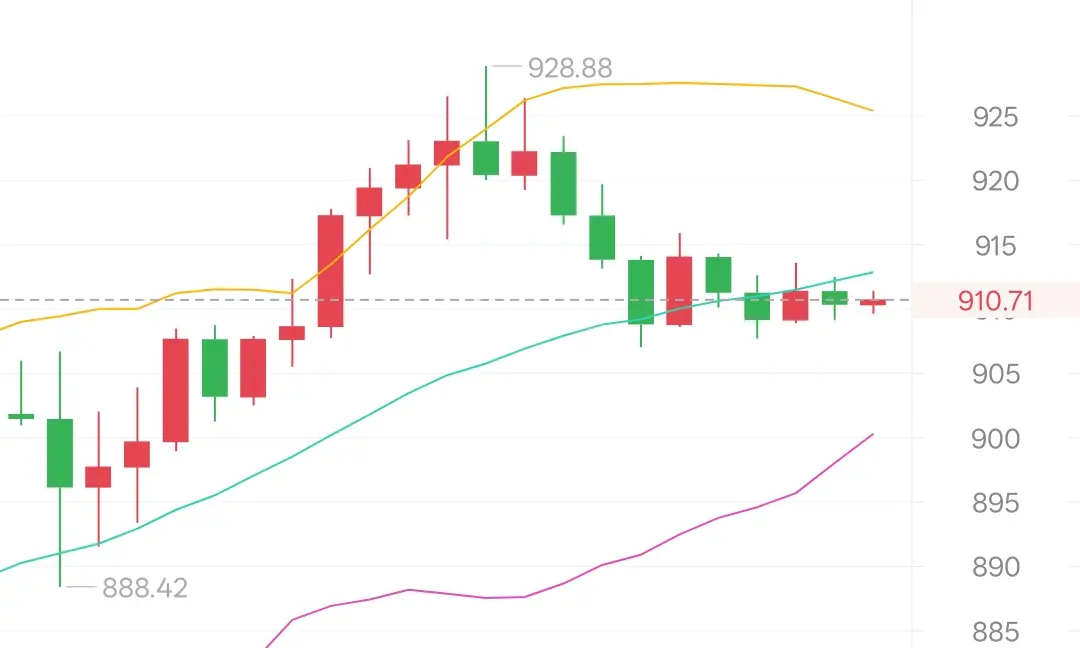
5Evening of 12.4
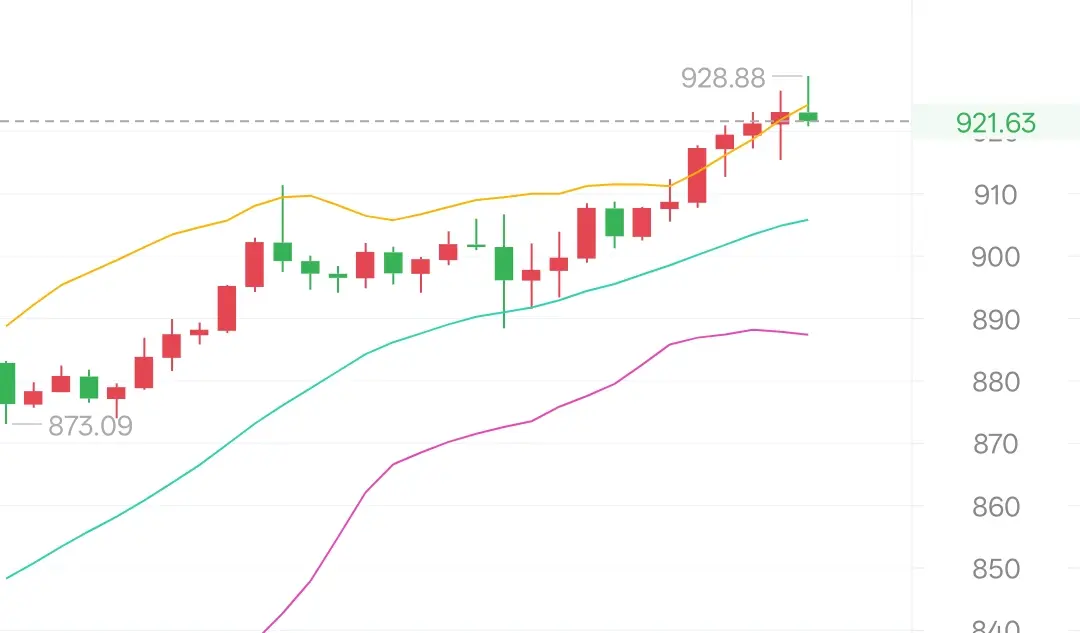
The current BNB candlestick pattern is a consolidation after a surge and pullback. On the 1-hour chart, there was a surge with high volume followed by a pullback on lower volume. Previously, the price quickly rose from 888.42 to the intraday high of 928.88, then retraced with small bearish and bullish candles on decreasing volume, indicating profit-taking after the rise and a period of range-bound volatility. Recently, candlesticks have been fluctuating between the 910-915 range, without any significant breakout, and overall are in a consolidation phase within an uptrend.
Curre
BNB-1.04%
- Reward
- 1
- Comment
- Repost
- Share
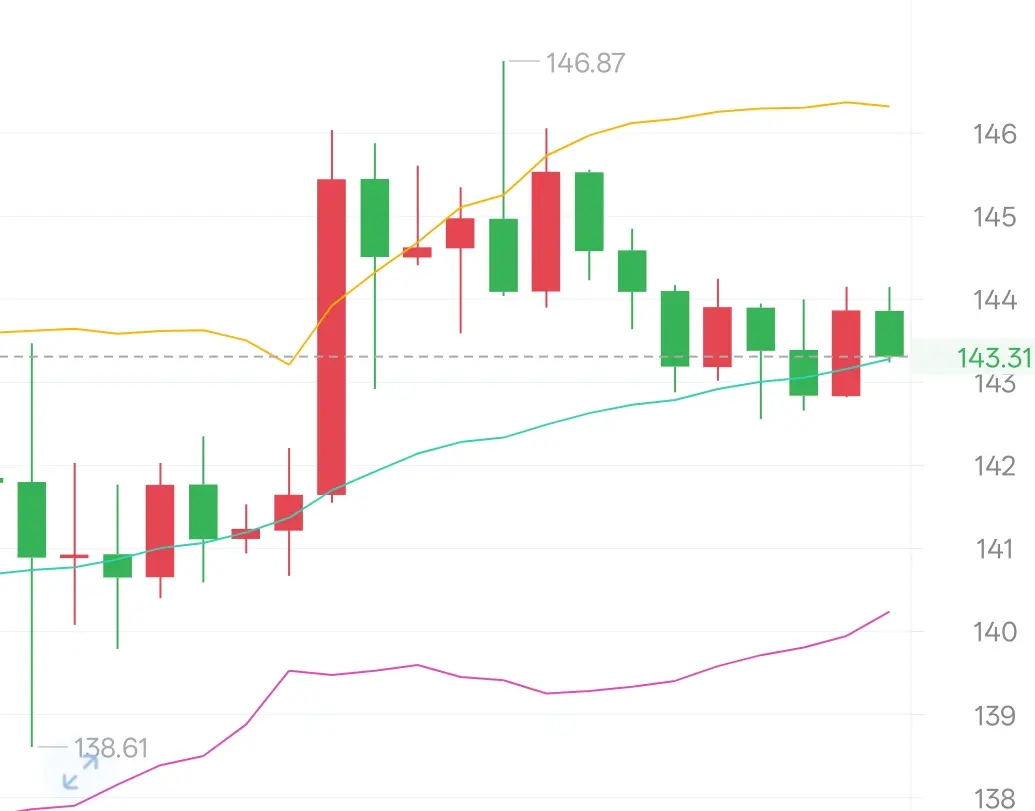
Evening of December 4
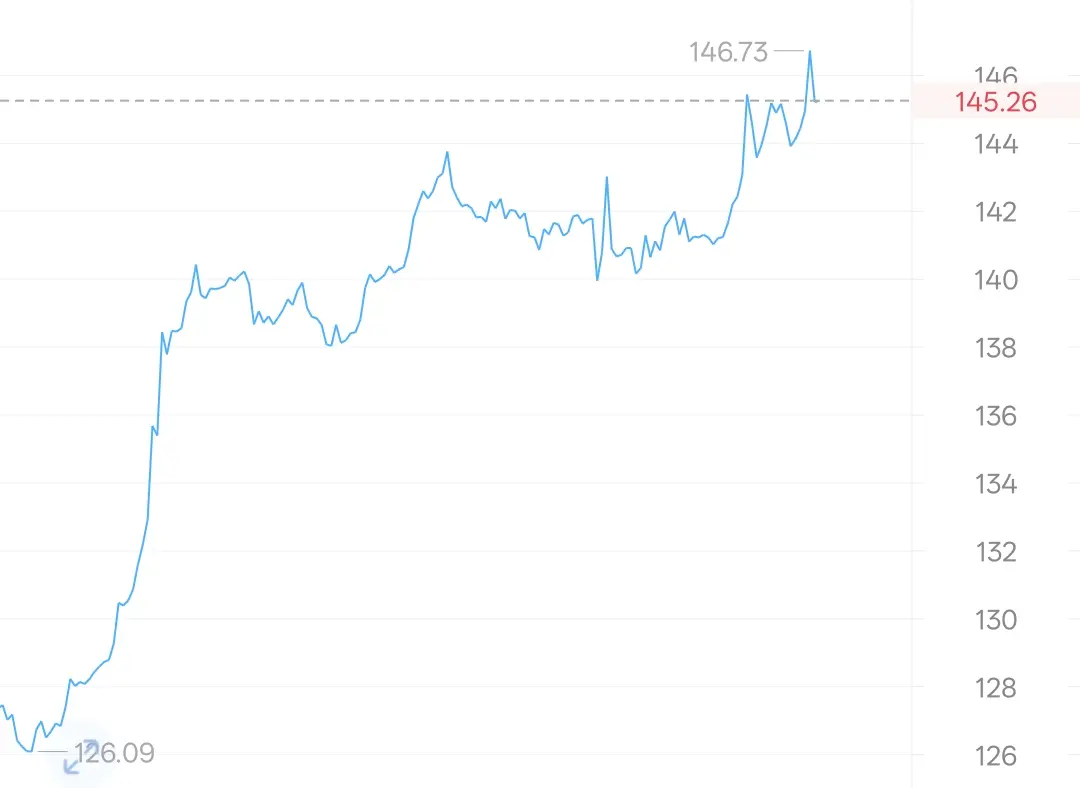
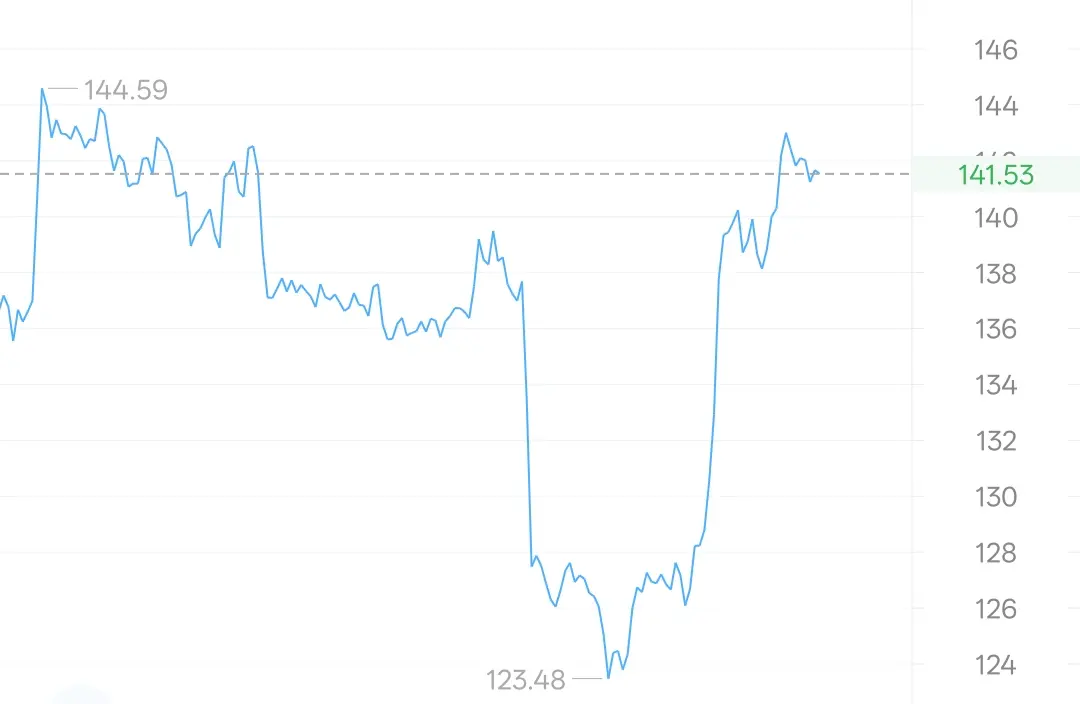
The current SOL candlestick pattern shows a consolidation and recovery after a surge and pullback. On the 1-hour chart, there is a pattern of high-volume surge followed by low-volume correction. Previously, the price rapidly climbed from 138.61 to the intraday high of 146.87, then retraced in a low-volume consolidation with small bullish and bearish candles, indicating profit-taking and consolidation after the rise. Recently, candlesticks have been fluctuating around the 143-144 range without significant breakdowns, and bullish momentum remains supported.
Currently, the p
SOL-3.36%
MC:$4.33KHolders:3
0.00%
- Reward
- 1
- 1
- Repost
- Share
WolfMouthEatsMeat :
:
Hop on board!🚗Evening of December 4
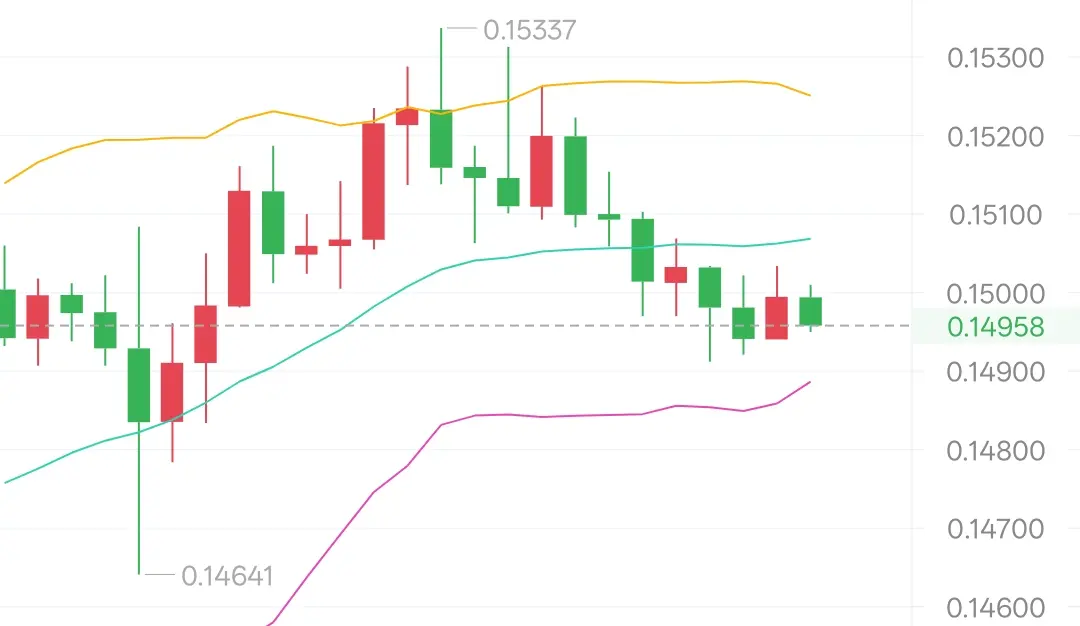
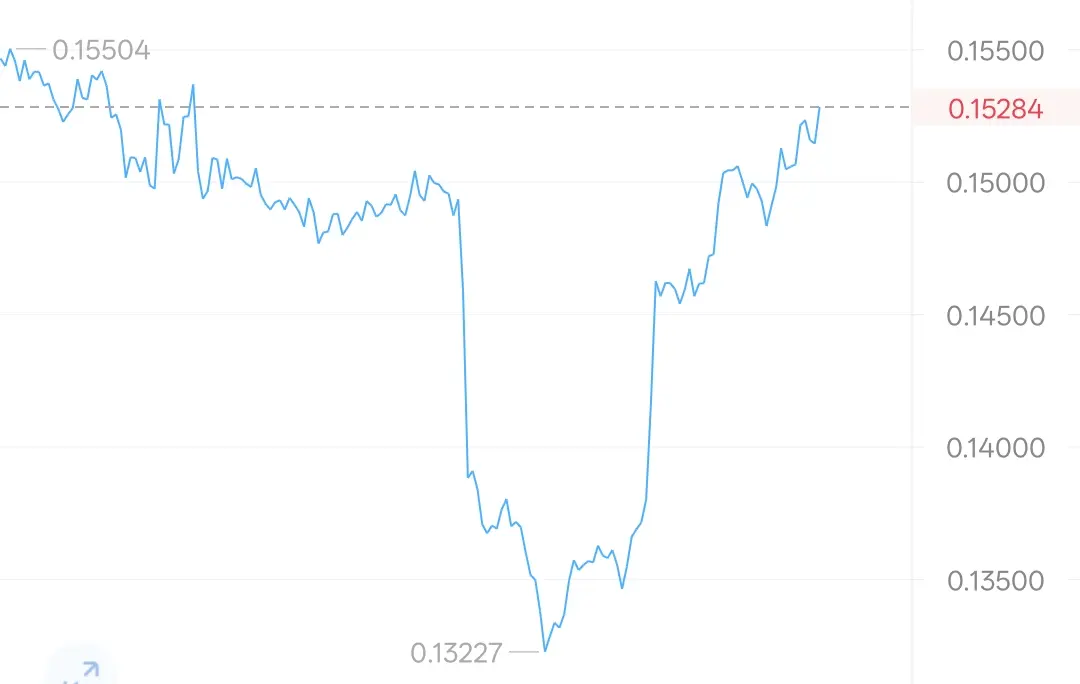
The current DOGE candlestick pattern shows consolidation after a surge and pullback. On the 1-hour chart, it’s exhibiting a pattern of rallying and then encountering resistance, followed by a low-volume pullback. Previously, it rapidly climbed from 0.14641 to the intraday high of 0.15337, then continued to retreat, with recent candles mainly being small bearish and bullish lines on reduced volume. It is currently oscillating around the 0.1500 mark, which is a stage of profit-taking and range consolidation after an upward move.
Currently, it is below the middle band of the
DOGE-2.15%
MC:$4.23KHolders:728
0.07%
- Reward
- 3
- 1
- Repost
- Share
GateUser-9cf9e527:
I believe in growthEvening of 12.4
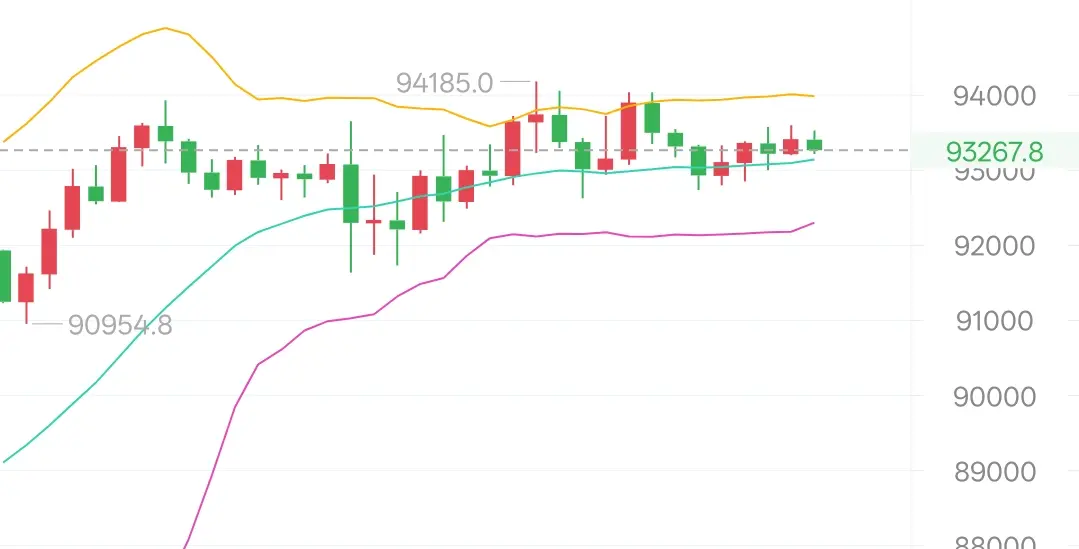
The current BTC candlestick pattern is a relatively strong consolidation structure. On the 1-hour chart, it shows a range-bound pattern following a surge and pullback. Previously, the price quickly rose from 91637 to the intraday high of 94185, then pulled back and fluctuated repeatedly within the 93000-93500 range. Recently, the candlesticks have alternated between small bullish and bearish candles, with no major bearish breakdowns, indicating a consolidation after an upward move.
At present, BTC is above the middle band of the Bollinger Bands at 93147, with the middle band sl
BTC-1.18%
MC:$3.42KHolders:2
0.00%
- Reward
- 1
- Comment
- Repost
- Share
Evening of 12.4
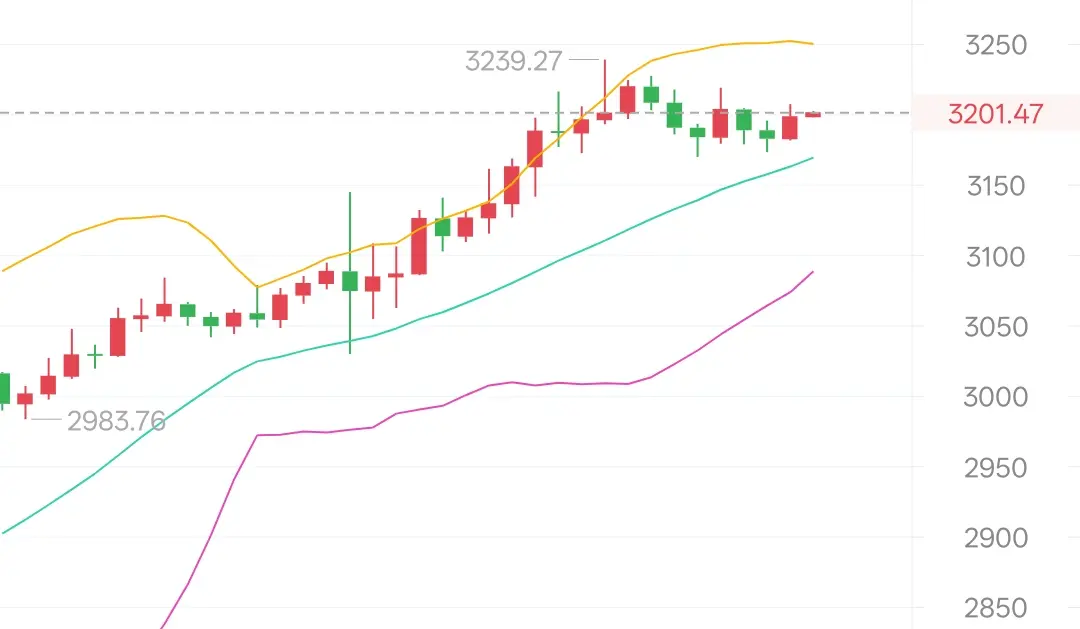
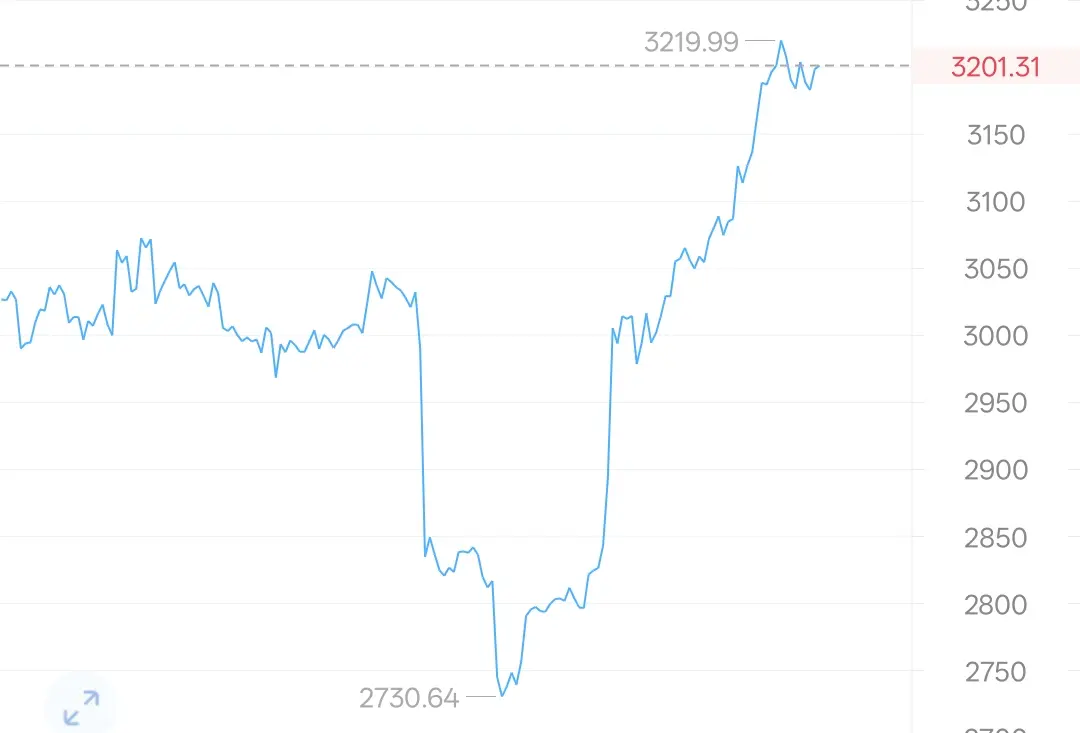
ETH's current candlestick pattern shows a short-term consolidation with a bias toward a strong upward structure. On the 1-hour chart, there is a combination of small bullish candles and small bearish pullbacks, which is a "consolidating uptrend" pattern. Previously, the price surged quickly from 2983.76 to an intraday high of 3239.27, forming a wave of volume-driven increase. Afterwards, the price pulled back with small bearish and bullish candles, but did not break below the key support. The current price of 3201 remains above the middle Bollinger Band at 3169, indicating a he
ETH's current candlestick pattern shows a short-term consolidation with a bias toward a strong upward structure. On the 1-hour chart, there is a combination of small bullish candles and small bearish pullbacks, which is a "consolidating uptrend" pattern. Previously, the price surged quickly from 2983.76 to an intraday high of 3239.27, forming a wave of volume-driven increase. Afterwards, the price pulled back with small bearish and bullish candles, but did not break below the key support. The current price of 3201 remains above the middle Bollinger Band at 3169, indicating a he
ETH-0.82%
MC:$3.56KHolders:4
0.17%
- Reward
- 2
- 1
- Repost
- Share
ReallyLoveDio!:
Take off, off, off, off, off, off, off, off, off, off, off, off, off, off, off, off, off, off, off, off, off, off, off, off, off, off, off, off, off, off, off, off, off, off, off, off, off, off, off, off, off, off, off, off, off, off, off, off, off, off, off, off, off, off, off, off, off, off, off, off, off, off, off, off, off, off, off, off, off, off, off, offMorning of 12.4
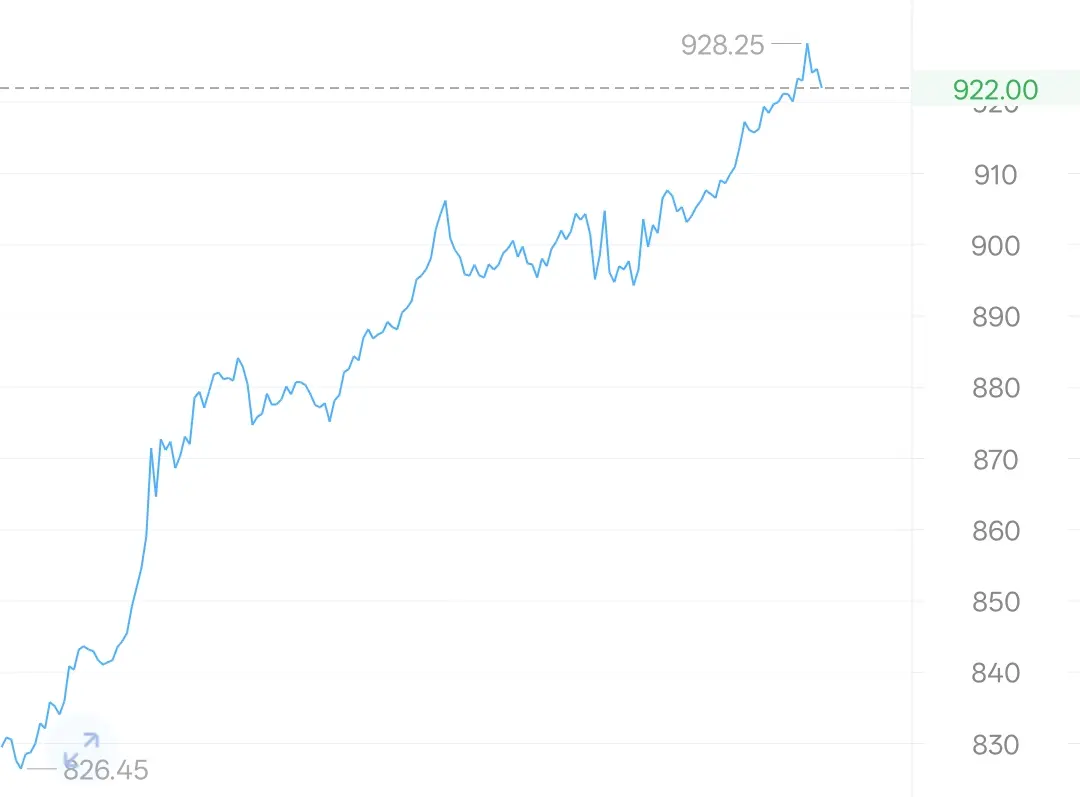
From the current 1-hour candlestick chart and indicators, BNB's short-term movement shows a "short-term correction" pattern characterized by a spike followed by a pullback. The current 1-hour chart shows a structure of "a long bullish candle surging to the intraday high of 928.88, followed by a bearish pullback." After the previous rapid rise from 874.00, a bearish candle with a long upper shadow appeared at the higher level, indicating "profit-taking after a breakout." Overall, this is a retracement and consolidation pattern within an uptrend, but the bearish candles are not l
From the current 1-hour candlestick chart and indicators, BNB's short-term movement shows a "short-term correction" pattern characterized by a spike followed by a pullback. The current 1-hour chart shows a structure of "a long bullish candle surging to the intraday high of 928.88, followed by a bearish pullback." After the previous rapid rise from 874.00, a bearish candle with a long upper shadow appeared at the higher level, indicating "profit-taking after a breakout." Overall, this is a retracement and consolidation pattern within an uptrend, but the bearish candles are not l
BNB-1.04%
MC:$3.7KHolders:4
0.18%
- Reward
- 1
- Comment
- Repost
- Share
Morning of 12.4
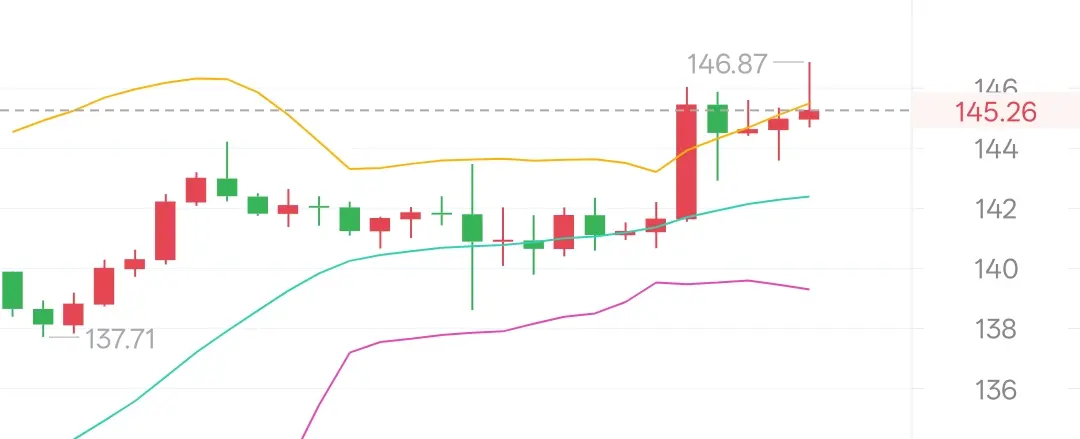
From the current 1-hour K-line chart and indicators, SOL's short-term trend shows a "pullback consolidation" pattern after a high-volume surge, with the current 1-hour chart displaying a "long bullish breakout + pullback from highs" structure. Previously, the price surged rapidly from 137.71 to the intraday high of 146.87, then fell back to 145.21, which is a "profit-taking after breaking through key resistance." Overall, this is a strong pullback pattern within an uptrend, with small bearish candlesticks during the pullback and no break below the key support from the previous
From the current 1-hour K-line chart and indicators, SOL's short-term trend shows a "pullback consolidation" pattern after a high-volume surge, with the current 1-hour chart displaying a "long bullish breakout + pullback from highs" structure. Previously, the price surged rapidly from 137.71 to the intraday high of 146.87, then fell back to 145.21, which is a "profit-taking after breaking through key resistance." Overall, this is a strong pullback pattern within an uptrend, with small bearish candlesticks during the pullback and no break below the key support from the previous
SOL-3.36%
MC:$4.33KHolders:3
0.00%
- Reward
- 1
- Comment
- Repost
- Share
Morning of 12.4
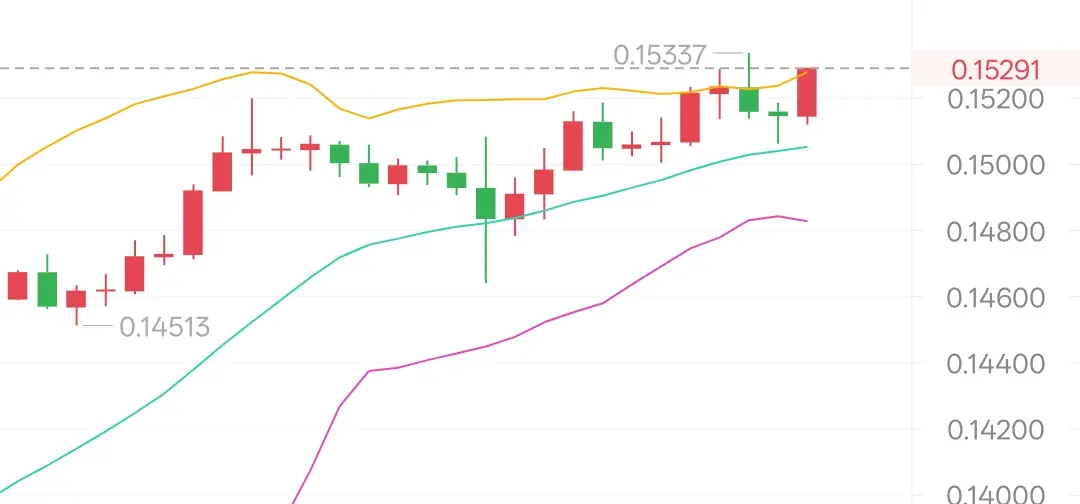
The current DOGE candlestick pattern belongs to a “pullback after a surge” form following a volatile upward movement. On the current 1-hour chart, it shows a “breakout above previous highs + slight pullback” structure. Previously, it gradually trended upward from 0.14513, reached an intraday high of 0.1534, then slightly pulled back to 0.1529, which is considered a “short-term profit-taking after a volume-driven rally.” Overall, it is a strong consolidation pattern within an uptrend, with bullish candles dominating and only minor retracements, indicating bullish sentiment remai
The current DOGE candlestick pattern belongs to a “pullback after a surge” form following a volatile upward movement. On the current 1-hour chart, it shows a “breakout above previous highs + slight pullback” structure. Previously, it gradually trended upward from 0.14513, reached an intraday high of 0.1534, then slightly pulled back to 0.1529, which is considered a “short-term profit-taking after a volume-driven rally.” Overall, it is a strong consolidation pattern within an uptrend, with bullish candles dominating and only minor retracements, indicating bullish sentiment remai
DOGE-2.15%
MC:$4.23KHolders:728
0.07%
- Reward
- 3
- Comment
- Repost
- Share
Morning of 12.4
Based on the current 1-hour candlestick chart and indicators, let's analyze the short-term trend and pattern of BTC: The candlestick pattern shows a "rally and pullback" consolidation after a choppy uptrend. The current 1-hour chart displays a structure of "surging to the 94185 intraday high followed by a bearish pullback." Previously, it gradually climbed from 91637, touched 94185, and then quickly retraced to 92874, which is a "profit-taking after breaking the previous high." Overall, this is a consolidation pattern within an uptrend, but the long bearish candlesticks at the
Based on the current 1-hour candlestick chart and indicators, let's analyze the short-term trend and pattern of BTC: The candlestick pattern shows a "rally and pullback" consolidation after a choppy uptrend. The current 1-hour chart displays a structure of "surging to the 94185 intraday high followed by a bearish pullback." Previously, it gradually climbed from 91637, touched 94185, and then quickly retraced to 92874, which is a "profit-taking after breaking the previous high." Overall, this is a consolidation pattern within an uptrend, but the long bearish candlesticks at the
BTC-1.18%
MC:$3.42KHolders:2
0.00%
- Reward
- 1
- Comment
- Repost
- Share
Morning of 12.4
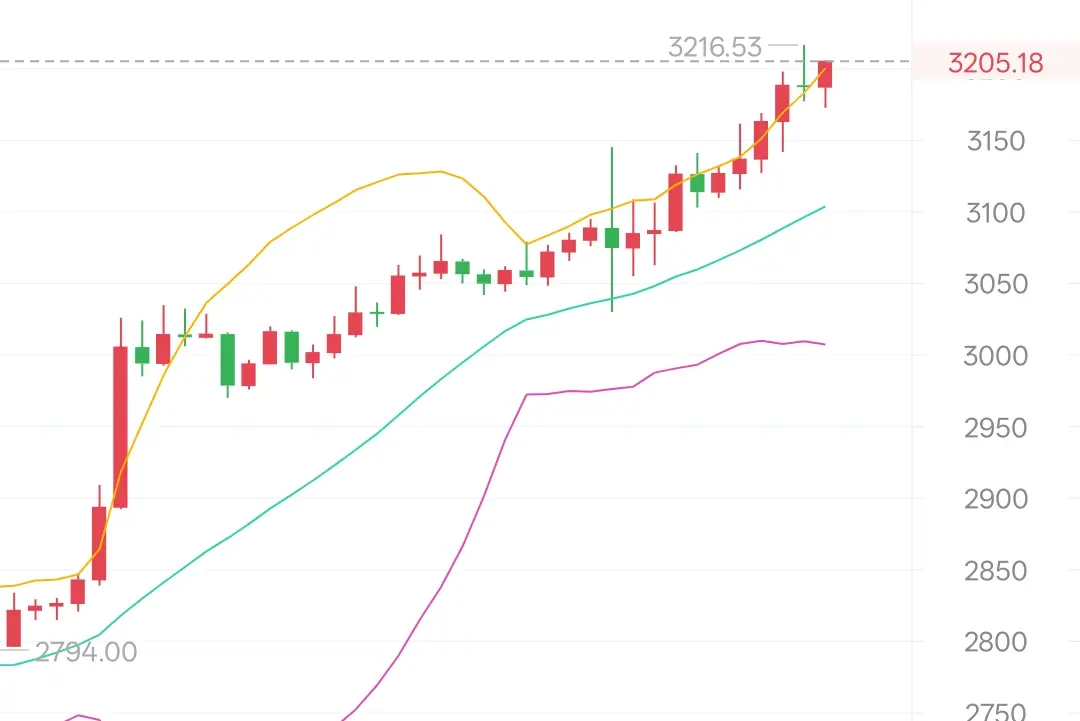
On the current 1-hour ETH chart, there is a structure of consecutive bullish candles followed by small bearish candles after a surge and pullback. The price rapidly surged from 2970 to an intraday high of 3216, then slightly retreated to the 3188 level, which is considered a “retest confirmation after a breakout on increased volume.” Overall, this is an accelerated rally pattern within an uptrend, but the appearance of small bearish candles at high levels indicates that short-term bullish momentum is slightly weakening and there is some profit-taking pressure.
Technical indicat
ETH-0.82%
MC:$3.75KHolders:2
0.00%
- Reward
- 5
- 3
- 1
- Share
Cccwccc:
Take off, off, off, off, off, off, off, off, off, off, off, off, off, off, off, off, off, off, off, off, off, off, off, off, off, off, off, off, off, off, off, off, off, off, off, off, off, off, off, off, off, off, off, off, off, off, off, off, off, off, off, off, off, off, off, off, off, off, off, off, off, off, off, off, off, off, off, off, off, off, off, off, off, offView More
Evening of 12.3
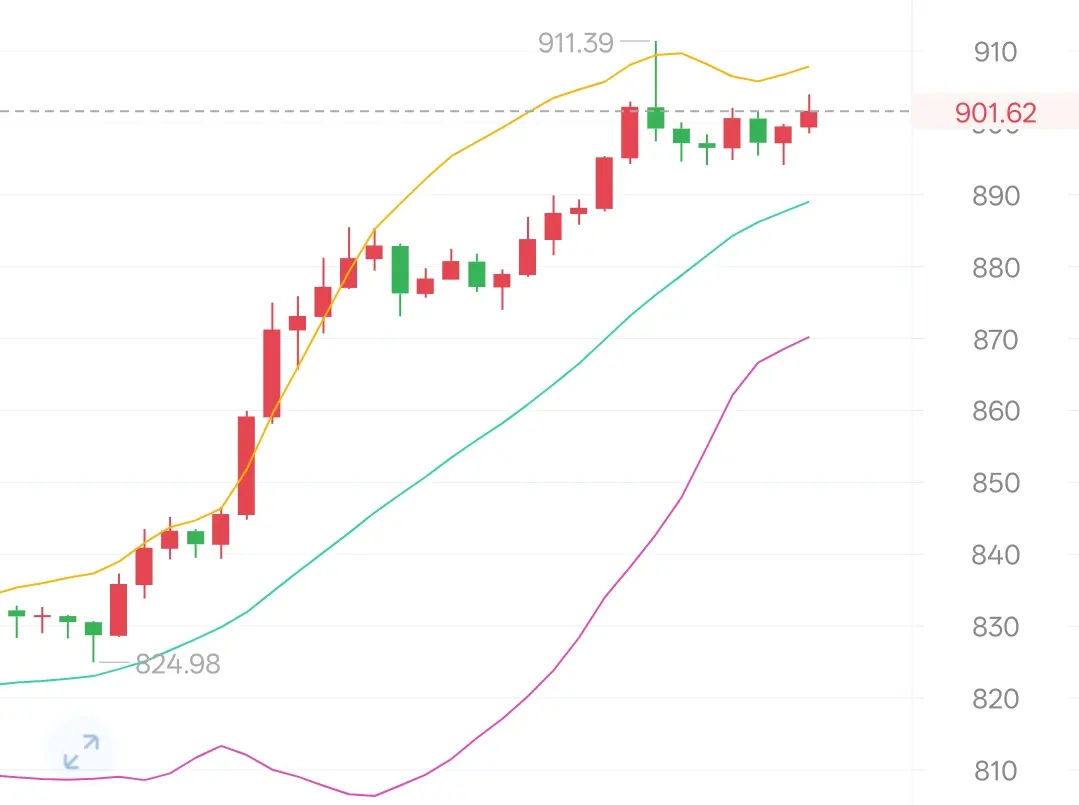
BNB is currently showing a pattern of strong volume surge and high-level consolidation on the one-hour chart: it quickly rose from a low of 874.00 to a high of 911.39, an increase of over 4%, then entered a consolidation phase with alternating red and green candlesticks. The latest candlestick is a small bullish one, indicating a short-term state of "profit-taking after a strong rally and weak tug-of-war between bulls and bears," with the overall trend remaining strong.
Currently, it is near the upper Bollinger Band at 908.12, with the middle band support near 889.12 and the lo
View OriginalBNB is currently showing a pattern of strong volume surge and high-level consolidation on the one-hour chart: it quickly rose from a low of 874.00 to a high of 911.39, an increase of over 4%, then entered a consolidation phase with alternating red and green candlesticks. The latest candlestick is a small bullish one, indicating a short-term state of "profit-taking after a strong rally and weak tug-of-war between bulls and bears," with the overall trend remaining strong.
Currently, it is near the upper Bollinger Band at 908.12, with the middle band support near 889.12 and the lo
MC:$3.7KHolders:4
0.18%
- Reward
- 2
- Comment
- Repost
- Share
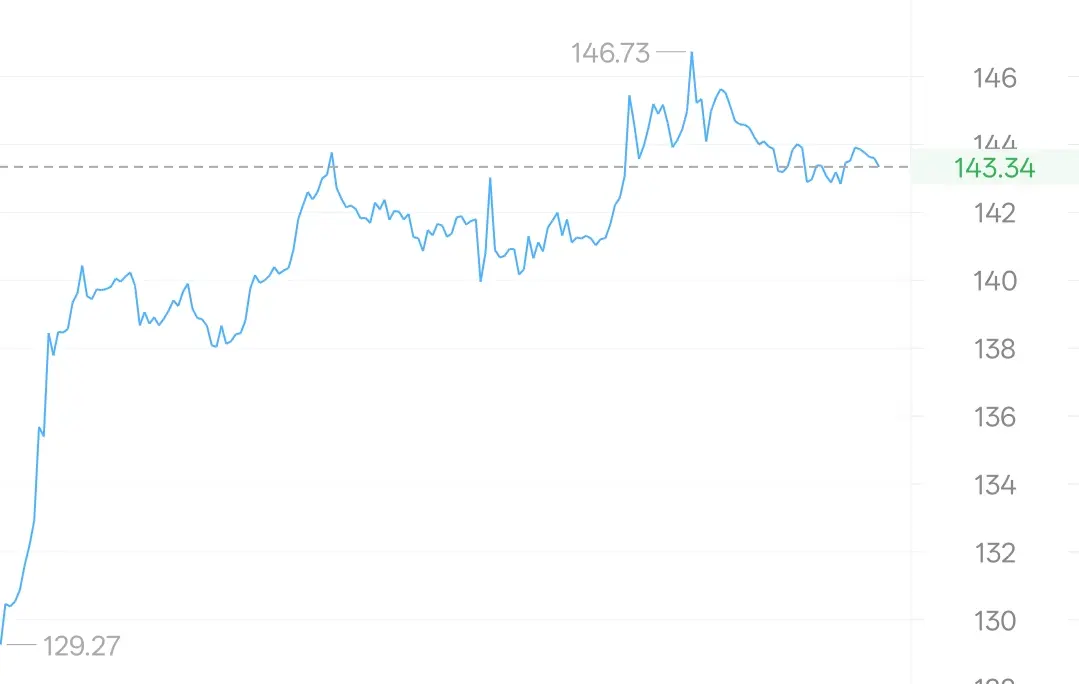
Evening of December 3
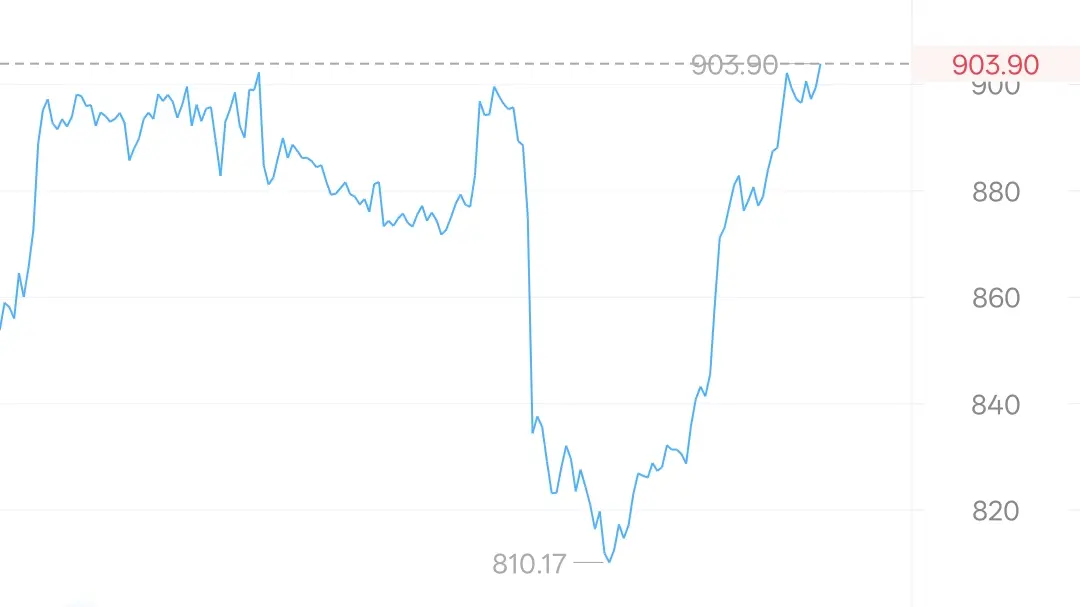
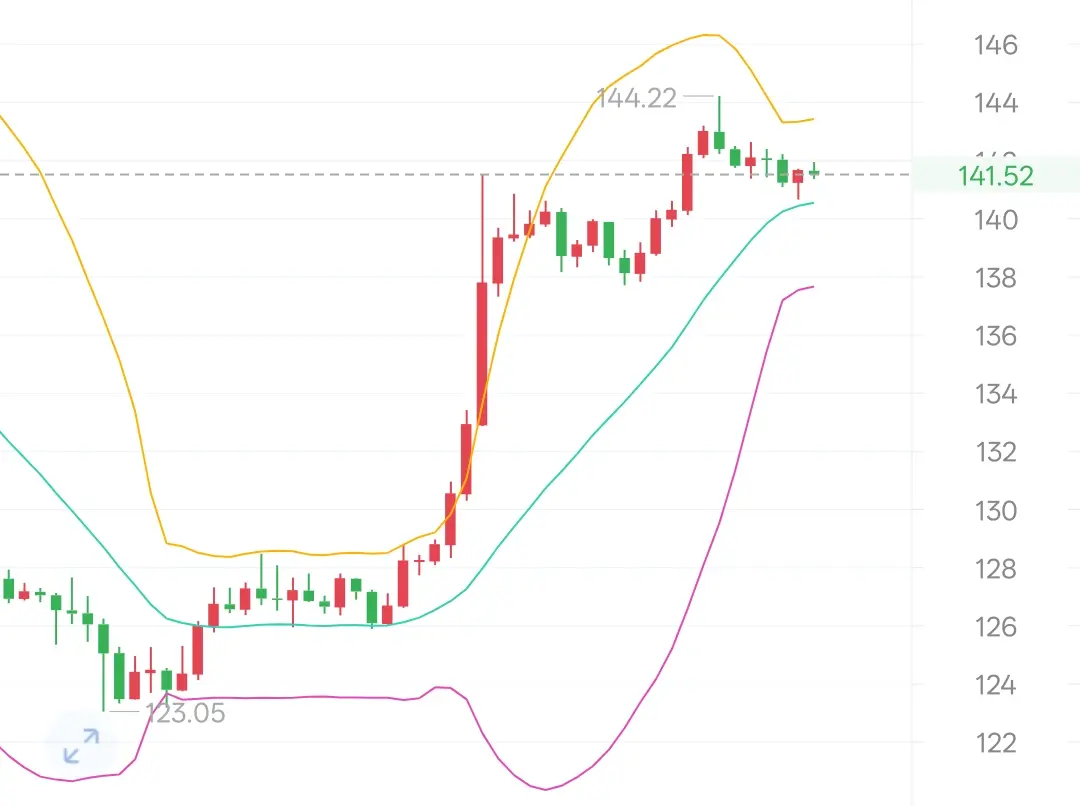
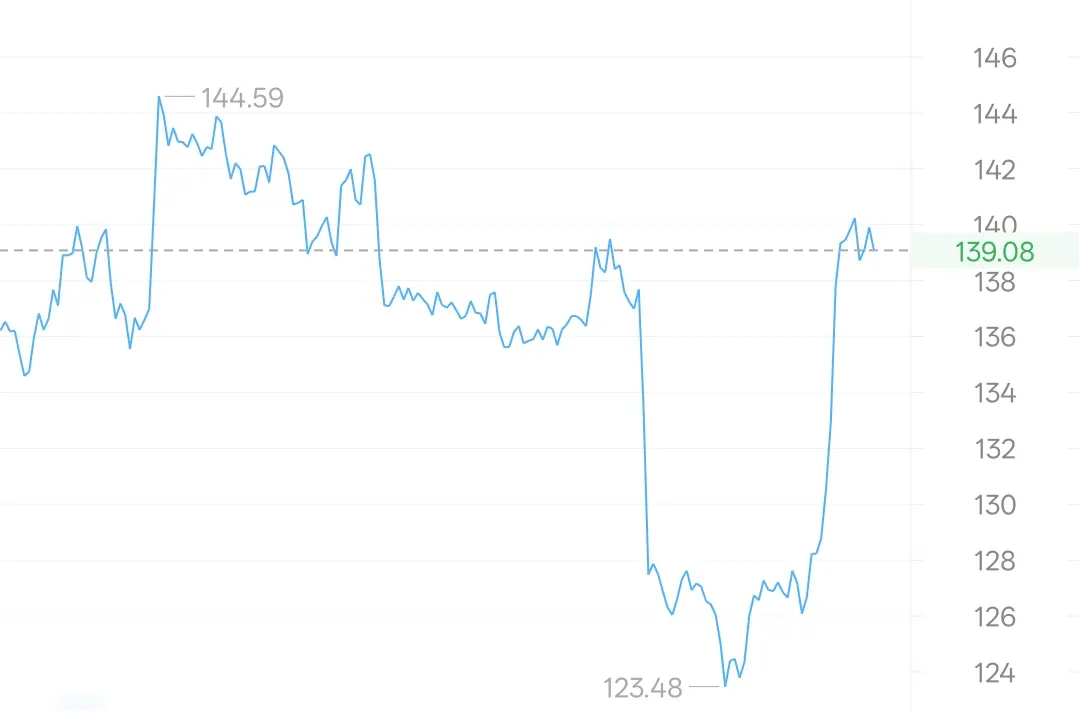
SOL is showing a sharp surge followed by high-level consolidation; it first violently surged from a low of 123.05 to a high of 144.22, with a gain of over 17%. Afterwards, it entered a period of alternating red and green candlesticks, consolidating with the latest candlestick being a small bullish candle, indicating that in the short term, it is in the "profit-taking after a strong rally + long-short game" phase.
Currently, it is above the middle band of the Bollinger Bands at 140.55, with upper band resistance at 143.43 and lower band support at 137.67. It is in the rhyt
SOL-3.36%
MC:$3.79KHolders:1
0.00%
- Reward
- 2
- Comment
- Repost
- Share
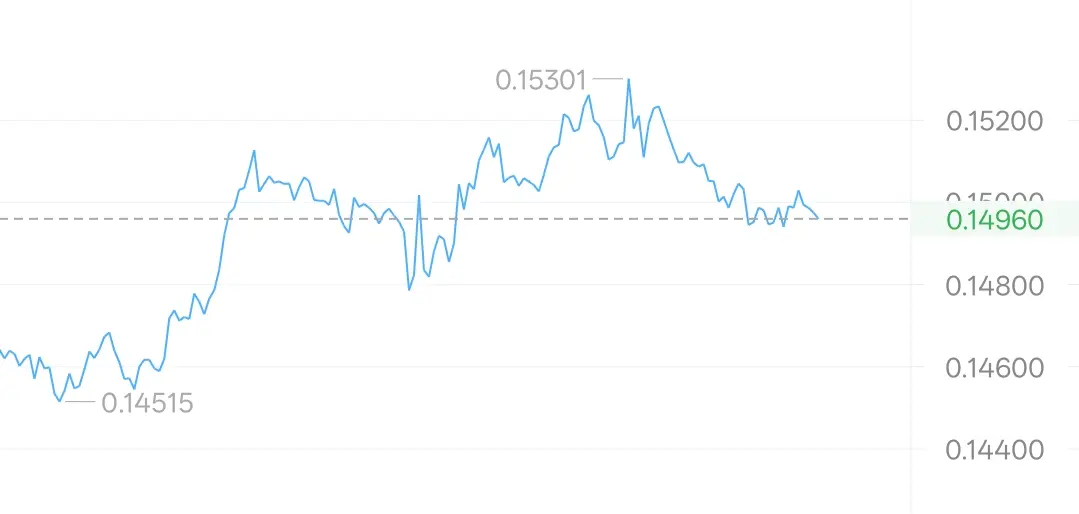
Evening of 12.3
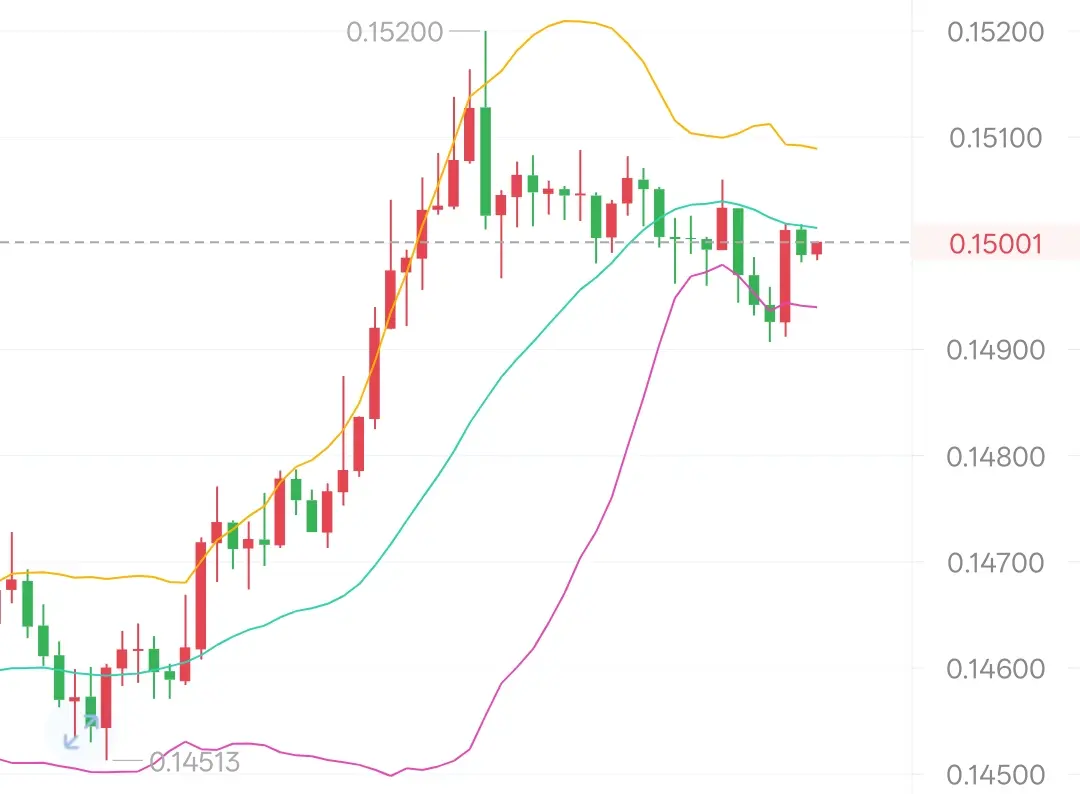
Doge previously experienced a rapid surge followed by a pullback, quickly rising from around 0.145 to a high of 0.152. Afterwards, alternating red and green candlesticks indicated a choppy correction. The latest candlestick is a small bearish candle, suggesting a slight contraction in short-term bullish momentum, but overall, it remains in a high-level consolidation range after the rally.
Currently, it is near the middle Bollinger Band at 0.15014, with upper band resistance at 0.15089 and lower band support at 0.14940. The price is oscillating near the middle band in a relative
DOGE-2.15%
MC:$4.23KHolders:728
0.07%
- Reward
- 4
- 7
- Repost
- Share
GarikBY:
Short from 1.6 and you'll be happyView More
Evening of 12.3
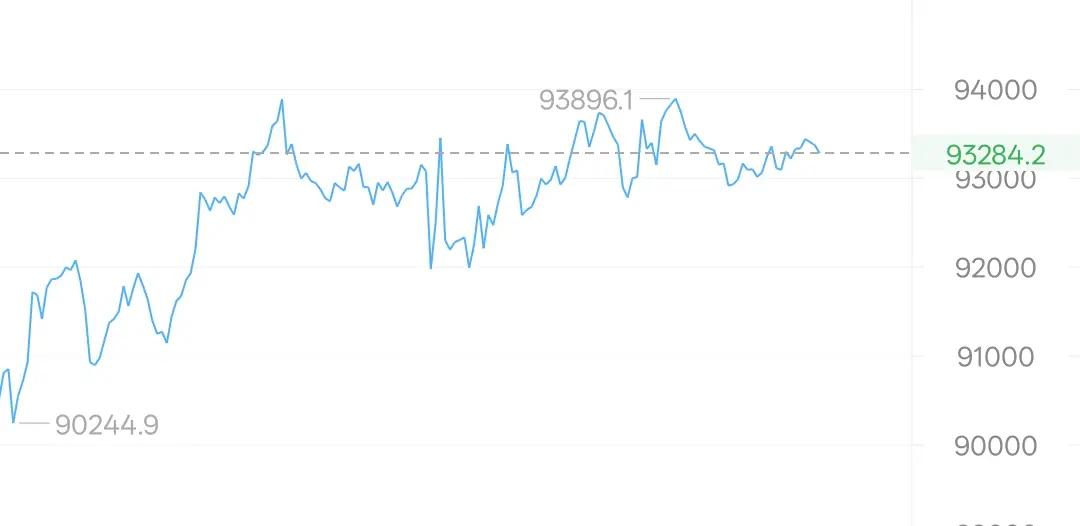
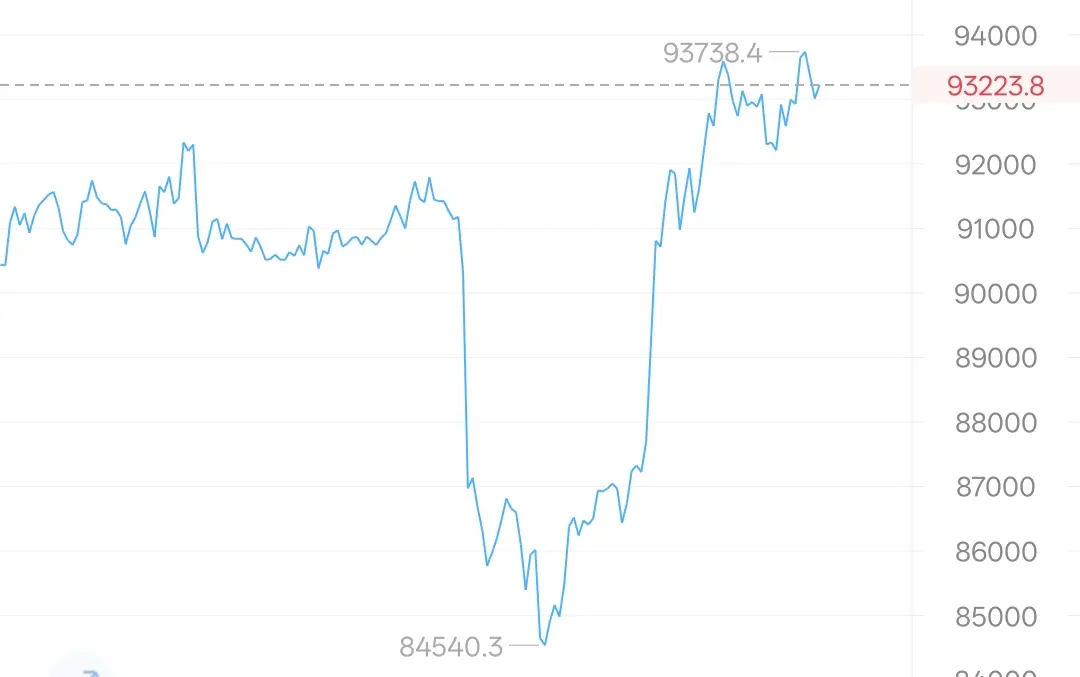
Recently, BTC has shown a pattern of surging to new highs and then pulling back in a volatile manner: it first quickly rose to a high of 93,932.7, followed by several alternating red and green candlesticks, indicating intensified long-short battles; the latest candlestick is a bearish candle with a long upper shadow, suggesting increased selling pressure above and a weakening of short-term upward momentum.
Currently, the price is near the middle band of the Bollinger Bands, with upper band resistance around 93,326 and lower band support around 92,647. The current price is close
View OriginalRecently, BTC has shown a pattern of surging to new highs and then pulling back in a volatile manner: it first quickly rose to a high of 93,932.7, followed by several alternating red and green candlesticks, indicating intensified long-short battles; the latest candlestick is a bearish candle with a long upper shadow, suggesting increased selling pressure above and a weakening of short-term upward momentum.
Currently, the price is near the middle band of the Bollinger Bands, with upper band resistance around 93,326 and lower band support around 92,647. The current price is close
MC:$3.42KHolders:2
0.00%
- Reward
- 1
- Comment
- Repost
- Share
12.3 morning
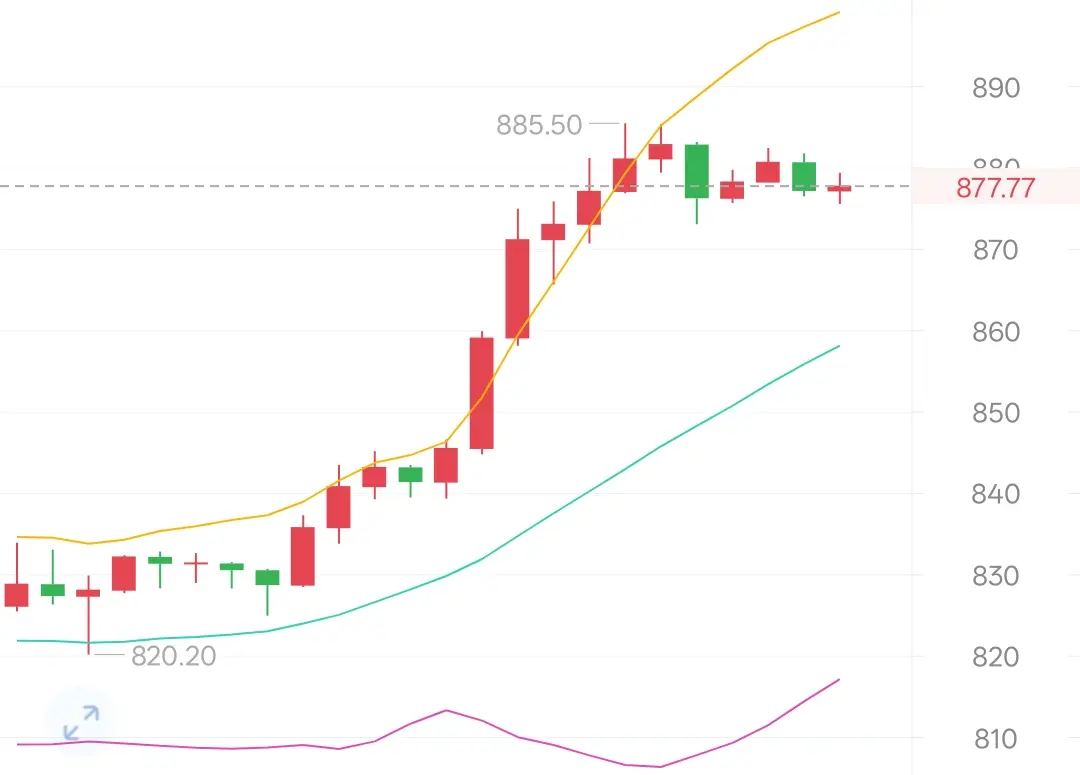
From the current 1-hour K-line and indicators, BNB is in a high position of oscillation after a short-term rise; previously, it rose continuously from around 820.20, reaching a peak of 885.50, and is currently retracing to 877.20, which is a "volume reduction pullback" oscillation after the breakout.
Recently, several candlesticks have small bodies and alternate between red and green, without breaking through key support levels, indicating that the bulls still have the upper hand, which is a process of digesting positions after a short-term rise.
Overall, it belongs to "trend br
BNB-1.04%
MC:$3.7KHolders:4
0.18%
- Reward
- 2
- 2
- Repost
- Share
TheGodOfWealthBlessesYou. :
:
Dear author, are the coins you recommend issued by you?View More
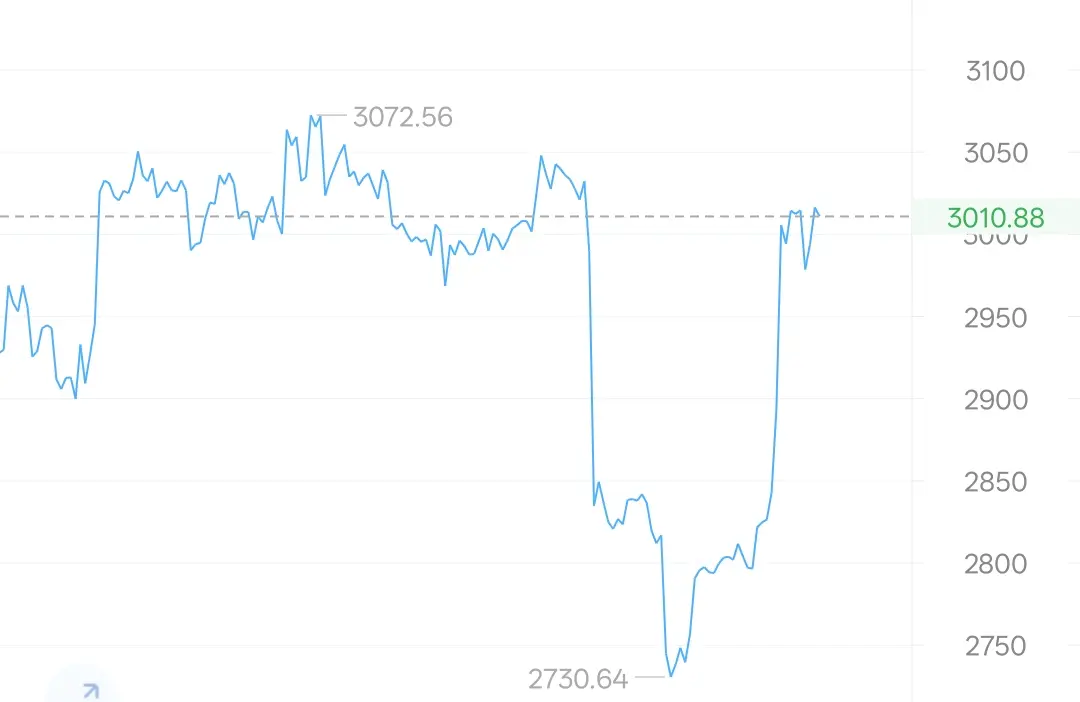
12.3 Morning
From the current 1-hour candlestick and indicators, SOL is in a high-level consolidation phase after a strong short-term surge; previously, it rapidly rose from around 125.89, breaking through with a large bullish candle, reaching a maximum of 141.50, and is currently retreating to the 139 position, which is a "profit-taking consolidation" after the breakout. The recent few candles are mainly small bodies with alternating red and green, without significant pullbacks, indicating that the bulls still have control, but it is just a digestion of chips after a rapid short-term increase
From the current 1-hour candlestick and indicators, SOL is in a high-level consolidation phase after a strong short-term surge; previously, it rapidly rose from around 125.89, breaking through with a large bullish candle, reaching a maximum of 141.50, and is currently retreating to the 139 position, which is a "profit-taking consolidation" after the breakout. The recent few candles are mainly small bodies with alternating red and green, without significant pullbacks, indicating that the bulls still have control, but it is just a digestion of chips after a rapid short-term increase
SOL-3.36%

MC:$4.33KHolders:3
0.00%
- Reward
- 2
- 3
- Repost
- Share
GateUser-ad9a5956 :
:
Anyone who has traded contracts understands: that's not trading, that's trading your sleep for a fleeting sense of false certainty. You go to bed still holding your position, and when you close your eyes, all you see are liquidation lines. When you wake up in the middle of the night, your first instinct isn’t to get a drink of water, but to check the candlestick chart. The scariest thing about contracts isn’t losing money, but making you think, “If I just watch a bit longer, I can turn it around.” The more you watch, the more chaotic it gets; the more you calculate, the more anxious you become. You end up monitoring the market until dawn, your emotions tethered to the price action, your sleep hollowed out by leverage, and the next day you continue like a zombie. What you lose isn’t just your principal, but your energy, focus, and judgment.
To put it bluntly, as long as you have an open position, you’re always in a state of “ready to be woken up at any moment.” You can’t sleep well, you wake up too quickly, and your heart beats faster than the market.
Contracts aren’t a shortcut to making money—they’re the end of quality sleep.
You think you’re staying up late waiting for an opportunity, but really, you’re turning yourself into the opportunity.
View More
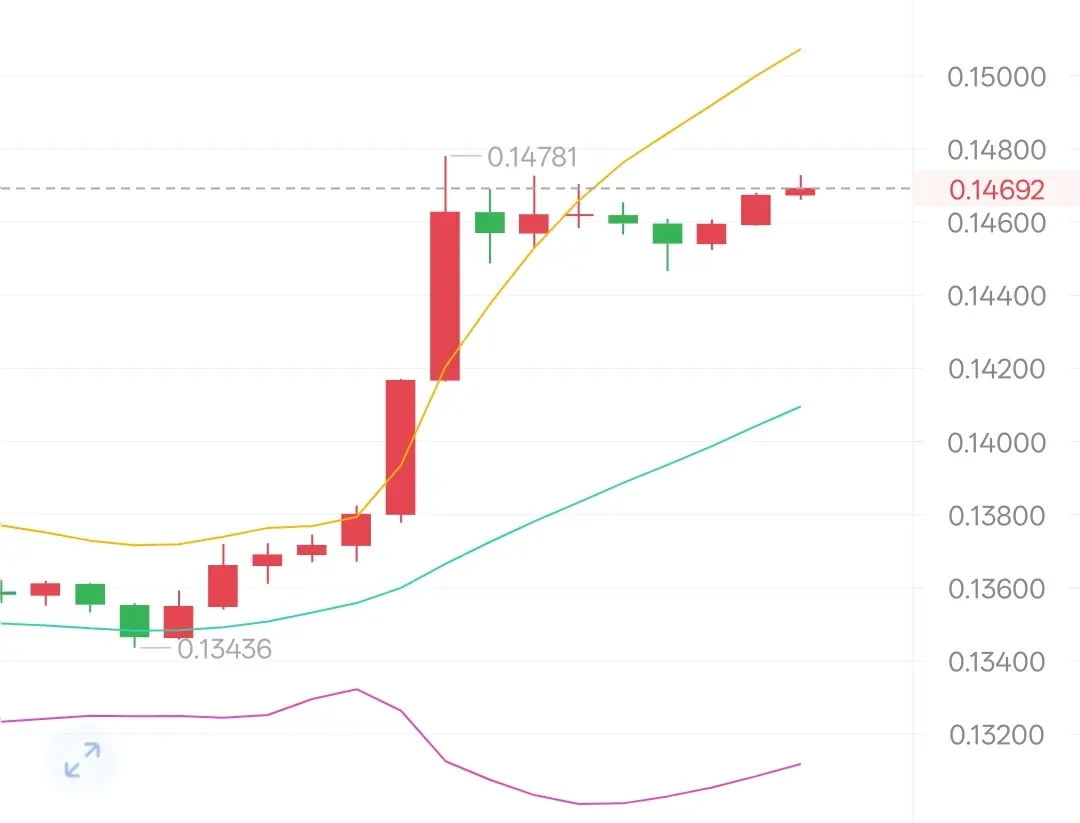
12.3 Morning
From the current 1-hour K-line and indicators, Doge is in a high-level consolidation phase after a short-term bullish surge. The previous price quickly surged from around 0.13436, resulting in a large bullish candlestick breakout, peaking at 0.1478. It has currently retraced to the 0.1469 level, which belongs to a "pullback confirmation" after the breakout. The recent few K-lines are mainly small-bodied, accompanied by a slight retracement (but not breaking key support), indicating that the bulls still have control, though there is a demand for profit-taking in the short term.
O
DOGE-2.15%

MC:$4.23KHolders:728
0.07%
- Reward
- 12
- 7
- 1
- Share
GateUser-6857559e:
thanks for the useful informationView More
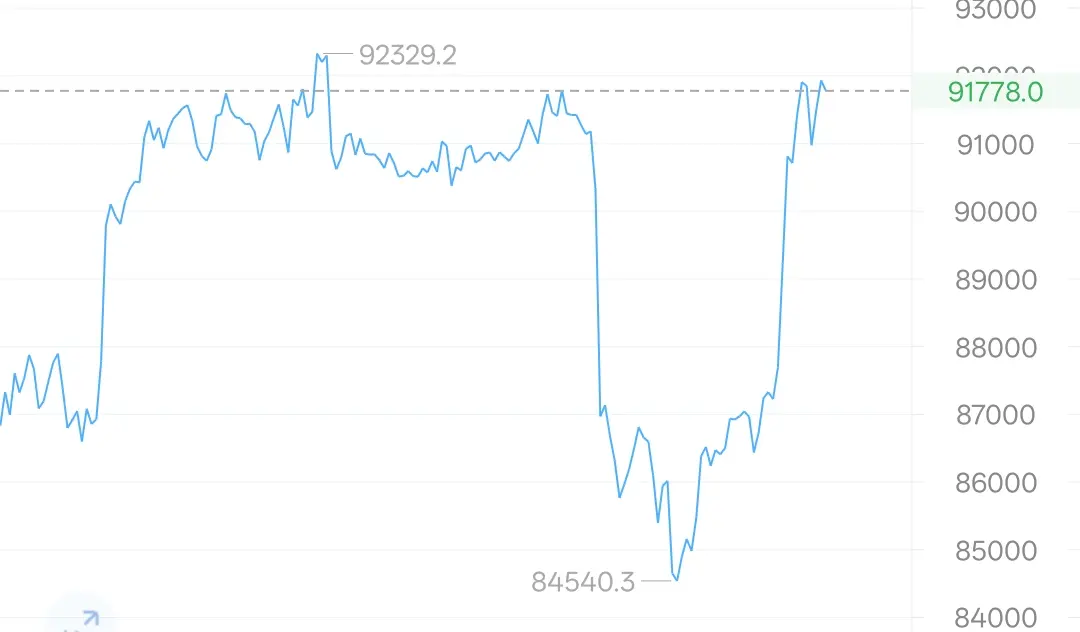
12.3 morning
From the current 1-hour K-line chart and indicators, the short-term trend leans toward a bullish continuation, but caution is needed regarding pullback risks; the price has been steadily rising from around 83786 on December 2, accelerating upward after breaking through the middle band of the Bollinger Bands, with today's highest reaching 92273, currently closing at 91854, which represents a high-level fluctuation after a volume breakout.
Recently, several candlesticks have shown a pattern of "more bullish than bearish + small body adjustments", indicating that the bulls still
BTC-1.18%
MC:$3.75KHolders:2
0.00%
- Reward
- 2
- 2
- Repost
- Share
BigPorridge :
:
Hold on tight, we are about to To da moon 🛫View More