Trade
Basic
Futures
Futures
Hundreds of contracts settled in USDT or BTC
Options
HOT
Trade European-style vanilla options
Unified Account
Maximize your capital efficiency
Demo Trading
Futures Kickoff
Get prepared for your futures trading
Futures Events
Participate in events to win generous rewards
Demo Trading
Use virtual funds to experience risk-free trading
Earn
Launch
CandyDrop
Collect candies to earn airdrops
Launchpool
Quick staking, earn potential new tokens
HODLer Airdrop
Hold GT and get massive airdrops for free
Launchpad
Be early to the next big token project
Alpha Points
NEW
Trade on-chain assets and enjoy airdrop rewards!
Futures Points
NEW
Earn futures points and claim airdrop rewards
Investment
Simple Earn
Earn interests with idle tokens
Auto-Invest
Auto-invest on a regular basis
Dual Investment
Buy low and sell high to take profits from price fluctuations
Soft Staking
Earn rewards with flexible staking
Crypto Loan
0 Fees
Pledge one crypto to borrow another
Lending Center
One-stop lending hub
VIP Wealth Hub
Customized wealth management empowers your assets growth
Private Wealth Management
Customized asset management to grow your digital assets
Quant Fund
Top asset management team helps you profit without hassle
Staking
Stake cryptos to earn in PoS products
Smart Leverage
NEW
No forced liquidation before maturity, worry-free leveraged gains
GUSD Minting
Use USDT/USDC to mint GUSD for treasury-level yields
More
HuXijin
No content yet
HuXijin
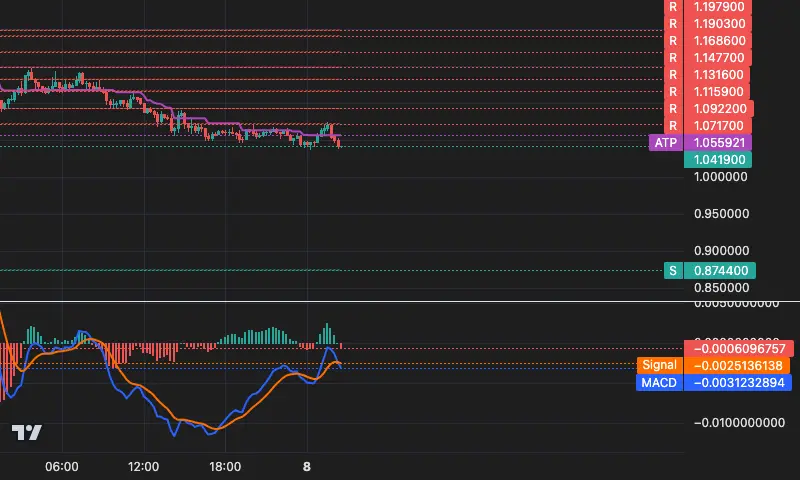
📊 VIRTUAL 15m Technical Overview
💰 Current Price: 1.0419 (-5.27%)
📈 Trend: Bearish trend continues | 66 K-lines have been formed
🎯 Tracking Line: 1.0559 ( Dynamic Stop Loss Reference )
Key Levels:
Support 0.8744
Resistance 1.0717 / 1.0922 / 1.1159
Strategy: The price is pressed below the downtrend line, and the bearish rally continues! 🩳 A rebound is seen as an opportunity to add positions, with targets looking towards the support levels below.
Risk: Be alert for a price rebound testing the recent trend line (1.0559). If it stabilizes above this line, the current downtrend may face stagn
VIRTUAL-9,29%
- Reward
- like
- Comment
- Repost
- Share
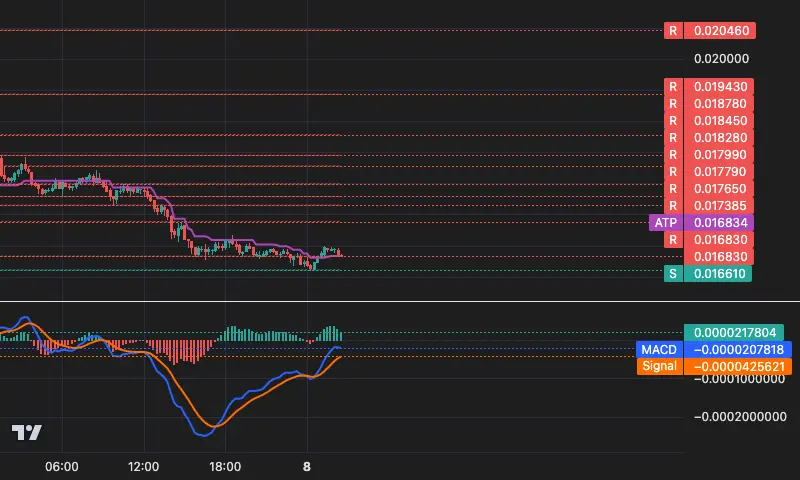
📊 TUT 15-Minute Technical Overview
💰 Current Price: 0.01683 ( -0.71% from Launch Price )
📈 Trend: Upward trend stalls and faces testing | 5 K-lines have been run
🎯 Tracking Line: 0.01683 ( Dynamic stop-loss reference, already touched! )
Key Levels:
Support 0.01661
Resistance 0.01683 / 0.01738 / 0.01765
Strategy: Price is testing the key trend line, be extremely cautious with long positions. If it can hold above 0.01683, consider small positions to gamble on a rebound; if it breaks below, exit decisively.
Risk: The trend line has been touched, danger is imminent! Once broken, it may quickly
TUT-7,68%
- Reward
- like
- Comment
- Repost
- Share
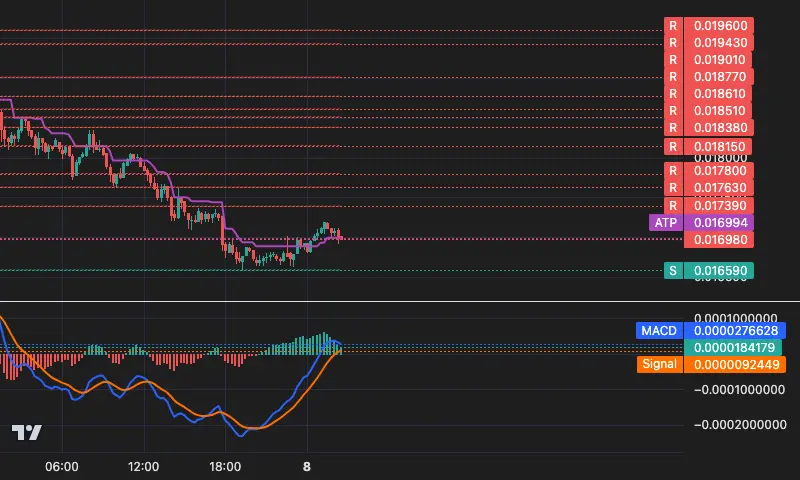
📊 $XAN 15-Minute Technical Overview
💰 Current Price: 0.01698 (-0.82%)
📈 Trend: Bullish momentum stagnating, beware of reversal | 6 K-lines have been formed
🎯 Tracking Line: 0.01699 ( Dynamic stop-loss reference )
Key Levels:
Support 0.01659
Resistance 0.01739 / 0.01763 / 0.01815
Strategy: The price has broken below the dynamic trend line, with a very small margin, but bullish momentum is significantly weakening. Conservative traders should consider reducing their positions, while aggressive traders should wait for the price to stabilize above 0.01699 before seeking opportunities.
Risk: If
XAN-7,85%
- Reward
- like
- Comment
- Repost
- Share
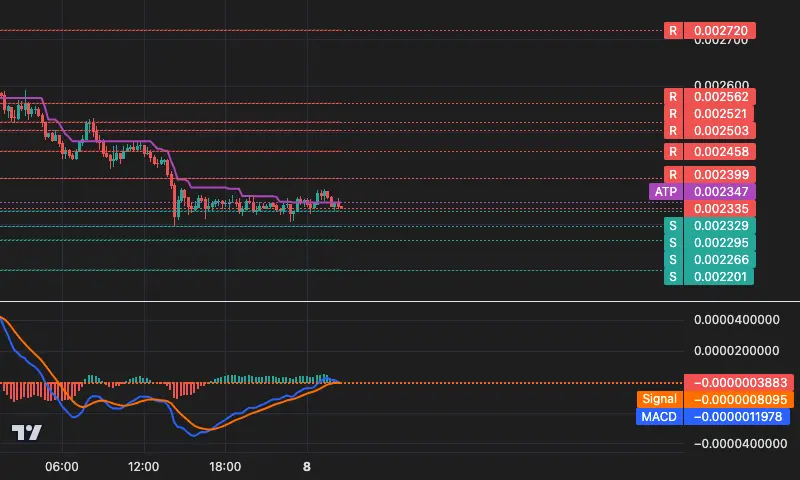
📊 PUMP 15-Minute Technical Overview
💰 Current Price: 0.002335 ( Downtrend since start -6.22% )
📈 Trend: Bearish trend continues | 87 candles have been formed
🎯 Tracking Line: 0.002347 ( Dynamic stop-loss reference )
Key Levels:
Support 0.002328 / 0.002295 / 0.002266
Resistance 0.002399 / 0.002458 / 0.002503
Strategy: Price stays just below the tracking line, bearish dominance. A rebound near 0.002399 can be seen as a shorting opportunity testing the downward trend line, with stop-loss set above the tracking line.
Risk: The gap between price and the tracking line is only 0.5
View Original💰 Current Price: 0.002335 ( Downtrend since start -6.22% )
📈 Trend: Bearish trend continues | 87 candles have been formed
🎯 Tracking Line: 0.002347 ( Dynamic stop-loss reference )
Key Levels:
Support 0.002328 / 0.002295 / 0.002266
Resistance 0.002399 / 0.002458 / 0.002503
Strategy: Price stays just below the tracking line, bearish dominance. A rebound near 0.002399 can be seen as a shorting opportunity testing the downward trend line, with stop-loss set above the tracking line.
Risk: The gap between price and the tracking line is only 0.5
- Reward
- like
- Comment
- Repost
- Share
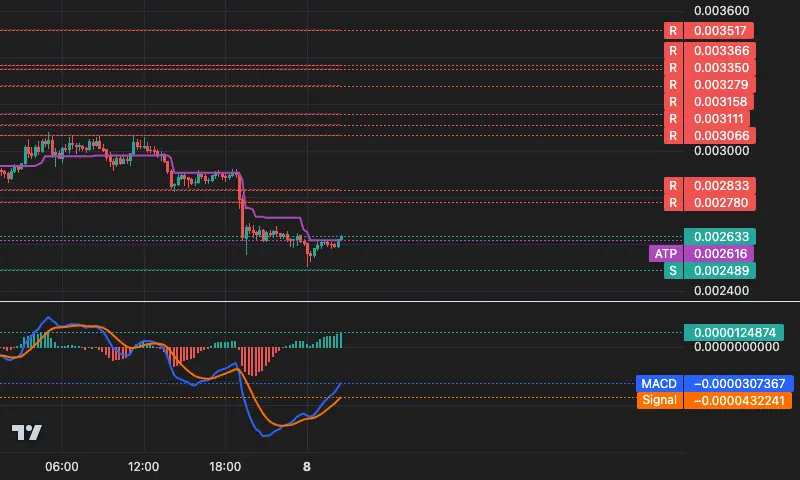
📊 PTB 15-Minute Technical Overview
💰 Current Price: 0.002633 ( -7.61%)
📈 Trend: Bearish trend continues | 50 candles have been formed
🎯 Tracking Line: 0.002616 ( Dynamic Stop-Loss Reference )
Key Levels:
Support 0.002489
Resistance 0.002780 / 0.002833 / 0.003066
Strategy: Price is weakly rebounding along the dynamic stop-loss line, but overall below the trend initiation point and MACD momentum has sharply decreased. Rebounds present shorting opportunities. If the price breaks through 0.002780 effectively, caution is advised.
Risk: If the price falls below 0.002616, a new downtrend may begi
PTB-12,74%
- Reward
- like
- Comment
- Repost
- Share
📊 B3 15m Technical Overview
💰 Current Price: 0.000998 (0.00%)
📈 Trend: **Bearish Trend Confirmed** | Just Started
🎯 Tracking Line: 0.001007 (Dynamic Resistance/Stop-Loss Reference)
Key Levels:
Support 0.000995 / 0.000985 / 0.000978
Resistance 0.001001 / 0.001018 / 0.001030
Strategy: If the price falls below the downward tracking line, bearish control is confirmed. Consider shorting on rallies, using the tracking line 0.001007 as a stop-loss line.
Risk: The MACD histogram's negative values are significantly amplified, indicating strong bearish momentum🔥. However, the price is only 0.3% aw
B3-9,15%
- Reward
- like
- Comment
- Repost
- Share
📊 PROM 15-Minute Technical Overview
💰 Current Price: 6.626 ( From Trend Start -18.38%)
📈 Trend: Bearish continuation | 212 K-lines have been formed
🎯 Tracking Line: 6.604 ( Dynamic Stop-Loss Reference )
Key Levels:
Support: No clear immediate support
Resistance: 8.045 / 8.138 / 8.291
Strategy: The trend remains bearish; any rebound near 7.0 is a high shorting opportunity. The current price is close to the trend line; a break below 6.604 can be seen as an acceleration signal for the downtrend. 🔥
Risk: The price is testing the descending trend line. If it strongly stabilizes above it and b
PROM-12,11%
- Reward
- like
- Comment
- Repost
- Share
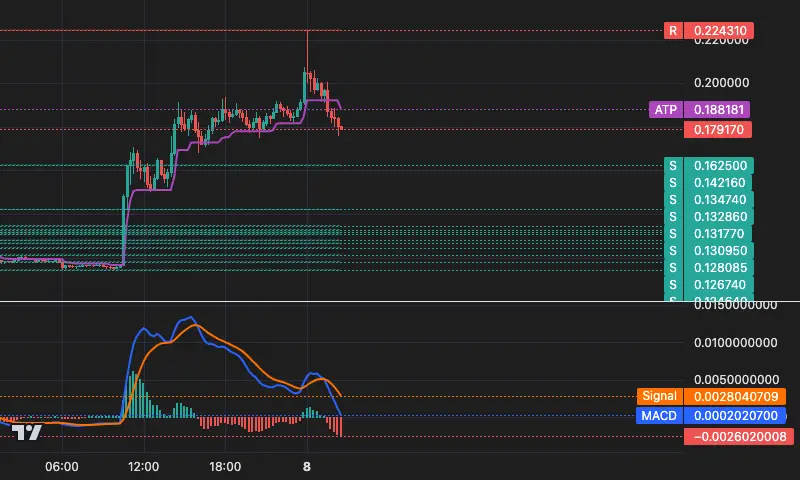
📊 ZKP 15m Technical Overview.
💰 Current Price: 0.17917 ( Sideways Consolidation ).
📈 Trend: Bearish trend just triggered🔥 | 0K candles have run.
🎯 Tracking Line: 0.18818 ( Dynamic Stop Loss Reference, significant resistance above ).
Key Levels:
Support 0.16250 / 0.14216 / 0.13474.
Resistance 0.22431.
Strategy: MACD death cross with a 95%+ plunge, current price close to the entry point. A rebound near the tracking line presents a high-risk shorting opportunity, targeting support levels below.
Risk: If a rapid surge breaks through the tracking line, it may interrupt the downtrend
ZKP57,05%
- Reward
- like
- Comment
- Repost
- Share
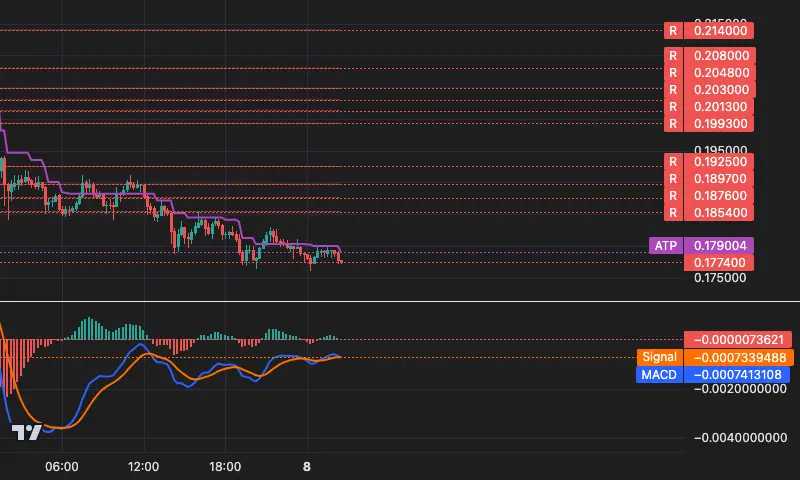
📊 XPL 15m Technical Overview
💰 Current Price: 0.1774 (-8.46%)
📈 Trend: Bearish trend accelerates | 100K candles in operation
🎯 Tracking Line: 0.1790 ( Dynamic stop-loss reference )
Key Levels:
Support 0.1762 / 0.1750 / 0.1700
Resistance 0.1854 / 0.1876 / 0.1897
Strategy: Strong short! Set stop-loss above 0.1800, target down to 0.1760🔥
Risk: If the price rebounds and breaks through 0.1790, beware of trend reversal danger ⚡
XPL-8,21%
- Reward
- like
- Comment
- Repost
- Share

- Reward
- like
- Comment
- Repost
- Share
10x Research's latest call: Forget macro narratives! What's next for BTC?🤔
Don't let the US stock calendar effect "trick" you; BTC has its own script.
The so-called optimistic macro indicators are often when market confidence is sky-high and signals are weakest.
The real answer isn't in liquidity, but in market structure, technological reset, and the deployment of genuine funds.
Remember, BTC rarely plays by "simple and easy-to-understand" logic🚀
BTC-2,25%

- Reward
- like
- Comment
- Repost
- Share
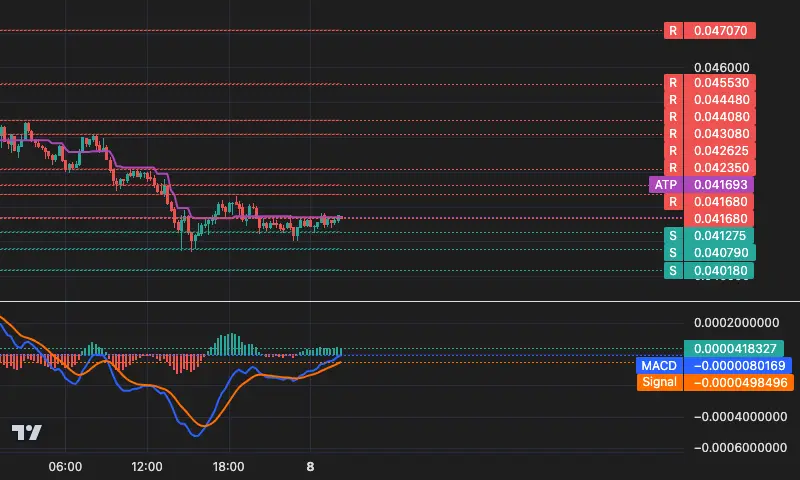
📊 AEVO 15m Technical Overview
💰 Current Price: 0.04168 (+0.77% vs. Launch Price)
📈 Trend: Bearish trend continues, 17K candles in operation | Beware of trend reversal!
🎯 Tracking Line: 0.04169 ( Latest dynamic resistance/stop-loss reference)
Key Levels:
Support 0.04128 / 0.04079 / 0.04018
Resistance 0.04168 / 0.04235 / 0.04262
Strategy: The price is testing the downward trendline, which is a critical point of strength and weakness. If the rebound does not break 0.04169, it can be seen as a high-altitude selling opportunity. A strong breakthrough would put the bearish structure to the test
AEVO-6,35%
- Reward
- like
- Comment
- Repost
- Share
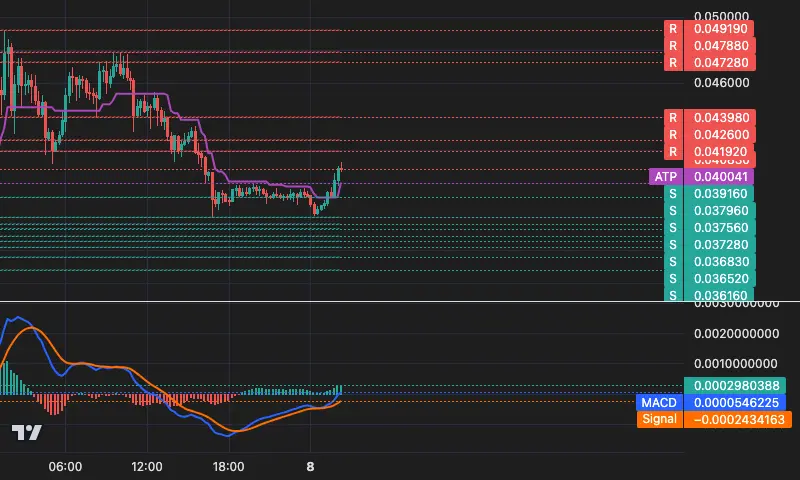
📊 FHE 15m Technical Overview
💰 Current Price: 0.04083 (-0.17%😕)
📈 Trend: Suspected trend reversal❓ | Just started 2 K-lines
🎯 Tracking Line: 0.04004 (Break below warrants caution)
Key Levels:
Support 0.03916 / 0.03796 / 0.03756
Resistance 0.04192 / 0.04260 / 0.04398
Strategy: Going long at high levels carries great risk! The current price has fallen below the upward initiation point, and MACD momentum is rapidly diminishing📉, more like a false breakout. Aggressive traders may consider a light short position around 0.0419, with strict stop-loss above 0.0426.
Risk: If the price cannot qui
FHE-11,92%
- Reward
- like
- Comment
- Repost
- Share
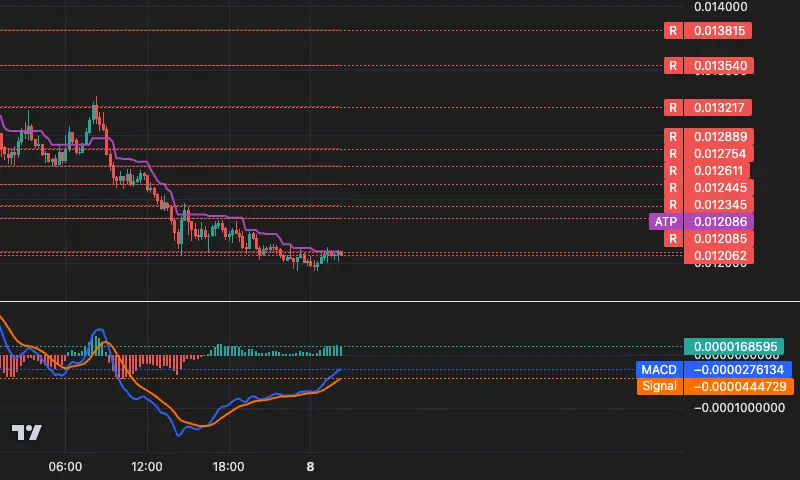
📊 PENGU 15m Technical Overview
💰 Current Price: 0.012062 (-4.81%)
📈 Trend: Bearish trend continues | 67 K-lines have been formed
🎯 Tracking Line: 0.012086 ( Dynamic stop-loss reference )
Key Levels:
Support 0.012062 / —— / ——
Resistance 0.012085 / 0.012345 / 0.012445
Strategy: The price is pressed below the dynamic resistance (tracking line), indicating a clear bearish pattern. Any rebound to the 0.012085-0.012086 area is a potential opportunity to add to short positions/enter trades.
Risk: Although MACD is below zero, the histogram narrows, indicating a short-term risk of a rebound testin
PENGU-7,1%
- Reward
- like
- Comment
- Repost
- Share
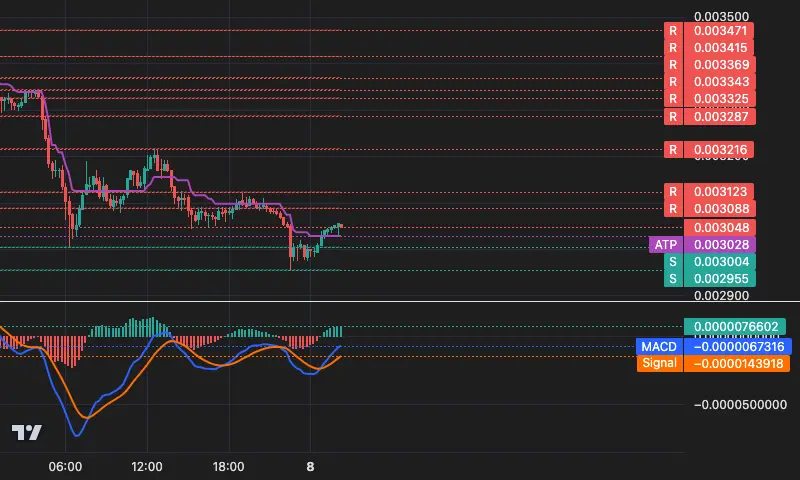
📊 COMMON 15-Minute Technical Overview
💰 Current Price: 0.003048 (+0.00%)
📈 Trend: Bullish trend continues | Just started, 1 K-line completed
🎯 Tracking Line: 0.003028 (Dynamic Stop-Loss Reference)
Key Levels:
Support 0.003004 / 0.002955
Resistance 0.003088 / 0.003123 / 0.003216
Strategy: Price breaks above the trend line, consider a small long position, place stop-loss below the tracking line at 0.003028. The first resistance above is close at 0.003088, watch for profit protection.
Risk: MACD histogram momentum has decreased by 75% over the last 12 periods! 📉 Signs of weakening bullish m
COMMON-10,22%
- Reward
- like
- Comment
- Repost
- Share
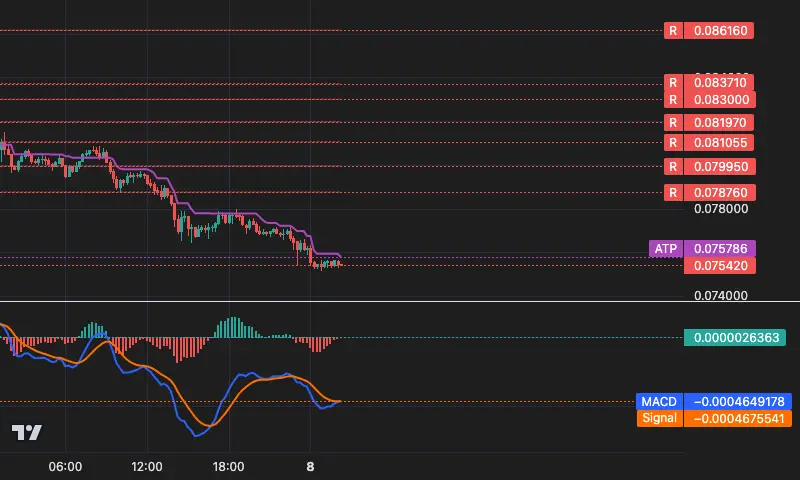
📊 TNSR 15-Minute Technical Overview
💰 Current Price: 0.07542 ( Down -5.52% from Trend Start )
📈 Trend: Bearish trend stagnating, beware of accelerated decline! | 96 K-lines have been run
🎯 Tracking Line: 0.07579 ( Dynamic stop-loss reference below )
Key Levels:
Support 0.07520 ( Previous Low ) / -
Resistance 0.07876 / 0.07995 / 0.08105
Strategy: Price stays just below the trend line, MACD shows bullish momentum 🟢, but has not yet reclaimed the trend line, so the outlook remains bearish. Aggressive traders may observe whether a rebound to around 0.07876 occurs before shorting.
Risk: If the
TNSR-10,92%
- Reward
- like
- Comment
- Repost
- Share
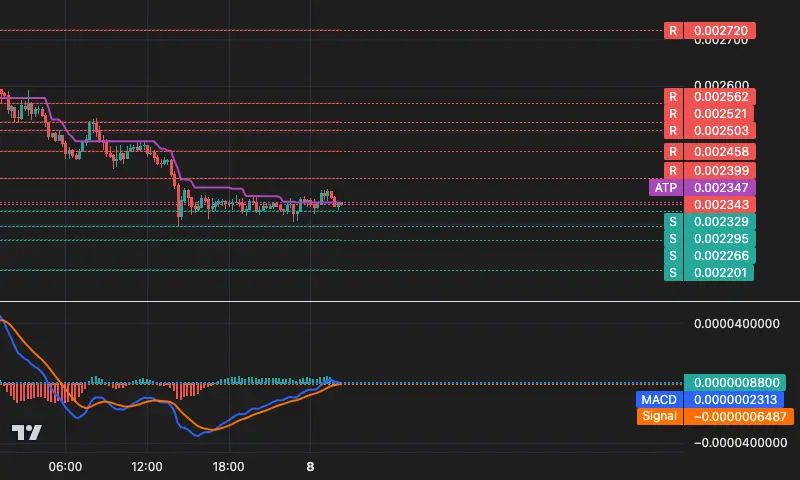
📊 PUMP 15m Technical Overview
💰 Current Price: 0.002343 (-5.90%)
📈 Trend: Bearish trend continues, but extremely tight | 86 K-line bars have been run
🎯 Tracking Line: 0.002347 (Dynamic stop-loss reference, slightly broken!)
Key Levels:
Support 0.002328 / 0.002295 / 0.002266
Resistance 0.002399 / 0.002458 / 0.002503
Strategy: Price closely follows the downward trend line, volatility narrows⚠️. Aggressive traders can lightly bet on a rebound, but must set 0.002328 as a strict stop-loss. Conservative traders continue to be bearish; a valid breakdown below 0.002328 will trigger a new round of
PUMP-11,22%
- Reward
- like
- Comment
- Repost
- Share
📊 ALCH 15m Technical Overview
💰 Current Price: 0.11753 (-2.56% vs Starting Point )
📈 Trend: Bearish trend continues | 68 K-line bars have been formed
🎯 Tracking Line: 0.11765 ( Dynamic Stop-Loss Reference )
Key Levels:
Support 0.11602 / 0.11400 / 0.10699
Resistance 0.11855 / 0.12100 / 0.12406
Strategy: The price has broken below the dynamic trend line, indicating a bearish dominance. If the rebound cannot hold above 0.11765, the downward trend may accelerate, targeting lower support levels. ⚠️ Currently, the price is closely following the trend line, with increased volatility.
Risk: The pr
ALCH-7,39%

- Reward
- like
- Comment
- Repost
- Share
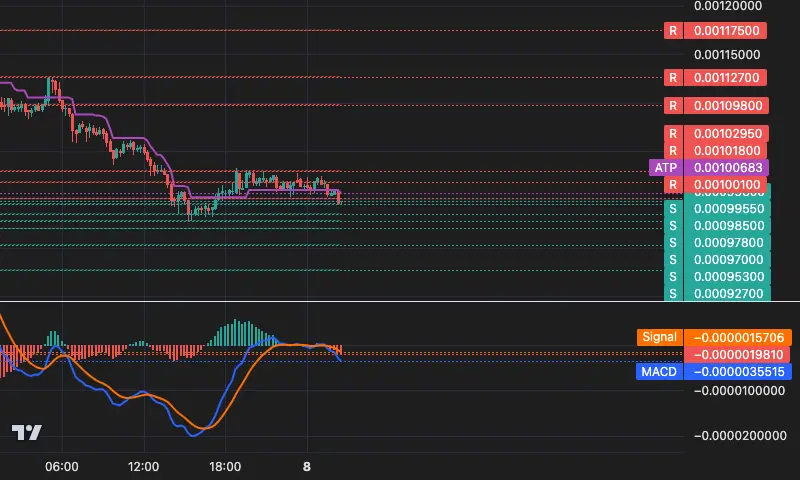
📊 B3 15-Minute Technical Overview
💰 Current Price: 0.001008 ( Compared to Trend Start -1.95%)
📈 Trend: Beware of Reversal ⚠️ | 26 Candlesticks Have Been Formed
🎯 Tracking Line: 0.001010 ( Dynamic Stop-Loss Reference Price Has Been Broken! )
Key Levels:
Support 0.001001 / 0.000996 / 0.000985
Resistance 0.001018 / 0.001029 / 0.001098
Strategy: Price has broken below the key tracking line! Bulls should immediately review their positions, consider reducing holdings or tightening stop-losses. Those not yet entered should wait and see if the price stabilizes above 0.001010 or tests support level
B3-9,15%

- Reward
- like
- Comment
- Repost
- Share
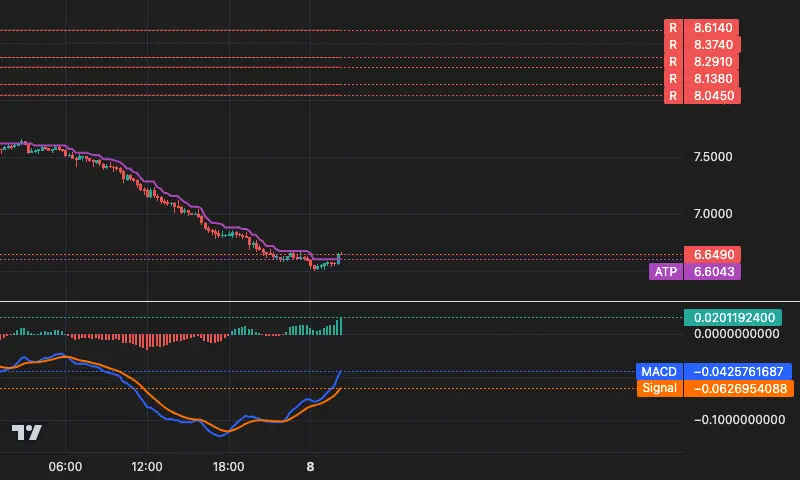
📊 PROM 15-Minute Technical Overview
💰 Current Price: 6.649 ( Down -18.10% from Trend Start )
📈 Trend: Bearish continuation | 211 K-lines have been formed
🎯 Tracking Line: 6.604 ( Dynamic Stop-Loss Reference )
Key Levels:
Support ( No clear support below )
Resistance 8.045 / 8.138 / 8.291
Strategy: The bearish pattern is complete; a rebound to resistance levels presents a potential adding opportunity. Short-term traders should be cautious if the price stabilizes above the tracking line.
Risk: The price is testing the downward trendline. A volume breakout above the 6.68 area could signal the
PROM-12,11%
- Reward
- like
- Comment
- Repost
- Share