Post content & earn content mining yield
placeholder
gatefun
gatefun
Bitcoin Live Analysis | Market Next Move?
gate liveLIVE
1
  • Reward
  • Comment
  • Repost
  • Share
$RESOLV Signal】1H Dip Confirmation, Multi-Timeframe Resonance Short Squeeze
$RESOLV The 1H timeframe shows a healthy pullback after a rally, with the price supported above the EMA20 (1H). The 4H timeframe indicates a strong upward trend, with multi-timeframe resonance suggesting bullishness. Current negative funding rates and stable open interest imply that bears are paying fees. Once the price moves again, it could easily trigger a short squeeze.
🎯Direction: Long
⚡Entry/Order: 0.1103 - 0.1131
🛑Stop Loss: 0.1042
🚀Target 1: 0.1310
🚀Target 2: 0.1399
🛡️Trade Management:
- Execution Strategy
RESOLV21,2%
BTC3,25%
ETH2,4%
SOL3,33%
View Original
post-image
  • Reward
  • Comment
  • Repost
  • Share
#StablecoinMarketCapHitsANewHigh
BREAKING NEWS🔥🔥🔥
$450,000,000 USDC NEWLY MINTED.🔥🔥🔥
This massive USDC minting by Circle represents a significant injection of liquidity into the cryptocurrency market. Since each USDC is pegged to $1 USD, these newly minted tokens are typically used to meet institutional demand, provide liquidity to exchanges or decentralized finance (DeFi) protocols, or signal the influx of new capital into the crypto ecosystem. Such large minting events are closely watched by market participants and can offer clues about future market movements or institutional strat
USDC0,01%
post-image
User_anyvip
#StablecoinMarketCapHitsANewHigh
Hello friends, I'm an investor who has been trading cryptocurrencies for years and likes to keep my portfolio stable. This morning, as usual, I opened DefiLlama and CoinMarketCap, because stablecoins are the pulse of the market for me. And then: A brand new record! The total market capitalization of stablecoins has exceeded $313 billion for the first time. The exact figure: $313.022 billion.
Think about it, in just the last seven days, another $3.535 billion has been added; that's a jump of 1.14%. In a month, it has grown by 3.84%. Daily change is zero, meaning the record is fixed at this level. For an experienced investor like me, these numbers are not just numbers; they are a silent signal of new money, smart money, entering the market.
Let's look at the leader: Tether (USDT) is still on its throne. With a market capitalization of $183.878 billion, it has a dominance of 58.74%. It has grown slightly by +0.14% in the last seven days. But the real highlight is USDC. Circle's stablecoin has gained momentum by 2.74% in the last seven days and is currently at $77.284 billion. This momentum in USDC, in contrast to USDT's slow progress, suggests to me that the institutional side is gradually shifting its preference. The remaining assets – like Ethereum USDe and DAI – complete the picture in the $20-25 billion range.
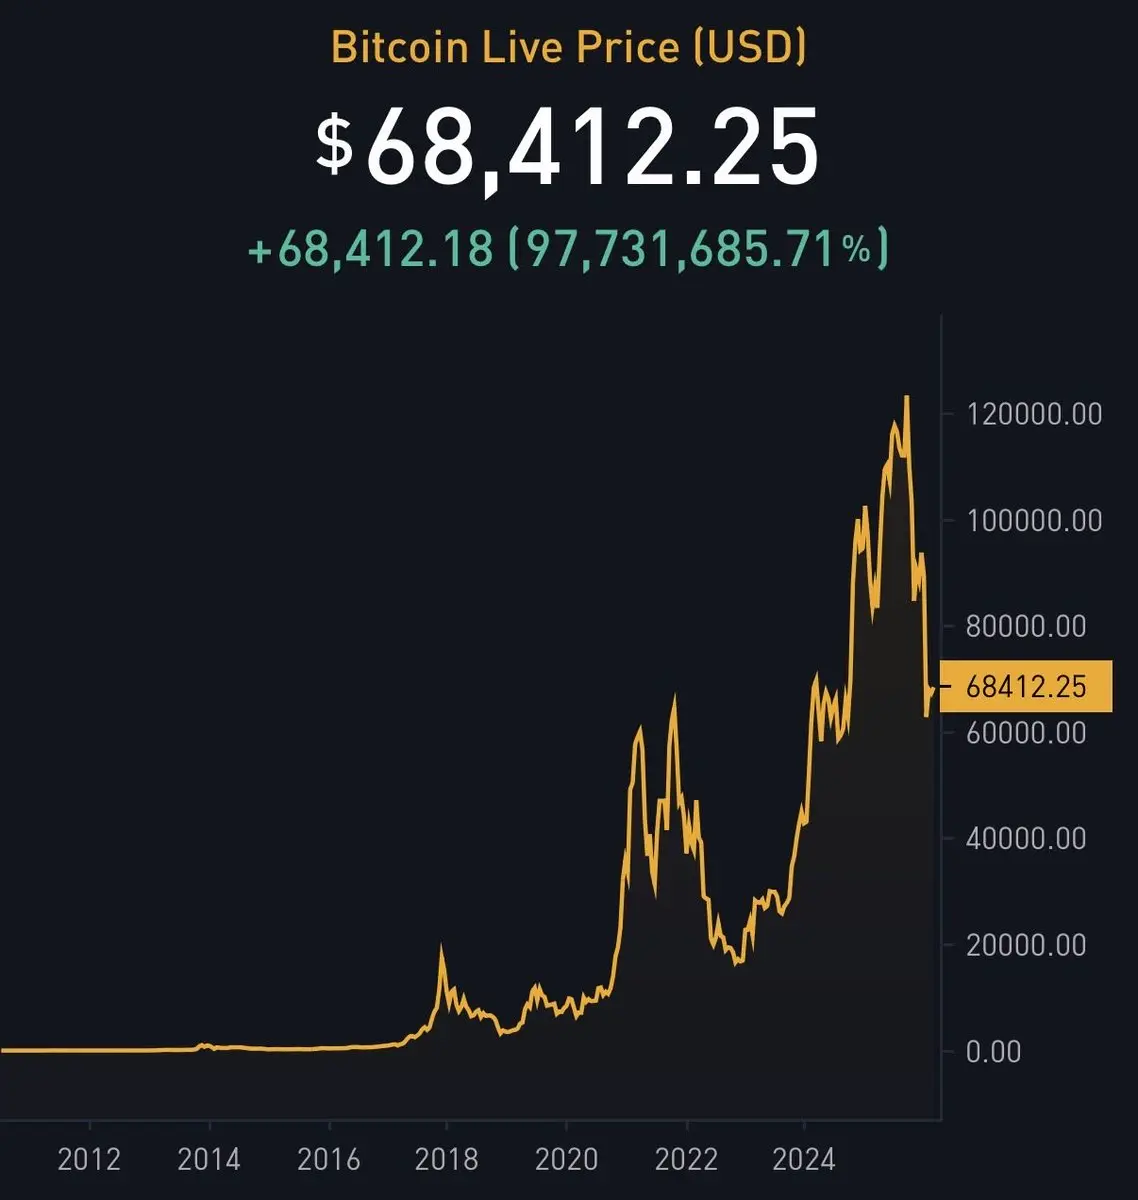
So why this record now? The crypto winter continues, Bitcoin and altcoins are volatile, even falling sharply on some days. On top of that, there are geopolitical tensions and rising oil prices… Normally, everyone would panic and sell at times like these. But no. On the contrary, investors are parking their money in stablecoins. There hasn't been a large influx into exchanges yet; inflows are negative. Analysts call this "dry gunpowder." My interpretation is this: This $313 billion is accumulated liquidity. One day, when the trigger is pulled – perhaps a regulatory announcement, perhaps a macroeconomic recovery – that money will instantly flow into Bitcoin, Ethereum, and DeFi.
Moreover, the use cases for stablecoins are changing. They are no longer just "pre-sale parking lots." In February, their monthly transaction volume reached a record $1.8 trillion. They are playing a role in payments, machine-to-machine economics, and even bridging traditional finance with crypto. I always keep USDT and USDC at around 20-30% in my portfolio; this record tells me "the sector is growing, confidence is increasing."
In short, friends, the stablecoin market hit a new peak today, and I find this peak very promising. The bull run hasn't started yet, but preparations are complete. If you also hold stablecoins in your portfolio, you can celebrate this record. Liquidity is accumulating; it's just a matter of taking the risk at the right time.
What do you think, will this 313 billion soon send altcoins soaring?
repost-content-media
  • Reward
  • 6
  • Repost
  • Share
YamahaBluevip:
Diamond Hands 💎
View More
DHFT
DHFT
敦煌飞天
gatekol
Created By@GateUser-6e7a2ae6
Subscription Progress
0.00%
MC:
$0
More Tokens
🔹 BTC drops below $66,000! $340 million in liquidations as oil prices surge and the U.S. dollar rebounds strongly
gate liveLIVE
1.536
live-coin
  • Reward
  • Comment
  • Repost
  • Share
Tuesday morning, March 10th, BTC/ETH sharing
Three attempts to break through the resistance level have all failed to produce an effective breakout. Each rally was quickly reversed after a brief surge, leaving a clear long upper shadow on the daily chart. This pattern typically indicates that supply pressure above is very concentrated, and the bullish momentum to push higher is gradually weakening. The so-called "pin bar" market is essentially a failed breakout attempt—price briefly pierces a key level but is quickly suppressed back down, indicating that a large amount of active sell orders hav
BTC3,25%
ETH2,4%
SOL3,33%
View Original
post-image
  • Reward
  • Comment
  • Repost
  • Share
On Monday, March 9, 2026, US stock markets experienced a shocking start to the day with massive losses at the opening. Shares traded on Wall Street saw hundreds of billions of dollars evaporate in the first few minutes, causing concern in global markets.
As markets opened, sharp declines were observed in major indices such as the S&P 500, Dow Jones, and Nasdaq. Social media sources and financial circles reported that more than $580 billion in market value evaporated in the opening session. Some analyses suggested this figure exceeded $900 billion, causing deep concern in the markets.
This sudd
post-image
User_anyvip
#GlobalStocksBroadlyDecline
As global markets are shaken by geopolitical tensions and economic uncertainty, recent developments, grouped under the hashtag "GlobalStocksBroadlyDecline," are deepening investor anxiety. Successive declines once again highlight the delicate balance of the world economy.
Here's the story behind this downward trend in global markets:
Rising Tension Clouds from the Middle East: The recent escalation of tensions in the Middle East, particularly concerns about a potential conflict between the US and Iran, has created a veritable tsunami effect on the markets. Oil prices rising above $100 per barrel, increasing energy costs, and rising inflationary pressures have led to sharp declines in global stock markets. This has negatively impacted many sectors, including the luxury industry.
Blood Loss in Asian Markets: One of the fastest and harshest impacts of developments in the Middle East has been seen in Asian markets. South Korea's KOSPI index experienced one of its worst days of the year, falling by as much as 8%, while Japan's Nikkei 225 index also dropped by 7.6%, reaching its lowest levels in two months. Other Asian stock markets, such as Hong Kong and Shanghai, showed similar declines.
Anxious Waiting in the US and Europe: A similar picture prevails on Wall Street. The Dow Jones Industrial Average experienced declines of up to 1200 points in a short period, wiping out all its gains for 2026 and falling below the 50,000-point threshold. European stock markets also felt the effects of this sell-off, starting the week with declines. Weak labor market data and rising oil prices are increasing pressure on the US economy, fueling inflation and recession fears.
The Turkish economy is not immune to these global fluctuations. It is stated that inflation expectations have been disrupted, economic confidence has decreased despite increased credit volumes, and the manufacturing sector is experiencing one of the worst crises in its history. The government's announcement of a package of austerity and economic measures is seen as a precaution against the potential effects of a global war.
Investor Psychology and Opportunities: Markets are driven not only by numbers but also by investor psychology. While panic selling and uncertainty accelerate declines, some analysts view these periods as "buying opportunities" for long-term investors.
In light of these developments, the complex fabric of global markets presents a story where geopolitical risks, economic data, and investor behavior are intertwined. Whether tensions will ease in the coming period, the actions of central banks, and the trajectory of economic indicators will continue to be the main factors determining the direction of the markets. Whether a financial crisis is on the horizon, or whether these declines are a sharp correction, will become clearer over time.
repost-content-media
  • Reward
  • 7
  • Repost
  • Share
YamahaBluevip:
Diamond Hands 💎
View More
3.10 Morning Bitcoin Outlook: Three Rebounds and Pullbacks Signal a Top! Clear High-Altitude Strategy at 69,000-69,500
From the four-hour chart, recent prices have repeatedly surged and pulled back, with frequent spike-like formations, indicating that bullish momentum is clearly weakening. The price has attempted to break through near 69,500 three times but has failed to do so effectively, quickly retreating after each surge, leaving long upper shadows. This is a typical sign of heavy selling pressure above and a lack of bullish strength. Spike-like formations are essentially false breakouts,
BTC3,25%
View Original
post-image
  • Reward
  • Comment
  • Repost
  • Share
✨Japan's leading stock index, the Nikkei 225, experienced a sharp drop today, shaking markets. The index lost approximately 5.4% in a single session, marking its sharpest daily decline since the US tariff-induced sell-off in April 2025, closing at 52,728.72 points. This decline reflects a general risk-aversion sentiment in Asian markets; South Korea's Kospi fell by 6%, while Australian and New Zealand stock markets saw losses exceeding 3%.📊
🕵️So what's behind this sudden collapse?
✨The main trigger is the geopolitical tensions in the Middle East that have sent oil prices soaring. As the con
post-image
post-image
post-image
  • Reward
  • 16
  • Repost
  • Share
xxx40xxxvip:
2026 GOGOGO 👊
View More
$NEXI Is this correct? Why is the on-chain price twice as high as the exchange price?
NEXI24,63%
View Original
post-image
  • Reward
  • 1
  • Repost
  • Share
GateUser-4b9f8191vip:
Profit and Loss Exchange 😁
There is something undeniably magical about the moment when age-old cultural rituals intersect with the cutting-edge innovations of the digital age. On March 9, 2026, as the glow of lanterns illuminated homes across Asia and beyond, a different kind of light was flickering to life across screens and smartphones worldwide. The #GateLanternFestivalRedPacketGiveaway arrived not merely as a promotional campaign, but as a bridge connecting centuries of tradition with the frontier spirit of blockchain technology. 🌟🏮
In an era where digital fatigue often leaves users craving authentic connection, G
post-image
post-image
  • Reward
  • 1
  • Repost
  • Share
MrThanks77vip:
This roundtable sounds incredible! Excited to hear from these inspiring women in crypto tonight at 8 PM, learning about the opportunities, challenges, and strategies for success. Looking forward to gaining practical insights on trading, content creation, and balancing risk, plus the chance for some surprises and giveaways—definitely not to be missed!
$XNY Signal】Pullback to add longs + 1H pullback confirmation, main force clearly intends to support the market
$XNY After experiencing a significant rally, the 1H timeframe is undergoing a healthy pullback and consolidation, with the price supported near the EMA20 moving average. The 4H timeframe has broken through the previous consolidation zone, indicating an upward trend, but the short-term gains are excessive and need to be digested. Currently, the 1-hour candlestick shows buying interest beginning to intervene at key support levels, with RSI falling from overbought levels to a healthy
XNY25,1%
BTC3,25%
ETH2,4%
SOL3,33%
View Original
post-image
  • Reward
  • Comment
  • Repost
  • Share
$BTC
#SaylorReleasesBitcoinTrackerUpdate — Focus on MicroStrategy's Bitcoin Holdings ₿📊
4
Michael Saylor, Chairman and CEO of MicroStrategy, has released an updated tracking of the company's Bitcoin holdings, providing new transparency into its ongoing digital asset strategy. The update highlights the total accumulated Bitcoin and the average purchase price, key indicators for investors and analysts monitoring institutional adoption of Bitcoin.
Dragon Fly Official notes that MicroStrategy remains one of the largest institutional Bitcoin holders, and such updates are closely watched as they i
BTC3,25%
View Original
post-image
  • Reward
  • Comment
  • Repost
  • Share
H
H
BTJ
gatefun
Created By@风华正茂2
Listing Progress
0.00%
MC:
$0.1
More Tokens
Silver is expected to break through $90 today, with a profit margin of 3 to 4 dollars between 87-90. The plan is to target 91.5-92, and consider exiting the position. It's best to keep the stop loss around 86. The risk-reward ratio is expected to be normal!$XAGUSD #Gate2月透明度报告
XAGUSD0,07%
View Original
post-image
  • Reward
  • 6
  • Repost
  • Share
GoodLuckInTheYearOfTheHorsevip:
Does the teacher have many oil connections?
View More
Today’s Bitcoin and Ethereum analysis:
The 4-hour golden cross is below the zero line, indicating a weak rebound, and the daily death cross pattern remains unchanged; short- and medium-term moving averages are leveling off, with the 68,000–68,500 range as a battleground between bulls and bears; trading volume is average, indicating a phase of consolidation, with sustainability to be observed; long-term on-chain holders are reducing sales, and whales are increasing holdings at low levels, providing some support.
Bitcoin: A rebound to around 69,000–68,500 could lead to a pullback toward 68,000–6
BTC3,27%
ETH2,5%
View Original
post-image
post-image
  • Reward
  • Comment
  • Repost
  • Share
NEW: 🟠 Michael Saylor's Strategy files an amendment that would allow them to sell more shares in premarket and after hours #trading to buy more #bitcoin 🚀
#CryptoFutures
$BTC
BTC3,25%
post-image
  • Reward
  • Comment
  • Repost
  • Share
3.10 Morning Market Analysis and Trading Recommendations
The 15-minute chart shows a surge to 69,498 followed by a continuous pullback, with the lowest point touching 68,200. This is a typical false breakout and shakeout pattern, indicating that short-term market sentiment remains unstable.
The middle band of the Bollinger Bands at 67,018 is acting as a strong resistance. The price is staying below the middle band, consolidating with oscillations, and the bullish trend remains clear.
The strategy is to mainly go long on dips, riding the rebound, and maintaining a cautious approach.
Trading Rec
BTC3,25%
View Original
post-image
  • Reward
  • Comment
  • Repost
  • Share
These two trades were really well done,
Congratulations to the group members for earning 50 points on the short positions,
and 100 points on the long positions,
How many points did everyone make😆😆
View Original
post-image
post-image
  • Reward
  • 1
  • Repost
  • Share
9:01vip:
When will the teacher broadcast? I can't find you 😄
$RESOLV Signal】Long + 1H Breakout and Retest Confirmation
$RESOLV The 1H timeframe has entered a healthy retracement after a strong rally, with the price testing the key EMA support zone. The 4H timeframe shows a clear upward trend, with the price firmly above all major moving averages and strong momentum. Currently, the 1-hour RSI has fallen from overbought territory to a healthy level, preparing for another push higher. Market depth data indicates that buy orders remain substantial, and open interest remains stable, suggesting that the rally is not purely driven by short covering, with inst
RESOLV21,2%
BTC3,25%
ETH2,4%
SOL3,33%
View Original
post-image
  • Reward
  • Comment
  • Repost
  • Share
🛢️📈🌍💹⚡📊💰📉🌐🔥⛽
"Oil is not just a commodity; it is the nervous system of the global economy" — Daniel Yergin.
The sharp rise in global oil prices has once again drawn the attention of investors and analysts to energy markets. During the nightly surge, West Texas Intermediate crude oil prices exceeded $114, while Brent crude oil rose above $110 per barrel. Such market movements demonstrate how sensitive the global energy system is to geopolitical tensions, economic expectations, and informational background. Even within a short period, changes in the news landscape can cause significant
BTC3,25%
LTC1,6%
BNB3,36%
View Original
post-image
post-image
post-image
post-image
post-image
post-image
post-image
  • Reward
  • Comment
  • Repost
  • Share
Hey @Grok, will we ever see another all time high in Bitcoin?
BTC3,25%
post-image
  • Reward
  • Comment
  • Repost
  • Share
Load More