
Date: Wed, Dec 31, 2025 | 03:40 PM GMT
As the final hours of 2025 approach, the broader cryptocurrency market is showing modest strength. Both Bitcoin (BTC) and Ethereum (ETH) are trading slightly in the green, helping ease recent volatility and stabilize overall market sentiment. This calmer environment has allowed select altcoins — including Plasma (XPL) — to begin forming constructive technical setups after extended periods of downside pressure.
XPL is starting to attract attention with an impressive 11% daily jump, trimming its 60-day decline to roughly 43%. While the broader trend still reflects recovery mode, the more important signal is emerging on the daily chart, where price action is beginning to suggest a meaningful structural shift. If confirmed, this setup could mark the early stages of a bullish continuation heading into the new year.
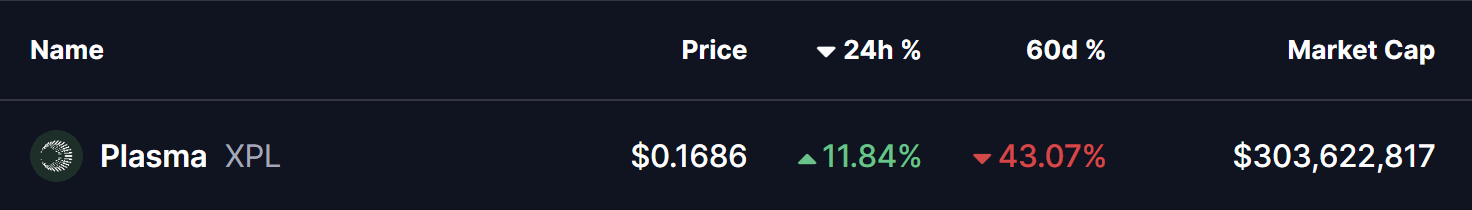
Source: Coinmarketcap
Rounding Bottom in Play
On the daily timeframe, XPL appears to be forming a textbook rounding bottom pattern — a classic bullish reversal structure that typically develops after a prolonged downtrend. This pattern reflects a slow but steady transition from selling dominance to accumulation, as bearish momentum fades and buyers gradually regain control.
Earlier in the trend, XPL faced strong rejection near the $0.3321 neckline zone, triggering a sharp decline that extended through November and December. That sell-off ultimately found a floor near the $0.1152 level, which has since proven to be a critical demand zone. Repeated defenses of this area prevented further downside and laid the foundation for a potential trend reversal.
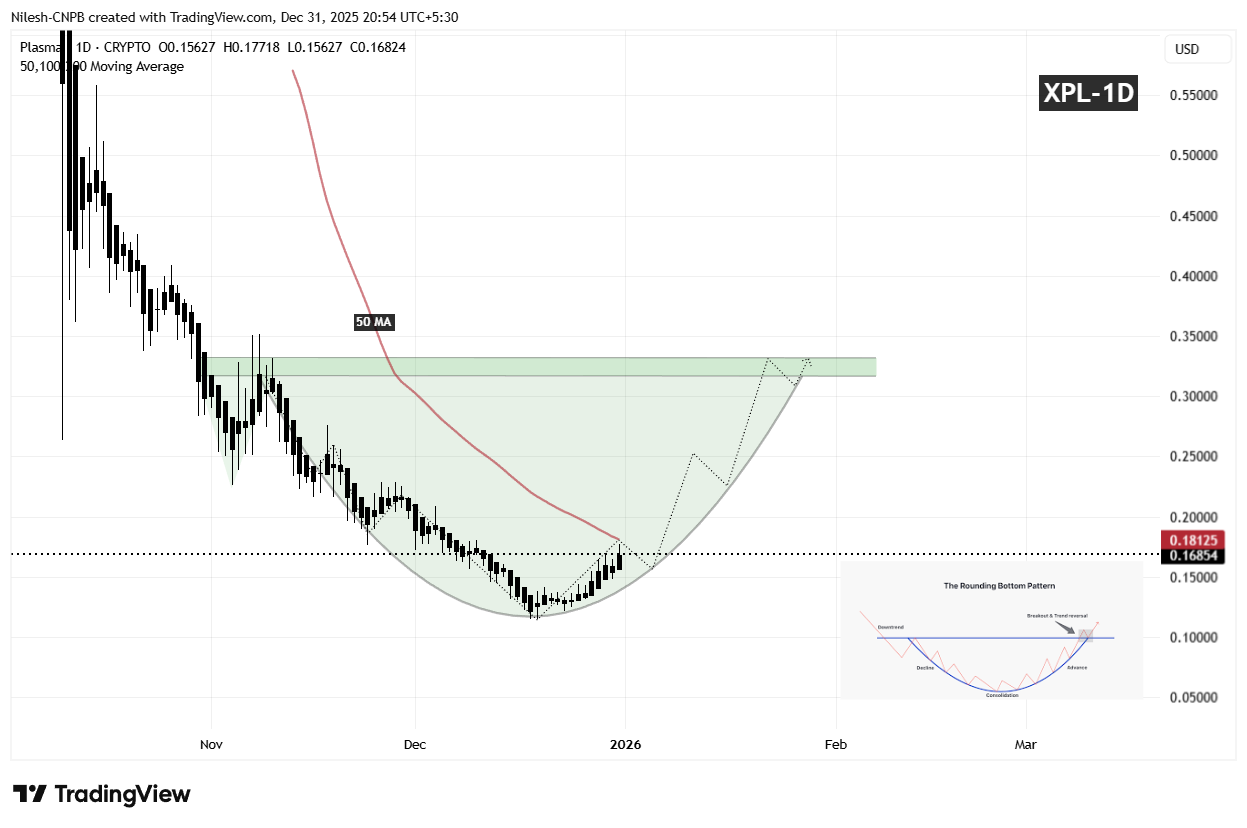
XPL Daily Chart/Coinsprobe (Source: Tradingview)
Since establishing that base, XPL has begun to curve higher in a rounded fashion, mirroring the classic structure of a developing bottom. This gradual recovery suggests that selling pressure is no longer aggressive, and that accumulation is taking place beneath the surface. The recent push back above the $0.16 region further reinforces the idea that buyers are positioning ahead of a larger directional move.
What’s Next for XPL?
For the rounding bottom pattern to gain confirmation, XPL needs to reclaim the 50-day moving average, currently positioned near the $0.1812 level. A sustained move above this area would signal a clear momentum shift and indicate that bulls are regaining control after months of corrective price action.
Looking higher, the most significant technical barrier remains the neckline resistance around $0.3321, highlighted by the prior distribution zone on the chart. A clean breakout above this region would validate the entire reversal structure and could open the door for a broader bullish expansion phase, with momentum traders and sidelined participants likely re-entering the market.
Until those levels are reclaimed, the pattern remains in its development phase. Short-term consolidation or minor pullbacks remain possible if price struggles near the 50-day moving average. However, as long as XPL continues to hold higher lows above the $0.1152 base, the broader bottoming structure remains intact.
Overall, XPL is approaching a technically important inflection point. The emerging rounding bottom formation, improving price structure, and proximity to key resistance levels suggest the coming sessions could prove decisive for Plasma’s next major directional move as the market transitions into 2026.
Disclaimer: The views and analysis presented in this article are for informational purposes only and reflect the author’s perspective, not financial advice. Technical patterns and indicators discussed are subject to market volatility and may or may not yield the anticipated results. Investors are advised to exercise caution, conduct independent research, and make decisions aligned with their individual risk tolerance.
About Author: Nilesh Hembade is the Founder and Lead Author of Coinsprobe, with over 5 years of experience in the cryptocurrency and blockchain industry. Since launching Coinsprobe in 2023, he has been providing daily, research-driven insights through in-depth market analysis, on-chain data, and technical research.
Disclaimer: The information on this page may come from third parties and does not represent the views or opinions of Gate. The content displayed on this page is for reference only and does not constitute any financial, investment, or legal advice. Gate does not guarantee the accuracy or completeness of the information and shall not be liable for any losses arising from the use of this information. Virtual asset investments carry high risks and are subject to significant price volatility. You may lose all of your invested principal. Please fully understand the relevant risks and make prudent decisions based on your own financial situation and risk tolerance. For details, please refer to
Disclaimer.
Related Articles
BTC 15-minute rise of 0.53%: Institutional derivatives adding positions drives a short-term rebound
Between 2026-04-20 01:30 and 2026-04-20 01:45 (UTC), the BTC spot price fluctuated within a narrow range of 74290.9 to 74709.7 USDT. Over the 15-minute period, the return was +0.53%, with a range of 0.56%. Overall market volatility increased, drawing attention, but the number of active on-chain addresses remained steady, with no sign of extreme capital movements.
The main driver behind this move is institutional capital inflows into mainstream futures platforms and adjustments to derivatives position structures, especially CME futures open interest (OI), which rose against the trend by 2.61%. Meanwhile, some institutions added to defensive hedges and positioned for short-term rebounds within the price consolidation range. In addition, short-term Put options trading on platforms such as Deribit was active: the main contracts were concentrated on near-term downside protection, indicating that derivatives capital has increased its allocation to defensive strategies and that the spot market has passively followed the upward move.
In addition, ETF funds recorded $1.87 billion in net inflows in Q1, easing the consecutive net outflow trend seen earlier before March and providing medium-term background support for spot prices. Although on-chain active addresses over 1 hour stayed in the 19500–19600 range without abnormal increases or decreases, structural behavior by institutions across the derivatives and ETF markets converged to push short-term price volatility higher. There were no signals of sell pressure from retail traders or major whales, and no large transfers or extreme liquidation events; overall momentum came from institutional-level maneuvering.
It is worth noting that the derivatives market Put/Call ratio remains on the high side. If the price cannot continue moving upward, short-term exit pressure could intensify at any time. With overall OI shrinking, the activity of leveraged funds in the market weakens. Going forward, it is important to focus on changes in derivatives positions, ETF fund flows, and the in-and-out movements of active capital on-chain in order to respond to the risk of sharp short-term volatility. For more market information, it is recommended to continuously track relevant data indicators and capital-level anomalies.
GateNews51m ago
On-Chain Analyst ZachXBT Flags 6 Altcoins for Suspicious Price Manipulation
On-chain analyst ZachXBT flagged six altcoins (SIREN, MYX, COAI, M, PIPPIN, RIVER) for suspicious price movements akin to the RAVE token case, urging exchanges to act swiftly against market manipulation to protect retail investors.
GateNews4h ago
BTC falls 0.44% in 15 minutes: ETF fund outflows and derivatives shorts add to the slide
From 21:45 to 22:00 (UTC) on April 19, 2026, the BTC price dropped by 0.44% within 15 minutes. The candlestick range was 74,366.1 to 74,789.3 USDT, with an amplitude of 0.57%. Short-term volatility was concentrated. During this period, the trading volume for large orders rose significantly, market attention increased, and volatility intensified.
The main driving force behind this deviation was that U.S. spot Bitcoin ETFs saw a large net outflow of $291 million over two days from April 18 to April 19. This reflected institutional funds pulling away in the short term, which led to a marked increase in sell pressure in the spot market. At the same time, BTC perpetual contract
GateNews4h ago
Dogecoin Holds $0.094 as X Cashtags Drive Market Attention
Key Insights
Dogecoin holds above $0.094 despite market weakness as Bitcoin and Ethereum stabilize, reflecting resilience and sustained demand across major cryptocurrencies during the consolidation phase.
X launches smart cashtags enabling real-time crypto and stock tracking, improving marke
CryptoNewsLand7h ago
Dogecoin Holds $0.09 Support as $0.10 Breakout Looms
Dogecoin remains around $0.09, showing limited movement as traders await a clear breakout direction. Key support is at $0.08, with resistance at $0.10. Current technical indicators suggest a balanced market, but a decisive move is needed to shift momentum.
CryptoNewsLand7h ago
XRP Price Clears $1.40 While Broader Downtrend Persists
XRP's recent rise above $1.40 indicates a shift in market behavior after a consolidation phase. While momentum indicators show improvement, the broader bearish trend persists, limiting upside potential. Sustained support is crucial for extending its recovery.
CryptoNewsLand7h ago
