The cryptocurrency market is gradually recovering, and World Liberty Financial (WLFI) stands out as the brightest star in today's growth group. In the past 24 hours, this coin has surged over 33%, strongly surpassing important resistance levels thanks to vibrant trading momentum.
The uptrend seems to be ongoing, as technical signals indicate that buying pressure from the bulls is returning, igniting hopes for a new recovery cycle in the market.
Breakthrough technical activation triggers a wave of interest
WLFI has officially broken above the downward trend line that has lasted for 49 days — a clear technical reversal signal, marking the return of buying pressure. This move opens up the next target for an increase around the 0.25 USD mark, corresponding to the upper limit of the previous price channel.
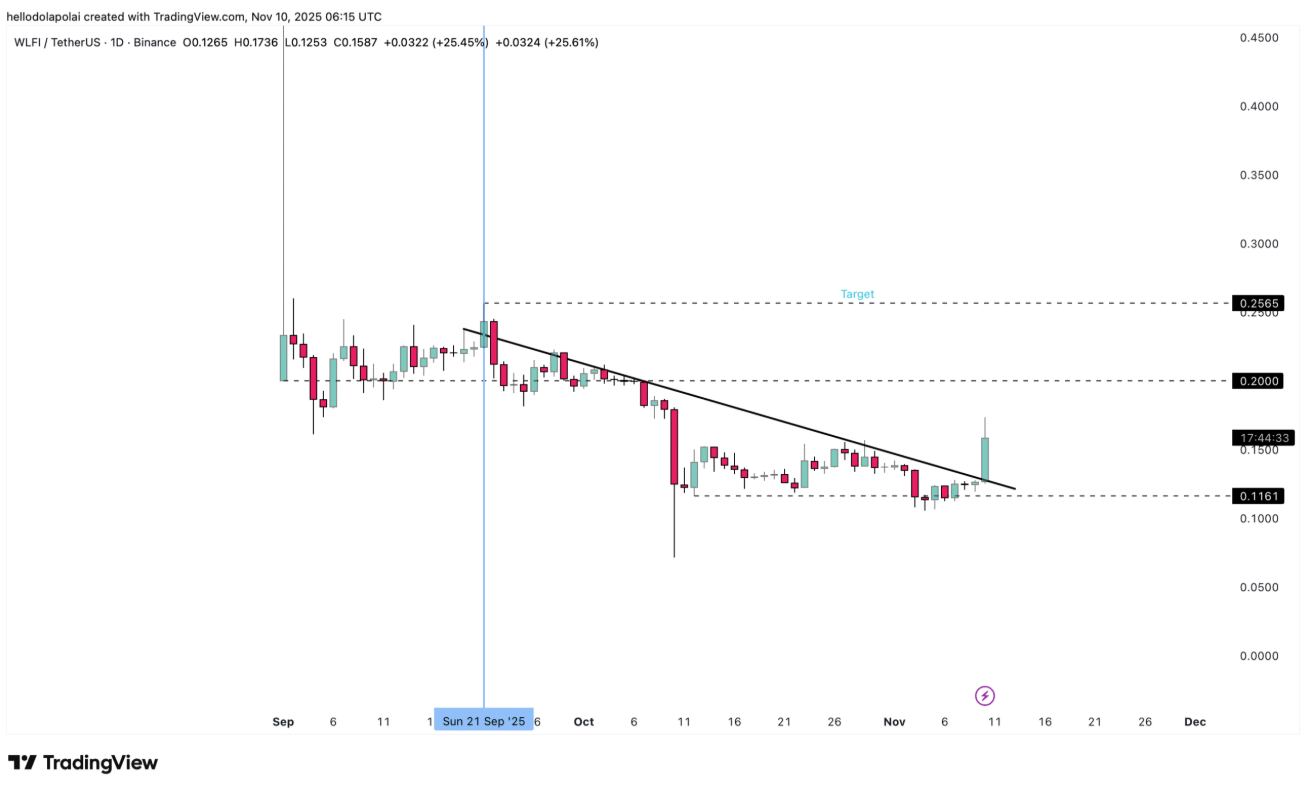 WLFI/USDT daily chart | Source: TradingViewIf this price range is reached, WLFI will record the highest trading level since September 22, reinforcing confidence in a new recovery cycle. The current uptrend will also be an important test, showing whether this altcoin has enough momentum to maintain a positive trend.
On the contrary, if the price does not hold and slides below the recently broken resistance line, selling pressure could pull WLFI back to the support area around 0.11 USD on the chart.
The price increase motivation remains strong
Recent technical signals indicate that WLFI's uptrend still has plenty of room to expand.
The MACD indicator has just issued a strong bullish signal when forming a bullish cross — occurring when the MACD line (green) crosses above the signal line (orange). This is a sign that buying power is returning to the market, opening up the possibility that WLFI could enter a new bullish cycle.
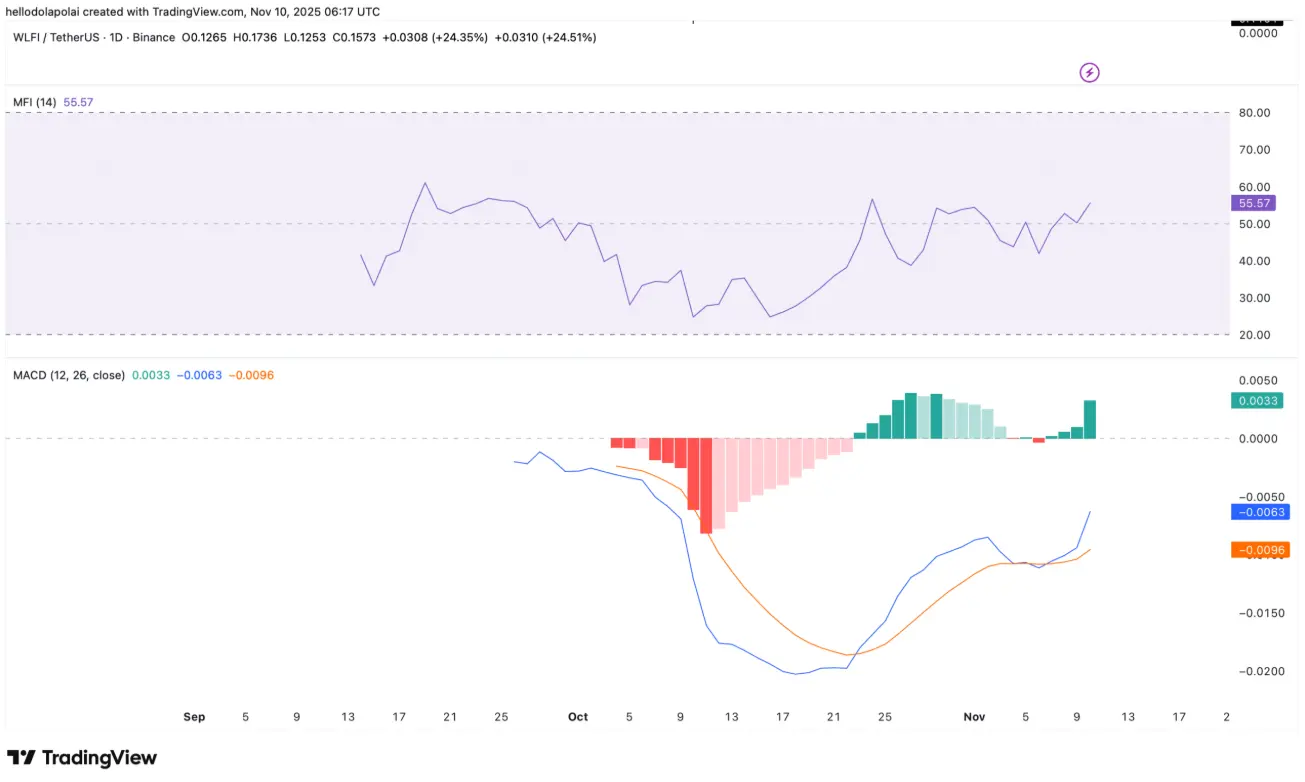 The MFI and MACD indicators on the daily WLFI/USDT chart | Source: TradingViewNotably, the MACD is currently still in the negative zone, indicating that there is still room for price increase if this recovery trend is maintained.
At the same time, the Money Flow Index (MFI) has increased to 55.57 points, reflecting new capital inflows into WLFI. The upward trend of the MFI indicates that investors are reallocating liquidity, contributing to the recovery momentum of this token.
Short sellers face the risk of “burning their positions”
Traders opening Short positions in the derivatives market are under heavy pressure as the wave of liquidation (liquidation) continues to occur.
According to data from CoinGlass, investors betting on the bearish trend of WLFI in the past 24 hours have recorded the largest losses, with a total liquidation value of around 3.45 million USD.
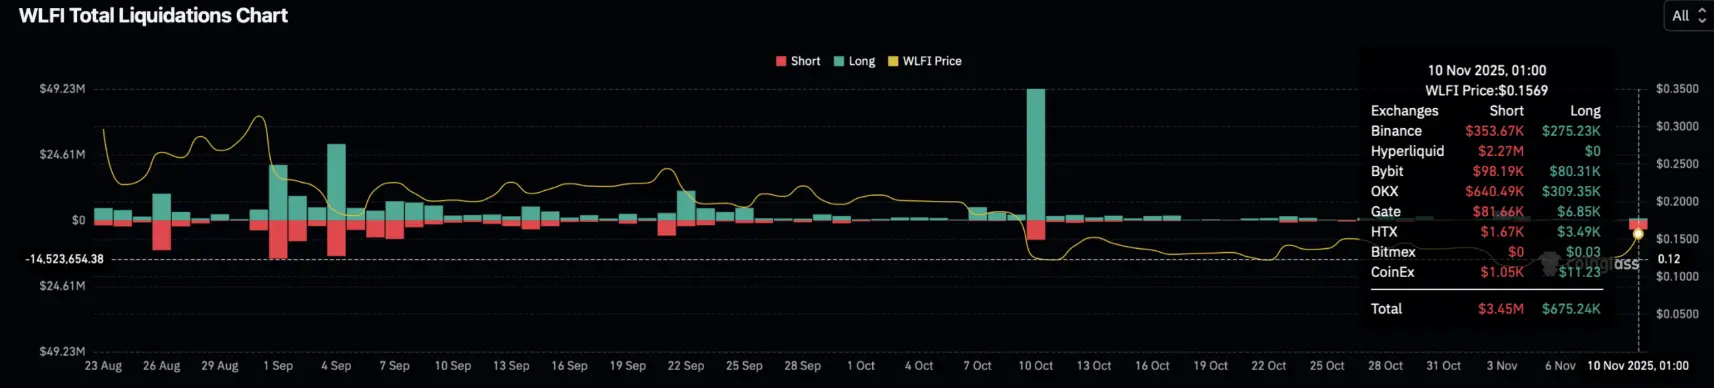 Source: CoinGlassThe liquidation map ( shows that the pressure could continue to rise if the upward momentum of WLFI is maintained. Specifically, if the price exceeds the threshold of 0.184 USD, approximately 3.91 million USD in short contracts will be wiped out; and when it hits 0.168 USD, an additional 2.46 million USD in short positions will also be at risk of forced closure — putting further strain on the short sellers.
SN_Nour
Disclaimer: The information on this page may come from third parties and does not represent the views or opinions of Gate. The content displayed on this page is for reference only and does not constitute any financial, investment, or legal advice. Gate does not guarantee the accuracy or completeness of the information and shall not be liable for any losses arising from the use of this information. Virtual asset investments carry high risks and are subject to significant price volatility. You may lose all of your invested principal. Please fully understand the relevant risks and make prudent decisions based on your own financial situation and risk tolerance. For details, please refer to
Disclaimer.
Related Articles
XRP Breaks Above $1.40 as Spot ETF Inflows Hit $17.6M Milestone
XRP breaks $1.40 after Ripple partnership boosts investor confidence and market momentum.
Spot XRP ETFs record $17.6M inflows, signaling rising institutional demand and interest.
Technical indicators show resistance ahead, with support holding near $1.40 and $1.3840.
Ripple’s XRP is
CryptoNewsLand3h ago
PEPE Reclaims 0.00000400 — Is This 1.8% Move the Start of a Bigger Run?
PEPE rebounds from 0.00000385 support, forming higher lows and stronger bullish structure.
Technical indicators like MACD and RSI show momentum with room for further upside.
Key resistance at 0.00000410; support at 0.00000380 critical for trend continuation.
PepeCoin — PEPE, has
CryptoNewsLand7h ago
ETH drops 0.58% in 15 minutes: derivatives liquidity contraction and proactive position reduction dominate short-term pullback
From 2026-04-19 04:30 to 2026-04-19 04:45 (UTC), within ETH’s 15-minute candlestick chart, the return recorded -0.58%, and the price range was 2321.62 to 2342.04 USDT, with an amplitude of 0.87%. The short-term selloff occurred against a backdrop of increased overall market volatility and a broad decline in the prices of major crypto assets; overall market risk appetite clearly fell, and traders’ wait-and-see sentiment strengthened.
The main driver behind this abnormal move is a sharp contraction in liquidity in the derivatives market and leveraged funds proactively reducing positions. Data shows that over the past 24 hours, the ETH/USD perpetual contract trading volume dropped 67.16% to approximately 74.87 million, open interest edged down 3.33% to 329 million, and liquidation amounts did not expand unusually. This structure indicates that the market lacks the risk of passive cascades; more funds chose to proactively step aside and wait on the sidelines, intensifying short-term selling pressure.
In addition, the long/short structure in which shorts held the upper hand (long/short ratio 47.48%:52.52%) and sentiment synchronization with the panic range reinforced the downward price trend. During the same period, major coins such as BTC and SOL also fell 2%-3.4% in tandem, further showing that this pullback was driven by system-wide risk sentiment. On-chain funds did not show any large abnormal transfers or large-scale liquidations of DeFi protocols; spot and on-chain liquidity remained generally stable, and no sudden system risk resonance was observed.
Current volatility-related risks still need close monitoring, especially as overall risk appetite continues to contract—ETH’s short-term price may face further downside probing. Watch subsequent changes in derivatives trading volume and open interest, extreme shifts in the long/short ratio and funding rate, and promptly monitor on-chain fund flows, large transfers, and any signs of amplified platform net outflows. For more market anomalies and deeper analysis, please continue to follow our upcoming market updates.
GateNews8h ago
Spark Protocol's January delisting of rsETH proves prudent as Aave faces ETH liquidity crisis
Spark Protocol's strategy of delisting low-usage assets and tightening collateral has faced initial backlash but proved wise during market turmoil. While maintaining higher interest rate caps, SparkLend ensures liquidity, unlike Aave, which now faces significant risks.
GateNews9h ago
Request Network (REQ) Surges 23.68% in 15 Minutes, 24-Hour Gain Reaches 116.52%
Request Network (REQ) surged 23.68% in just 15 minutes, reaching $0.152, with a 24-hour rise of 116.52% and trading volume over $8 million. Factors include retail interest and whale accumulation. Resistance at $0.160 and support at $0.122 are under observation.
GateNews10h ago
Solana Price Stalls Near $80 as ETF Outflows Weigh
Solana trades around $80, facing bearish sentiment due to ETF outflows and declining retail participation. Technical indicators show mixed signals, with resistance at $87 and $98, while support at $77 remains critical for stability.
CryptoFrontNews14h ago
