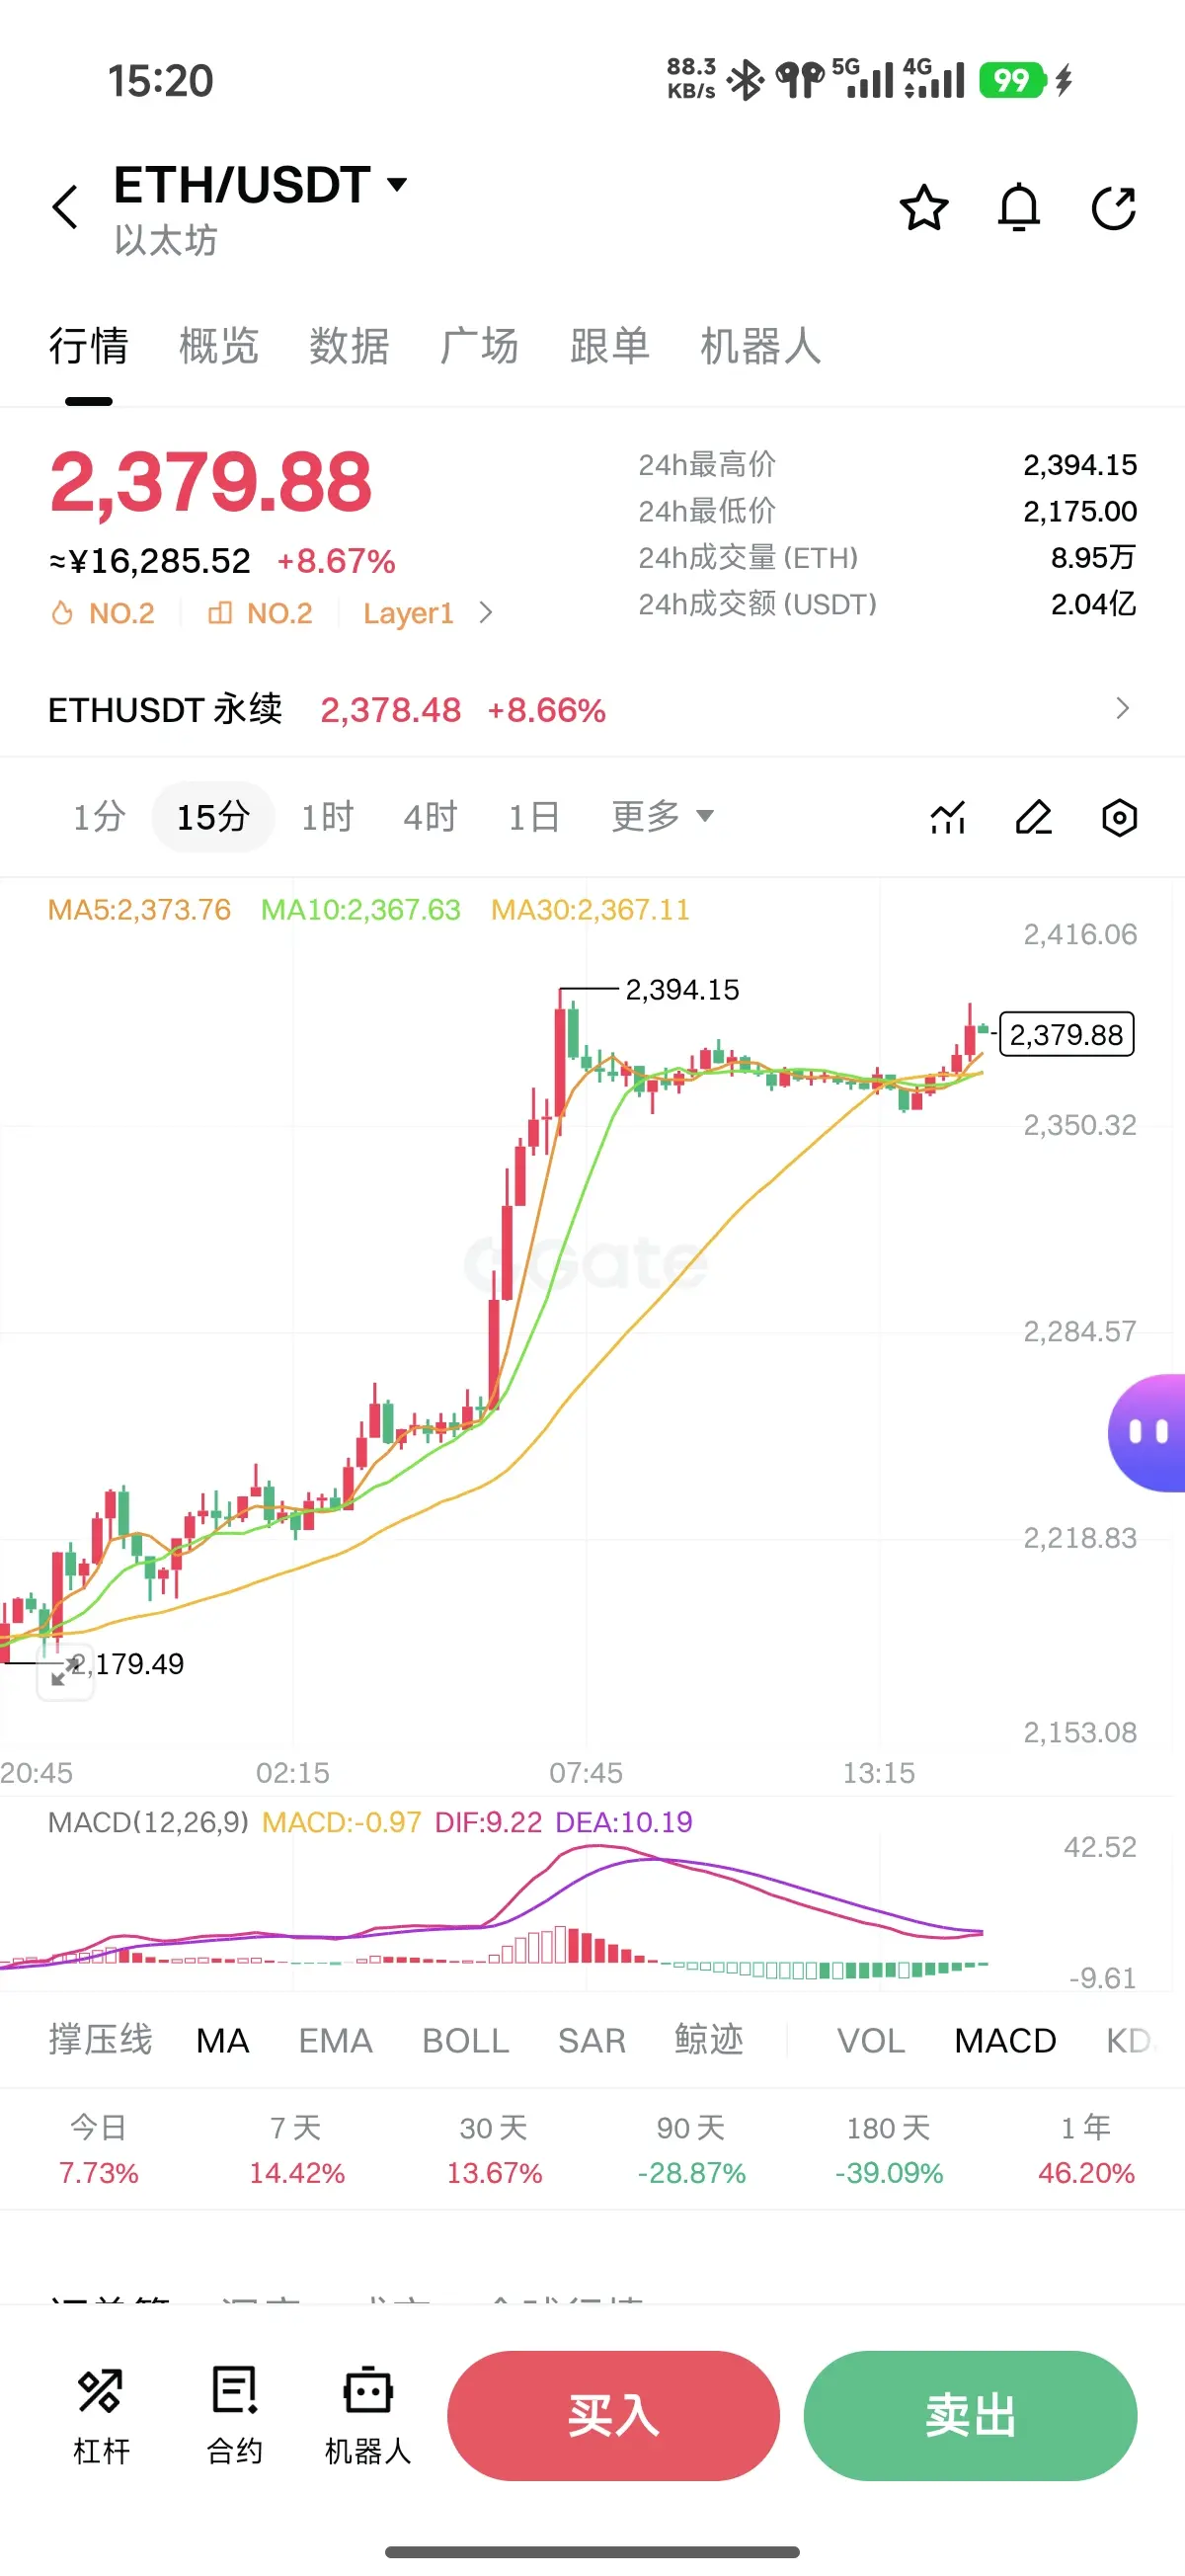
I just looked at
$ETH 's 4-hour chart, and it's very strong. If this wave stabilizes above 2100,
then the resistance levels will be:
R1: 2188–2200 (short-term integer key level + potential upper shadow area)
R2: 2245–2265 (common target zone for the second leg after a rally)
R3: 2320–2360 (strong trend extension target / momentum acceleration zone)
Support levels:
S1: 2140–2150 (strong rebound support zone)
S2: 2105–2120 (secondary defense after breaking S1)
S3: 2060–2080 (4H trend's "last line of defense"; a break below indicates a significant weakening of the bullish structure)
Next steps:
Strong continuation (higher probability): A pullback only to S1(2140–2150) to halt the decline, then after breaking above 2200, watch for 2245–2265 within 24–48 hours. If volume continues to grow, 48–72 hours might test 2320–2360.
High-level consolidation (moderate probability): Moving back and forth within the 2140–2200 range, characterized by frequent wicks and chasing the rally, which can lead to shakeouts; pattern A's phased pullbacks are more favorable.
Weakening and retracement (must be cautious): If the 4H close drops below 2105 and cannot recover above 2140, the likely target is 2060–2080; if it breaks 2055 again, short-term long strategies fail, and a new structure needs to form before acting.
This kind of uncertain situation isn't common among most traders, so it's better to watch more and act less. Wishing everyone early profits.