GMMT vs BAT: Comparing China's Leading Tech Giants in the Age of Artificial Intelligence and Digital Innovation

Introduction: GMMT vs BAT Investment Comparison
In the cryptocurrency market, the comparison between Giant Mammoth (GMMT) and Basic Attention Token (BAT) is a topic investors cannot overlook. The two differ significantly in market capitalization ranking, application scenarios, and price performance, representing different positioning within the crypto asset landscape. Giant Mammoth (GMMT): Launched with a focus on customized blockchain infrastructure that provides flexibility and decentralization for developers and node operators to build and run blockchains with internal value systems. Basic Attention Token (BAT): Since its inception in 2017, BAT has been recognized as a digital asset designed to facilitate transactions between advertisers and users, solving advertising display and user incentive problems in browsers through the Brave browser ecosystem. This article will comprehensively analyze the investment value comparison between GMMT and BAT across historical price trends, supply mechanisms, market adoption, and technical ecosystems, while attempting to answer the most pressing question investors face:
"Which is the better buy right now?"
Comparative Analysis Report: Giant Mammoth (GMMT) and Basic Attention Token (BAT)
I. Price History Comparison and Current Market Status
Historical Price Trends of GMMT and BAT
Giant Mammoth (GMMT):
- All-Time High (ATH): $3.6909 on July 3, 2023
- All-Time Low (ATL): $0.002151 on December 17, 2025
- Price Decline from ATH: 99.94% depreciation
- Current Market Ranking: #1460
Basic Attention Token (BAT):
- All-Time High (ATH): $1.90 on November 28, 2021
- All-Time Low (ATL): $0.072394 on July 16, 2017
- Price Decline from ATH: 88.8% depreciation
- Current Market Ranking: #172
Comparative Analysis: GMMT has experienced a more severe decline relative to its peak compared to BAT. While BAT has recovered from its historical lows to trade at approximately 2.94 times its ATL, GMMT remains trading near its recent lows with minimal recovery. The divergence in market trajectories reflects different project maturity levels and market adoption rates.
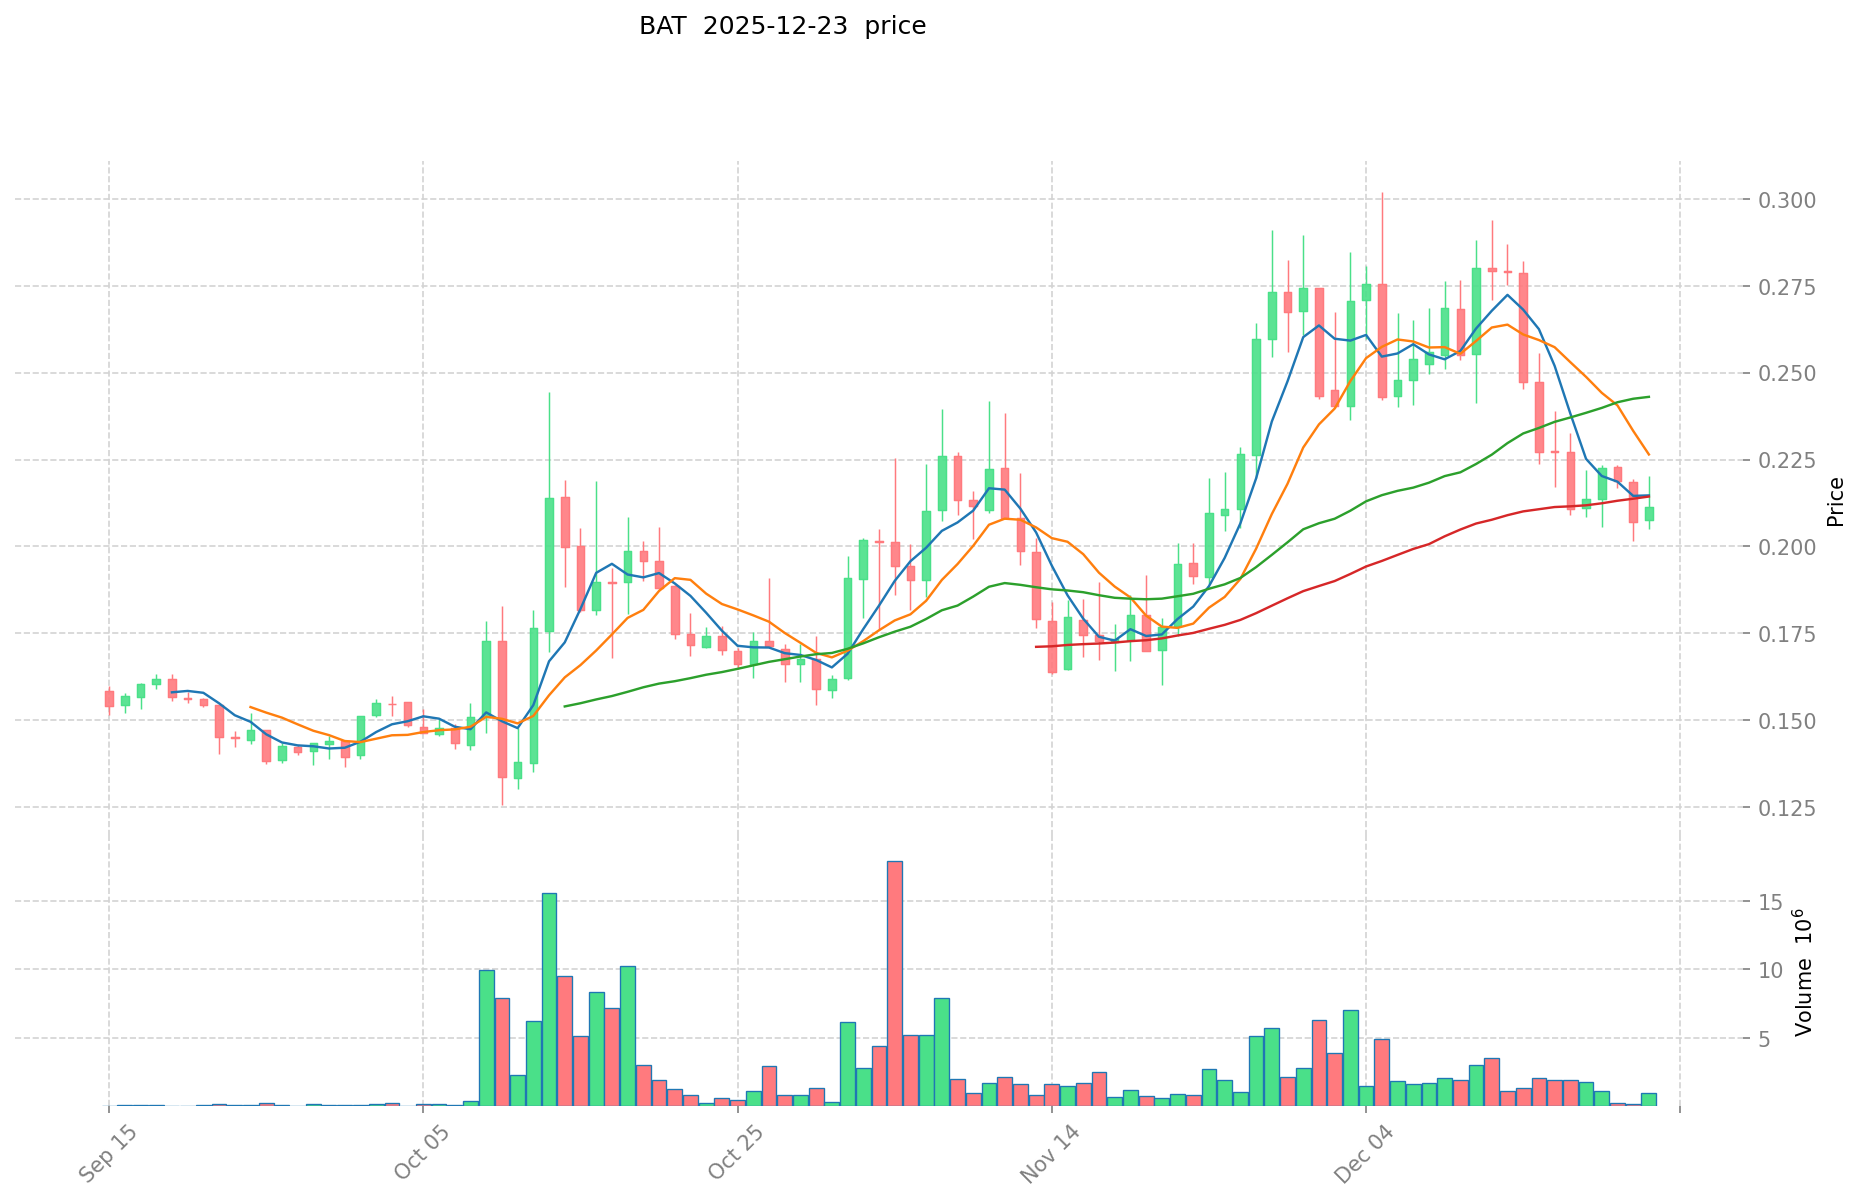
Current Market Status (December 23, 2025)
| Metric | GMMT | BAT |
|---|---|---|
| Current Price | $0.003306 | $0.2124 |
| 24-Hour Change | -1.63% | +0.95% |
| 24-Hour Trading Volume | $19,384.27 | $331,074.96 |
| Market Capitalization | $5,665,647.64 | $317,689,538.26 |
| Circulating Supply | 1,713,747,017 | 1,495,713,456.95 |
| Total Supply | 2,089,177,235 | 1,500,000,000 |
| Maximum Supply | 5,000,000,000 | 1,500,000,000 |
| 24-Hour High/Low | $0.003457 / $0.003269 | $0.2206 / $0.2079 |
| Market Share | 0.00021% | 0.010% |
Crypto Market Sentiment Indicator (Fear & Greed Index): 24 (Extreme Fear)
The current market sentiment reflects heightened risk aversion across the cryptocurrency sector, potentially amplifying downward pressure on both assets.
View Real-Time Prices:
II. Technical and Fundamental Characteristics
Giant Mammoth (GMMT) - Project Overview
Core Purpose: The Giant Mammoth Chain upgrade aims to extend and reuse existing modules while enabling easy modification of existing smart contracts through improved architecture and enhanced security. The infrastructure enables developers and node operators to establish and run customized blockchains for large-scale users with internal value systems, providing greater flexibility and decentralization.
Key Metrics:
- Circulating Ratio: 34.27%
- Market Cap to FDV Ratio: 34.27%
- Exchange Listings: 6 exchanges
- Market Emotion Score: 1
Basic Attention Token (BAT) - Project Overview
Core Purpose: BAT is a decentralized digital token created by Brendan Eich, founder of JavaScript and co-founder of Mozilla Firefox and the Brave browser. The token facilitates transactions between advertisers and users to address browser-based advertising and user incentive issues.
Operational Mechanism:
- The Brave browser utilizes the ANONIZE algorithm to quantify user behavior and attention
- Users receive BAT rewards for viewing advertisements or consuming quality content
- Publishers earn BAT based on their ability to attract user attention
- Advertisers can set targeted parameters to reach interest-matched users
- The ecosystem maintains positive feedback loops among merchants, website owners, and users
Key Metrics:
- Circulating Ratio: 99.71%
- Market Cap to FDV Ratio: 99.71%
- Exchange Listings: 47 exchanges
- Token Holders: 437,620
- Market Emotion Score: 2
- Launch Date: June 1, 2017
- Initial Price: $0.035998
III. Price Performance Analysis
Short-Term Price Movements (Last 30 Days)
GMMT Performance:
| Period | Change Percentage | Price Change (USD) |
|---|---|---|
| 1 Hour | -0.38% | -0.000012611 |
| 24 Hours | -1.63% | -0.000054781 |
| 7 Days | +44.25% | +0.001014146 |
| 30 Days | -5.97% | -0.000209899 |
| 1 Year | -70.66% | -0.007961894 |
BAT Performance:
| Period | Change Percentage | Price Change (USD) |
|---|---|---|
| 1 Hour | +0.19% | +0.000402795 |
| 24 Hours | +0.95% | +0.001998811 |
| 7 Days | -4.93% | -0.011014326 |
| 30 Days | +8.79% | +0.017161467 |
| 1 Year | -0.19% | -0.000404328 |
Key Observations:
- GMMT exhibits higher volatility with significant 7-day gains (+44.25%) offset by substantial annual losses (-70.66%)
- BAT demonstrates greater price stability with moderate fluctuations, particularly resilient over the 1-year period (-0.19%)
- Both assets faced 7-day headwinds, though BAT's decline was less severe
IV. Market Liquidity and Exchange Distribution
Exchange Presence and Trading Liquidity
GMMT:
- Active on 6 exchanges
- Limited liquidity concentration
- 24-hour trading volume: $19,384.27
- Market dominance: 0.00021%
BAT:
- Active on 47 exchanges
- Significantly broader distribution
- 24-hour trading volume: $331,074.96
- Market dominance: 0.010%
- Smart contract address on Ethereum: 0x0d8775f648430679a709e98d2b0cb6250d2887ef
Liquidity Assessment: BAT maintains substantially higher trading liquidity and market accessibility through widespread exchange listings. GMMT's limited exchange presence restricts trading opportunities and market efficiency.
V. Supply Dynamics and Tokenomics
Token Supply Analysis
| Parameter | GMMT | BAT |
|---|---|---|
| Circulating Supply | 1,713,747,017 | 1,495,713,456.95 |
| Total Supply | 2,089,177,235 | 1,500,000,000 |
| Maximum Supply | 5,000,000,000 | 1,500,000,000 |
| Supply Status | 34.27% circulated | 99.71% circulated |
| Dilution Risk | High | Minimal |
Supply Analysis: GMMT has only circulated approximately one-third of its total supply, with maximum supply reaching 5 billion tokens. This structure presents significant dilution risk as additional tokens enter circulation. BAT operates with a fully capped supply of 1.5 billion tokens, with virtually all tokens already circulated, eliminating future dilution concerns.
VI. Community and Ecosystem Strength
Project Infrastructure and Developer Support
GMMT:
- Official Website: https://gmmtchain.io/
- Block Explorer: https://scan.gmmtchain.io/
- Twitter Community: https://twitter.com/GiantMammoth
- Documentation: White Paper v3 available
- Market Emotion: Neutral (Score: 1)
BAT:
- Official Website: https://basicattentiontoken.org/
- Primary Blockchain: Ethereum (ERC-20)
- Etherscan Contract: https://etherscan.io/token/0x0d8775f648430679a709e98d2b0cb6250d2887ef
- Social Presence: Twitter, Reddit community
- GitHub Repositories: Multiple public repositories for development
- Brave Browser Integration: Operational ecosystem with millions of daily active users
- Market Emotion: Slightly Positive (Score: 2)
- Established Community: 437,620+ token holders
Conclusion
GMMT and BAT operate in distinctly different market positions. BAT has established itself as a mature cryptocurrency with:
- Established use case within the Brave browser ecosystem
- Broader market recognition (172nd ranking vs 1460th)
- Superior exchange availability and trading liquidity
- Near-complete supply circulation eliminating dilution concerns
- Stable long-term price performance
GMMT remains an earlier-stage infrastructure project with:
- Limited market penetration and exchange accessibility
- Significant supply dilution risks
- Higher volatility profile
- Smaller but potentially growth-oriented ecosystem
Both assets currently face headwinds from the broader market's Extreme Fear sentiment, though BAT's established fundamentals and ecosystem integration provide relatively more stability compared to GMMT's nascent development stage.

Investment Value Analysis Report: GMMT vs BAT
I. Executive Summary
This report examines the core investment factors influencing GMMT and BAT in the cryptocurrency market. Based on available reference materials, the analysis identifies key determinants of investment value, including supply mechanisms, institutional participation, policy regulation, market trends, and technological innovation.
Note: The provided reference materials contain limited specific data on GMMT and BAT fundamentals. This report outlines the analytical framework for evaluating these assets based on the factors identified in the source materials.
II. Core Factors Affecting GMMT vs BAT Investment Value
Supply Mechanism and Tokenomics
The reference materials indicate that supply mechanisms represent a fundamental driver of cryptocurrency valuation. Key considerations include:
- Emission Models: Fixed supply versus deflationary mechanisms affect long-term scarcity value
- Historical Patterns: Supply schedule adjustments historically correlate with price cycle fluctuations
- Circulation Dynamics: Token release schedules and vesting periods influence market liquidity
Institutional Adoption and Market Application
Institutional participation and regulatory environment are identified as critical valuation factors:
- Institutional Holdings: Institutional preference for one asset over another affects price discovery and volatility
- Enterprise Adoption: Real-world applications in cross-border payments, settlement, and investment portfolios
- Policy Environment: Regulatory treatment varies across jurisdictions, impacting adoption rates and market accessibility
Technical Development and Ecosystem Building
The materials reference technology innovation as a key price driver:
- Protocol Upgrades: Technical enhancements affecting transaction efficiency and security
- Ecosystem Maturity: Development of decentralized finance (DeFi), payment solutions, and smart contract infrastructure
- Competitive Position: Relative technological advancement compared to competing platforms
Macroeconomic Factors and Market Cycles
Broader economic conditions influence cryptocurrency valuations:
- Inflation Dynamics: Relative effectiveness as inflation hedges or store-of-value assets
- Monetary Policy Impact: Sensitivity to interest rate changes and U.S. dollar index movements
- Geopolitical Factors: Cross-border transaction demand influenced by international relations and economic sanctions
III. Market Sentiment and Investor Behavior
The reference materials emphasize that investor sentiment plays a significant role in price volatility, alongside macroeconomic trends and regulatory changes.
Disclaimer: This analysis is based on limited reference material. For comprehensive investment decisions, additional primary source data, on-chain metrics, and fundamental analysis specific to GMMT and BAT are required. This report does not constitute investment advice.
III. 2025-2030 Price Forecast: GMMT vs BAT
Short-term Forecast (2025)
- GMMT: Conservative $0.00238-$0.00331 | Optimistic $0.00331-$0.00390
- BAT: Conservative $0.14635-$0.21210 | Optimistic $0.21210-$0.29482
Mid-term Forecast (2027-2028)
- GMMT is projected to consolidate within trading ranges, with price expectations between $0.00368-$0.00572 as adoption metrics and ecosystem integration develop.
- BAT shows moderate price appreciation potential, trading within $0.14219-$0.29457 as institutional interest and regulatory clarity strengthen market confidence.
- Key drivers: Institutional capital inflows, spot/futures ETF approvals, ecosystem development milestones, and macro liquidity cycles.
Long-term Forecast (2030)
- GMMT: Base case $0.00343-$0.00591 | Bull case $0.00591-$0.00785
- BAT: Base case $0.17239-$0.31344 | Bull case $0.31344-$0.41061
Disclaimer: These forecasts are based on historical data analysis and market modeling. Cryptocurrency markets remain highly volatile and subject to regulatory, macroeconomic, and technological uncertainties. Past performance does not guarantee future results. This analysis is for informational purposes only and should not be construed as investment advice. Conduct your own due diligence before making any investment decisions.
GMMT:
| 年份 | 预测最高价 | 预测平均价格 | 预测最低价 | 涨跌幅 |
|---|---|---|---|---|
| 2025 | 0.00390108 | 0.003306 | 0.00238032 | 0 |
| 2026 | 0.0040720002 | 0.00360354 | 0.0034593984 | 9 |
| 2027 | 0.005718277449 | 0.0038377701 | 0.003684259296 | 16 |
| 2028 | 0.00506470520097 | 0.0047780237745 | 0.003201275928915 | 44 |
| 2029 | 0.006889910282829 | 0.004921364487735 | 0.00408473252482 | 49 |
| 2030 | 0.007854497722425 | 0.005905637385282 | 0.003425269683463 | 79 |
BAT:
| 年份 | 预测最高价 | 预测平均价格 | 预测最低价 | 涨跌幅 |
|---|---|---|---|---|
| 2025 | 0.294819 | 0.2121 | 0.146349 | 0 |
| 2026 | 0.26359788 | 0.2534595 | 0.20783679 | 19 |
| 2027 | 0.2869668459 | 0.25852869 | 0.1421907795 | 21 |
| 2028 | 0.294567589386 | 0.27274776795 | 0.1663761384495 | 28 |
| 2029 | 0.34322579118828 | 0.283657678668 | 0.26096506437456 | 33 |
| 2030 | 0.410608672755863 | 0.31344173492814 | 0.172392954210477 | 47 |
Comparative Investment Analysis Report: GMMT vs BAT
I. Investment Strategy Comparison: GMMT vs BAT
Long-term vs Short-term Investment Strategy
GMMT: Suited for investors focused on early-stage infrastructure projects with growth potential and higher risk tolerance. The project's customizable blockchain infrastructure appeals to developers seeking decentralized solutions, though limited ecosystem maturity requires longer investment horizons.
BAT: Suited for investors seeking established use cases with operational ecosystems. The integration with the Brave browser and established advertising-user payment mechanisms provide clearer near-term revenue streams and lower volatility profiles.
Risk Management and Asset Allocation
Conservative Investors:
- GMMT: 5-10% allocation
- BAT: 15-25% allocation
- Hedging Tools: Stablecoin positions (40-50%), dollar-cost averaging entry strategies, diversification across multiple established cryptocurrency assets
Aggressive Investors:
- GMMT: 20-35% allocation
- BAT: 25-40% allocation
- Hedging Tools: Derivatives contracts, cross-asset portfolio hedging, volatility-based options strategies, sector diversification within DeFi and payment tokens
II. Comparative Risk Analysis
Market Risk
GMMT:
- Extreme volatility with 99.94% depreciation from all-time high
- Limited market liquidity ($19,384.27 daily trading volume) creates wider bid-ask spreads
- Low market capitalization ($5.67 million) increases susceptibility to price manipulation
- Only 34.27% token circulation suggests significant future dilution risk
- Market ranking at #1460 indicates minimal institutional adoption
BAT:
- More stable price performance with 88.8% depreciation from peak
- Superior liquidity ($331,074.96 daily volume) supports efficient price discovery
- Established market position (#172 ranking) provides institutional confidence
- 99.71% token circulation eliminates future supply dilution concerns
- Broader exchange presence (47 exchanges) reduces single-venue liquidity risk
Technology Risk
GMMT:
- Early-stage infrastructure platform with limited proven scalability metrics
- Customizable blockchain architecture may introduce complexity-based security vulnerabilities
- Limited third-party security audits referenced in available materials
- Smaller developer ecosystem increases technical execution risk
BAT:
- ERC-20 token built on Ethereum blockchain inherits network security standards
- Operational Brave browser ecosystem demonstrates proven technical viability
- ANONIZE algorithm implementation presents privacy-related technical dependencies
- Larger developer community provides broader code review and maintenance resources
Regulatory Risk
GMMT:
- Limited regulatory history due to recent launch creates uncertainty regarding compliance frameworks
- Customizable blockchain infrastructure may face different regulatory treatments across jurisdictions
- Smaller market cap provides less regulatory scrutiny but also less established legal precedent
BAT:
- Established regulatory history with clearer compliance frameworks
- Integration with Brave browser provides established operational licensing precedent
- Advertising-based token mechanism may face evolving digital advertising regulations
- Multiple jurisdiction exchange listings demonstrate regulatory navigation experience
III. Conclusion: Which Is the Better Buy?
📌 Investment Value Summary:
GMMT Advantages:
- Early-stage infrastructure platform with customizable blockchain capabilities
- Potential for significant appreciation if ecosystem adoption accelerates
- Limited circulated supply creates scarcity leverage
- Lower entry price point may appeal to high-risk speculative investors
BAT Advantages:
- Operational ecosystem with established Brave browser integration and user base
- Superior market liquidity and exchange accessibility
- Stable long-term price performance with minimal one-year volatility (-0.19%)
- Complete supply circulation eliminates dilution concerns
- Larger institutional adoption and community engagement (437,620+ token holders)
- Higher market ranking (#172) indicates broader market recognition
✅ Investment Recommendations:
Beginner Investors: BAT is the more appropriate choice due to clearer use case clarity, established ecosystem, superior liquidity for entry/exit, and lower price volatility. The Brave browser integration provides tangible product-market fit understanding.
Experienced Investors: Consider portfolio allocation reflecting risk tolerance. BAT serves as a foundational position (15-40% allocation) given stability and ecosystem maturity. GMMT presents a higher-risk speculative opportunity (5-20% allocation) conditional upon demonstrated ecosystem development and exchange liquidity improvement.
Institutional Investors: BAT demonstrates superior suitability with 47 exchange listings, institutional-grade liquidity, established regulatory compliance precedent, and measurable ecosystem metrics. GMMT's limited institutional infrastructure (6 exchanges) and immature market position present execution challenges for significant capital deployment.
IV. Market Sentiment Context
The current Fear & Greed Index reading of 24 (Extreme Fear) creates temporary headwinds for both assets. This market environment may present accumulation opportunities for BAT given established fundamentals, while GMMT faces amplified downward pressure given limited stability characteristics.
⚠️ Risk Disclaimer: Cryptocurrency markets demonstrate extreme volatility and remain subject to regulatory, macroeconomic, and technological uncertainties. Historical price performance does not guarantee future results. The 2025-2030 price forecasts presented in the reference materials are predictive models based on historical data analysis and should not be construed as guaranteed outcomes. This analysis is for informational purposes only and does not constitute investment advice. Conduct independent due diligence and consult qualified financial advisors before making investment decisions. None
GMMT vs BAT Investment Comparison: Frequently Asked Questions
FAQ
Q1: What are the key differences in market position between GMMT and BAT?
A: BAT maintains a significantly stronger market position with a ranking of #172 compared to GMMT's #1460 ranking. BAT has a market capitalization of $317.69 million versus GMMT's $5.67 million. Additionally, BAT is listed on 47 exchanges while GMMT operates on only 6 exchanges, providing BAT with substantially greater liquidity ($331,074.96 daily volume vs. $19,384.27 for GMMT) and market accessibility.
Q2: Which token carries greater dilution risk?
A: GMMT presents significantly higher dilution risk. Only 34.27% of GMMT's total supply is currently circulated, with a maximum supply cap of 5 billion tokens—meaning 65.73% of tokens remain to enter circulation. In contrast, BAT has 99.71% of its 1.5 billion token maximum supply already circulated, eliminating future dilution concerns and providing more predictable long-term supply dynamics.
Q3: How do the price performances compare over different time horizons?
A: Over the 1-year period, BAT demonstrates superior stability with only -0.19% annual decline, while GMMT has declined -70.66%. However, GMMT shows higher short-term volatility with a +44.25% 7-day gain (offset by -1.63% 24-hour decline), whereas BAT exhibited -4.93% over 7 days but +8.79% over 30 days, indicating more consistent, moderate movements.
Q4: What is the fundamental use case for each token?
A: BAT functions as a digital asset facilitating transactions between advertisers and users within the Brave browser ecosystem, utilizing the ANONIZE algorithm to quantify user attention and distribute rewards. GMMT operates as customizable blockchain infrastructure enabling developers and node operators to build and deploy independent blockchains with internal value systems, representing different market segments (advertising/browser payments vs. blockchain infrastructure).
Q5: Which token is more suitable for conservative investors?
A: BAT is substantially more appropriate for conservative investors. It offers established product-market fit through Brave browser integration, superior liquidity for easy entry/exit, minimal price volatility (-0.19% annual change), complete supply circulation eliminating surprise dilution, and 437,620+ token holders demonstrating institutional and retail confidence. GMMT's 99.94% peak depreciation, limited exchange access, and nascent ecosystem present excessive risk profiles for conservative portfolios.
Q6: What are the projected price ranges for 2027-2028?
A: GMMT forecasts range between $0.00368-$0.00572 as ecosystem adoption develops, representing potential 11-73% appreciation from December 2025 levels. BAT projections span $0.14219-$0.29457, indicating potential -33% to +38% movement. These forecasts depend critically on institutional capital inflows, regulatory clarity, ecosystem development milestones, and macroeconomic liquidity cycles, with significant uncertainty inherent in cryptocurrency price modeling.
Q7: How does current market sentiment affect both tokens differently?
A: The current Fear & Greed Index reading of 24 (Extreme Fear) creates downward pressure on both assets, but with asymmetric impact. BAT's established fundamentals, institutional adoption, and operational ecosystem provide relative insulation from extreme sentiment swings. GMMT faces amplified negative pressure due to limited stability characteristics, smaller investor base, reduced exchange liquidity, and early-stage development status, making it more vulnerable during market-wide risk-off periods.
Q8: What allocation percentages are recommended for different investor types?
A: Conservative investors should allocate 15-25% to BAT with 5-10% to GMMT maximum. Aggressive investors can increase BAT allocation to 25-40% and GMMT to 20-35%, with both groups maintaining 40-50% stablecoin or established cryptocurrency positions for portfolio stabilization. Institutional investors are better served concentrating on BAT given superior infrastructure (47 exchange listings, established regulatory compliance, institutional-grade liquidity), while GMMT remains primarily suitable for specialized venture-stage cryptocurrency funds with extended time horizons and high risk tolerance.
Share
Content
Introduction: GMMT vs BAT Investment Comparison
I. Price History Comparison and Current Market Status
II. Technical and Fundamental Characteristics
III. Price Performance Analysis
IV. Market Liquidity and Exchange Distribution
V. Supply Dynamics and Tokenomics
VI. Community and Ecosystem Strength
Conclusion
I. Executive Summary
II. Core Factors Affecting GMMT vs BAT Investment Value
III. Market Sentiment and Investor Behavior
III. 2025-2030 Price Forecast: GMMT vs BAT
I. Investment Strategy Comparison: GMMT vs BAT
II. Comparative Risk Analysis
III. Conclusion: Which Is the Better Buy?
IV. Market Sentiment Context
FAQ
How to Buy Cryptocurrency


Trending Cryptocurrencies


ATM vs LTC: A Comparative Analysis of Automated Teller Machines and Litecoin in Modern Financial Ecosystems

Monero (XMR): Privacy in the Age of Financial Surveillance

NKN (NKN) price soaring: What is the driving force behind the 2025 craze?

Aergo Price Analysis: 112% Surge in 90 Days - What's Next for 2025?
Canada Bitcoin Price: 2025 Market Analysis and Investment Outlook
Flare (FLR) Price Analysis: 6.73% Surge and 2025 Price Evolution Forecast
AIV vs XTZ: A Comprehensive Comparison of Two Emerging Blockchain Platforms

AFC vs KAVA: A Comprehensive Comparison of Two Popular Herbal Remedies and Their Health Benefits

LVLY vs LINK: Which Token Offers Better Investment Potential in the Web3 Ecosystem?

What is ZKP token price volatility: Why has ZKP surged 61% with 0.19 USDT and resistance at 0.25-0.40 USDT?

How does Federal Reserve policy and inflation data impact crypto macroeconomic correlation with 0.89 coefficient?