2025 FORT Price Prediction: Expert Analysis and Market Forecast for the Coming Year

Introduction: Market Position and Investment Value of FORT
Forta (FORT) stands as a decentralized real-time detection network dedicated to security and operational monitoring of blockchain activities. Since its launch in June 2022, FORT has established itself as a critical infrastructure component within the Web3 ecosystem. As of December 2025, FORT boasts a market capitalization of $21.09 million with a circulating supply of approximately 623.39 million tokens, currently trading at $0.02109.
This innovative security monitoring asset plays an increasingly vital role in detecting threats and anomalies across DeFi protocols, NFT platforms, governance systems, bridges, and other Web3 infrastructure. By enabling real-time threat detection and rapid response mechanisms, FORT empowers protocol teams and investors to mitigate risks and minimize potential losses.
This article provides a comprehensive analysis of FORT's price trajectory and market dynamics, examining historical performance patterns, supply-demand fundamentals, ecosystem development, and macroeconomic factors. Through this multi-dimensional approach, we deliver professional price forecasts and practical investment strategies for the 2025-2030 period, offering investors data-driven insights for informed decision-making in the FORT market.
Forta (FORT) Market Analysis Report
I. FORT Price History Review and Current Market Status
FORT Historical Price Evolution Trajectory
-
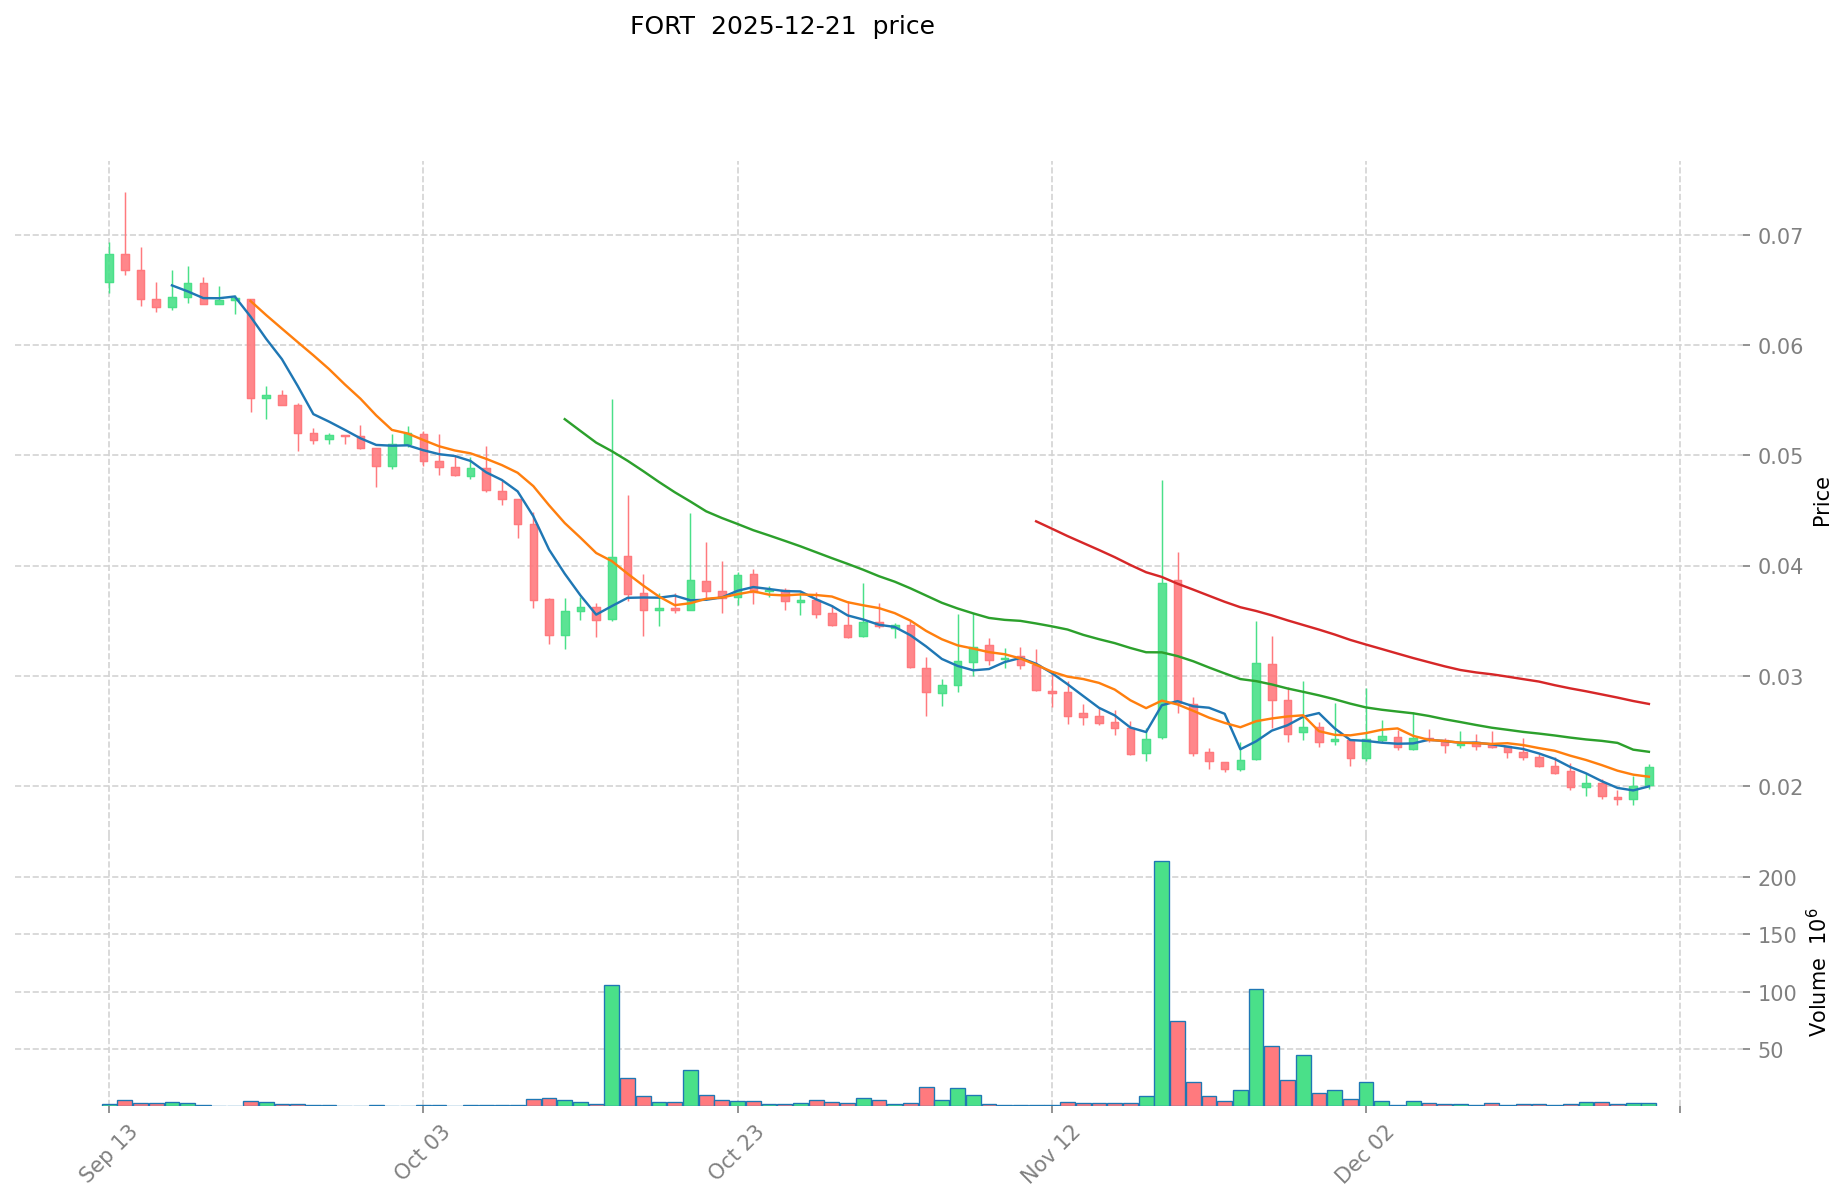
June 2022: Token launch on Ethereum mainnet at an initial price of $0.25, subsequently reaching its all-time high of $0.964645 on June 16, 2022, representing a 286% increase from the launch price during the initial market enthusiasm phase.
-
2022-2025: Extended bear market period, with FORT experiencing a significant decline of 83.39% over the one-year period, reflecting broader market conditions and consolidation phases within the security monitoring protocol sector.
-
December 19, 2025: Token reached its all-time low of $0.01832485, marking the lowest price point in its trading history.
FORT Current Market Status
As of December 21, 2025, FORT is trading at $0.02109, reflecting modest short-term price movements:
- 24-hour performance: +0.62% ($0.000129952295766247 increase)
- 1-hour performance: +0.29% ($0.000060984145976665 increase)
- 7-day performance: -2.91% (decline of $0.000632113502935423)
- 30-day performance: -18.50% (decline of $0.004787300613496935)
Market Capitalization Metrics:
- Market Cap: $13,147,324.21
- Fully Diluted Valuation: $21,090,000
- Market Cap to FDV Ratio: 62.34%
- 24-hour Trading Volume: $76,760.94
- Market Dominance: 0.00065%
Token Supply Distribution:
- Circulating Supply: 623,391,380.28 FORT (62.34% of total supply)
- Total Supply: 1,000,000,000 FORT
- Active Token Holders: 5,404
Price Range:
- 24-hour High: $0.02261
- 24-hour Low: $0.02048
Click to view current FORT market price
FORT Market Sentiment Index
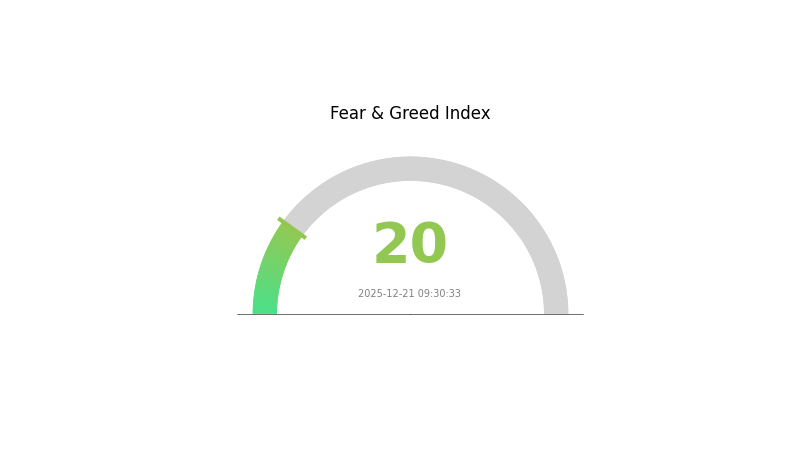
2025-12-21 Fear and Greed Index: 20 (Extreme Fear)
Click to view the current Fear & Greed Index
The cryptocurrency market is currently experiencing extreme fear, with the Fear and Greed Index dropping to 20. This indicates intense market pessimism and significant selling pressure across digital assets. During periods of extreme fear, risk-averse investors typically reduce positions, while contrarian investors may view this as a potential accumulation opportunity. Market volatility remains elevated, and investors should exercise caution while monitoring key support levels. On Gate.com, traders can track real-time market sentiment and adjust their strategies accordingly.
FORT Holdings Distribution
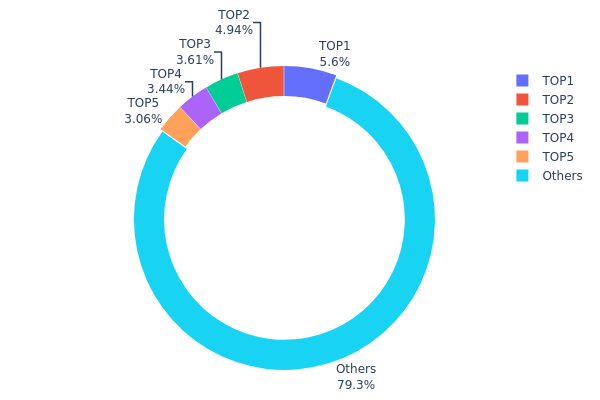
The address holdings distribution chart presents a snapshot of token concentration across the top wallet addresses within the FORT ecosystem, measured both in absolute quantity and as a percentage of total circulating supply. This metric serves as a critical indicator for assessing the decentralization level and potential market vulnerability of the token, revealing how power and influence are distributed among stakeholders.
Current analysis of FORT's top five addresses demonstrates a relatively moderate concentration pattern. The leading address holds 5.60% of total supply, while the top five addresses collectively control 20.64% of the token base. This distribution suggests that FORT has avoided extreme concentration risks that typically emerge when a single entity or small group commands excessive voting power or liquidation influence. The remaining 79.36% dispersed across other addresses indicates a fragmented holder base, which generally supports broader market participation and reduces the likelihood of coordinated market manipulation through coordinated large-scale transactions.
The present address distribution reflects a reasonably healthy on-chain structure from a decentralization perspective. While the top five holders maintain meaningful positions, no single address exhibits dominant control that would typically trigger regulatory concerns or create acute price volatility risks. This balance between concentrated institutional or early-stage positions and a distributed retail base suggests FORT maintains sufficient structural resilience against sudden sell-offs or price manipulation attempts initiated by major holders. The market architecture indicates an evolving maturation process within the FORT ecosystem, with stakeholder distribution patterns supporting relatively stable long-term price dynamics.
Click to view current FORT holdings distribution
| Top | Address | Holding Qty | Holding (%) |
|---|---|---|---|
| 1 | 0xd31e...b8c87e | 56036.61K | 5.60% |
| 2 | 0xc2c8...359564 | 49444.14K | 4.94% |
| 3 | 0x61d0...192762 | 36146.35K | 3.61% |
| 4 | 0x26e1...63e2a9 | 34381.12K | 3.43% |
| 5 | 0x5e1d...86485f | 30632.17K | 3.06% |
| - | Others | 793359.61K | 79.36% |
II. Core Factors Affecting FORT's Future Price
Supply Mechanism
-
Supply Dynamics: Supply fluctuations have historically had a significant impact on FORT's price movements. Increases in supply typically exert downward pressure on price trends.
-
Historical Patterns: Historical data demonstrates that supply changes have consistently influenced FORT's price performance, with expanded supply generally constraining upward price momentum.
-
Current Impact: Future supply adjustments are expected to play a crucial role in determining price trajectories in the near term.
Institutional and Whale Activity
- Enterprise Adoption: Select enterprises have expressed interest in adopting FORT, which could potentially enhance its utility value and market demand.
Three、2025-2030 FORT Price Forecast
2025 Outlook
- Conservative Prediction: $0.01662 - $0.02104
- Neutral Prediction: $0.02104
- Bullish Prediction: $0.02651 (requires sustained market momentum and positive ecosystem developments)
2026-2027 Mid-term Outlook
- Market Stage Expectation: Gradual accumulation phase with moderate growth trajectory, characterized by increasing institutional interest and expanding use cases within the FORT ecosystem.
- Price Range Predictions:
- 2026: $0.02068 - $0.03519
- 2027: $0.01592 - $0.03302
- Key Catalysts: Ecosystem expansion, strategic partnerships, increased adoption rates, and overall market sentiment recovery in the crypto sector.
2028-2030 Long-term Outlook
- Base Case Scenario: $0.02406 - $0.04344 by 2028 (assumes steady adoption and moderate market growth)
- Bullish Scenario: $0.03398 - $0.04593 by 2029 (assumes accelerated ecosystem integration and broader market acceptance)
- Transformative Scenario: $0.03248 - $0.05746 by 2030 (assumes breakthrough technological innovations, mainstream adoption, and significant macroeconomic tailwinds)
- 2025-12-21: FORT trading at baseline levels with anticipated 97% cumulative growth potential by 2030 (long-term accumulation opportunity)
| 年份 | 预测最高价 | 预测平均价格 | 预测最低价 | 涨跌幅 |
|---|---|---|---|---|
| 2025 | 0.02651 | 0.02104 | 0.01662 | 0 |
| 2026 | 0.03519 | 0.02378 | 0.02068 | 12 |
| 2027 | 0.03302 | 0.02948 | 0.01592 | 39 |
| 2028 | 0.04344 | 0.03125 | 0.02406 | 48 |
| 2029 | 0.04593 | 0.03734 | 0.03398 | 77 |
| 2030 | 0.05746 | 0.04164 | 0.03248 | 97 |
Forta (FORT) Professional Investment Strategy and Risk Management Report
IV. FORT Professional Investment Strategy and Risk Management
FORT Investment Methodology
(1) Long-term Holding Strategy
- Suitable Investors: Security-conscious Web3 participants, institutional investors focused on blockchain infrastructure, risk-averse portfolios seeking exposure to security protocols
- Operation Recommendations:
- Accumulate FORT during market downturns when the token trades significantly below historical highs, building positions gradually over 6-12 months
- Maintain steady holdings aligned with Forta's network development milestones and adoption in DeFi, NFT, and governance monitoring use cases
- Store accumulated FORT in secure wallets with multi-signature protection for institutional-grade security
(2) Active Trading Strategy
- Technical Analysis Tools:
- Support and Resistance Levels: Monitor key price points at $0.02048 (24h low) and $0.02261 (24h high) for entry and exit signals
- Moving Average Crossovers: Track 7-day and 30-day performance trends (-2.91% and -18.50% respectively) to identify momentum shifts
- Wave Trading Key Points:
- Execute buy positions during oversold conditions when negative 30-day momentum stabilizes
- Take profit targets around $0.025-$0.030 resistance levels based on recent trading ranges
FORT Risk Management Framework
(1) Asset Allocation Principles
- Conservative Investors: 1-2% of total portfolio allocation
- Active Investors: 3-5% of total portfolio allocation
- Professional Investors: 5-10% of total portfolio allocation
(2) Risk Hedging Solutions
- Diversification Strategy: Combine FORT holdings with other established blockchain infrastructure tokens and traditional crypto assets to reduce concentration risk
- Position Sizing: Implement strict position limits based on individual risk tolerance and never allocate more capital than can be afforded to lose
(3) Secure Storage Solutions
- Hot Wallet Solution: Gate.com Web3 Wallet for frequent trading and active management, offering immediate liquidity with enhanced security features
- Cold Storage Approach: Transfer significant FORT holdings to offline storage solutions for long-term preservation and protection against cyber threats
- Security Considerations: Enable two-factor authentication on all exchange accounts, use hardware-based security protocols, regularly audit wallet permissions, and maintain strict operational security practices to prevent unauthorized access
V. FORT Potential Risks and Challenges
FORT Market Risk
- Price Volatility: FORT has experienced extreme volatility with an 83.39% decline over one year, exposing investors to significant drawdowns and potential capital loss
- Low Trading Liquidity: With 24-hour volume of only $76,760.94 and limited exchange presence (8 exchanges), liquidity constraints may impede large position exits
- Market Cap Concentration: A fully diluted valuation of only $21.09 million indicates a relatively small market cap vulnerable to whale movements and manipulation
FORT Regulatory Risk
- Unclear Regulatory Status: As a security monitoring protocol, regulatory classification in different jurisdictions remains uncertain and subject to future government action
- Compliance Requirements: Potential changes in securities regulations could impact token utility and trading legality across global markets
- Jurisdiction-Specific Restrictions: Users in regulated jurisdictions may face limitations on FORT trading and holding requirements
FORT Technical Risk
- Protocol Scalability: As decentralized monitoring networks expand, Forta must maintain detection accuracy while handling increasing transaction volumes across multiple chains
- Smart Contract Vulnerabilities: Any exploits or vulnerabilities in Forta's core contracts could compromise the security monitoring infrastructure itself
- Blockchain Integration Dependencies: Forta's effectiveness relies on integration with multiple blockchain protocols; failures or incompatibilities could reduce network utility
VI. Conclusion and Action Recommendations
FORT Investment Value Assessment
Forta addresses a critical infrastructure need in Web3 ecosystems through real-time threat detection and anomaly monitoring across DeFi, NFT, governance, and bridge protocols. However, the token faces substantial challenges including severe year-over-year price depreciation (83.39%), limited market capitalization, and modest trading liquidity. While the underlying technology serves important security functions, FORT token investors must recognize the speculative nature of this investment and its current market positioning as a lower-tier asset (#1048 by market cap). The project's long-term viability depends on achieving mainstream adoption of security monitoring services and demonstrating clear tokenomics value proposition.
FORT Investment Recommendations
✅ Beginners: Start with minimal allocations (under 1% of portfolio) through educational purchases on Gate.com, focusing on understanding Forta's security monitoring use cases before considering larger positions
✅ Experienced Investors: Consider tactical accumulation during periods of extreme weakness while maintaining strict position size discipline and diversification across multiple blockchain infrastructure tokens
✅ Institutional Investors: Conduct thorough due diligence on Forta's technology roadmap, competitive positioning, and path to profitability before making significant allocation decisions; establish clear exit strategies tied to technical milestones
FORT Trading Participation Methods
- Direct Exchange Trading: Trade FORT pairs on Gate.com against major stablecoins (USDT, USDC) with attention to order book depth and price slippage
- Dollar-Cost Averaging: Execute scheduled purchases at regular intervals to reduce timing risk and average into positions over extended periods
- Liquidity Mining Programs: Monitor for potential staking or liquidity provision opportunities that could generate additional yield on FORT holdings
Cryptocurrency investment carries extreme risk. This report does not constitute investment advice. Investors must make decisions based on individual risk tolerance and are strongly advised to consult professional financial advisors. Never invest more capital than you can afford to lose completely.
FAQ
Is Fort a good investment?
Fort shows strong long-term potential as a security-focused crypto asset. With increasing demand for decentralized security solutions, Fort offers solid growth prospects. However, crypto investments carry volatility risks. Consider your investment goals and risk tolerance before investing.
What is the future of Forta crypto?
Forta's future looks promising with strong growth potential. Market analysis projects the maximum price to reach $0.088694 within five years, driven by increasing adoption and demand in the security layer ecosystem.
What factors influence FORT token price movements?
FORT token price is influenced by market sentiment, trading volume, technological developments, and user adoption rates. Network activity and ecosystem growth also impact price dynamics.
What is Forta and what problem does it solve?
Forta is a decentralized monitoring network that provides real-time threat detection for web3 systems. It solves security challenges by identifying attacks and vulnerabilities in blockchain applications before they cause damage.
What are the risks of investing in FORT?
FORT investment carries market volatility risk, liquidity risk, regulatory uncertainty, and technology risk. Price fluctuations can be significant. Economic conditions and project developments may impact token value substantially.
Share
Content
Introduction: Market Position and Investment Value of FORT
I. FORT Price History Review and Current Market Status
II. Core Factors Affecting FORT's Future Price
Three、2025-2030 FORT Price Forecast
IV. FORT Professional Investment Strategy and Risk Management
V. FORT Potential Risks and Challenges
VI. Conclusion and Action Recommendations
FAQ
How to Buy Cryptocurrency


Trending Cryptocurrencies


Latest Analysis and Investment Outlook for Chainlink Price in June 2025

LMWR vs AAVE: Understanding the Linguistic Debate Between Language Minority Ways of Reading and African American Vernacular English
Is Vaulta (A) a good investment?: Analyzing the potential and risks of this emerging cryptocurrency

2025 DCB Price Prediction: Analyzing Market Trends and Potential Growth Factors
Is Decubate (DCB) a good investment?: Analyzing the Potential and Risks of this Emerging Cryptocurrency
Is Debox (BOX) a Good Investment?: Analyzing Growth Potential and Risks in the Web3 Storage Market

What is TOKE: A Comprehensive Guide to Understanding Token Economics and Digital Assets

What is XNY: A Comprehensive Guide to Understanding Its Applications and Significance in Modern Technology

What is MSQ: A Comprehensive Guide to Message Queue Systems and Their Real-World Applications

What is SIX: A Comprehensive Guide to Understanding the Significance and Applications of This Numerical Value

Exploring Longinus: Can Heritage Tokens Drive DeFi Expansion?