2025 EDEN Price Prediction: Expert Analysis and Market Forecast for the Coming Year

Introduction: EDEN's Market Position and Investment Value
OpenEden (EDEN) operates as a leading real-world asset (RWA) tokenization platform, renowned for its unmatched focus on regulatory standards and advanced financial technology. Since its inception in 2022, OpenEden has established itself as a bridge between traditional and decentralized finance through regulated entities in the BVI and Bermuda. As of December 2025, EDEN's market capitalization has reached $66.82 million, with a circulating supply of approximately 183.87 million tokens, and the price currently maintains around $0.0668. This asset, recognized for its "compliance-first" approach to tokenization, is playing an increasingly critical role in reshaping financial access through decentralized on-chain channels.
This article will comprehensively analyze EDEN's price trajectory through 2030, combining historical patterns, market supply and demand dynamics, ecosystem development, and macroeconomic factors to provide investors with professional price forecasts and practical investment strategies.
EDEN Price History Review and Market Status
I. EDEN Price Historical Trajectory and Current Market Situation
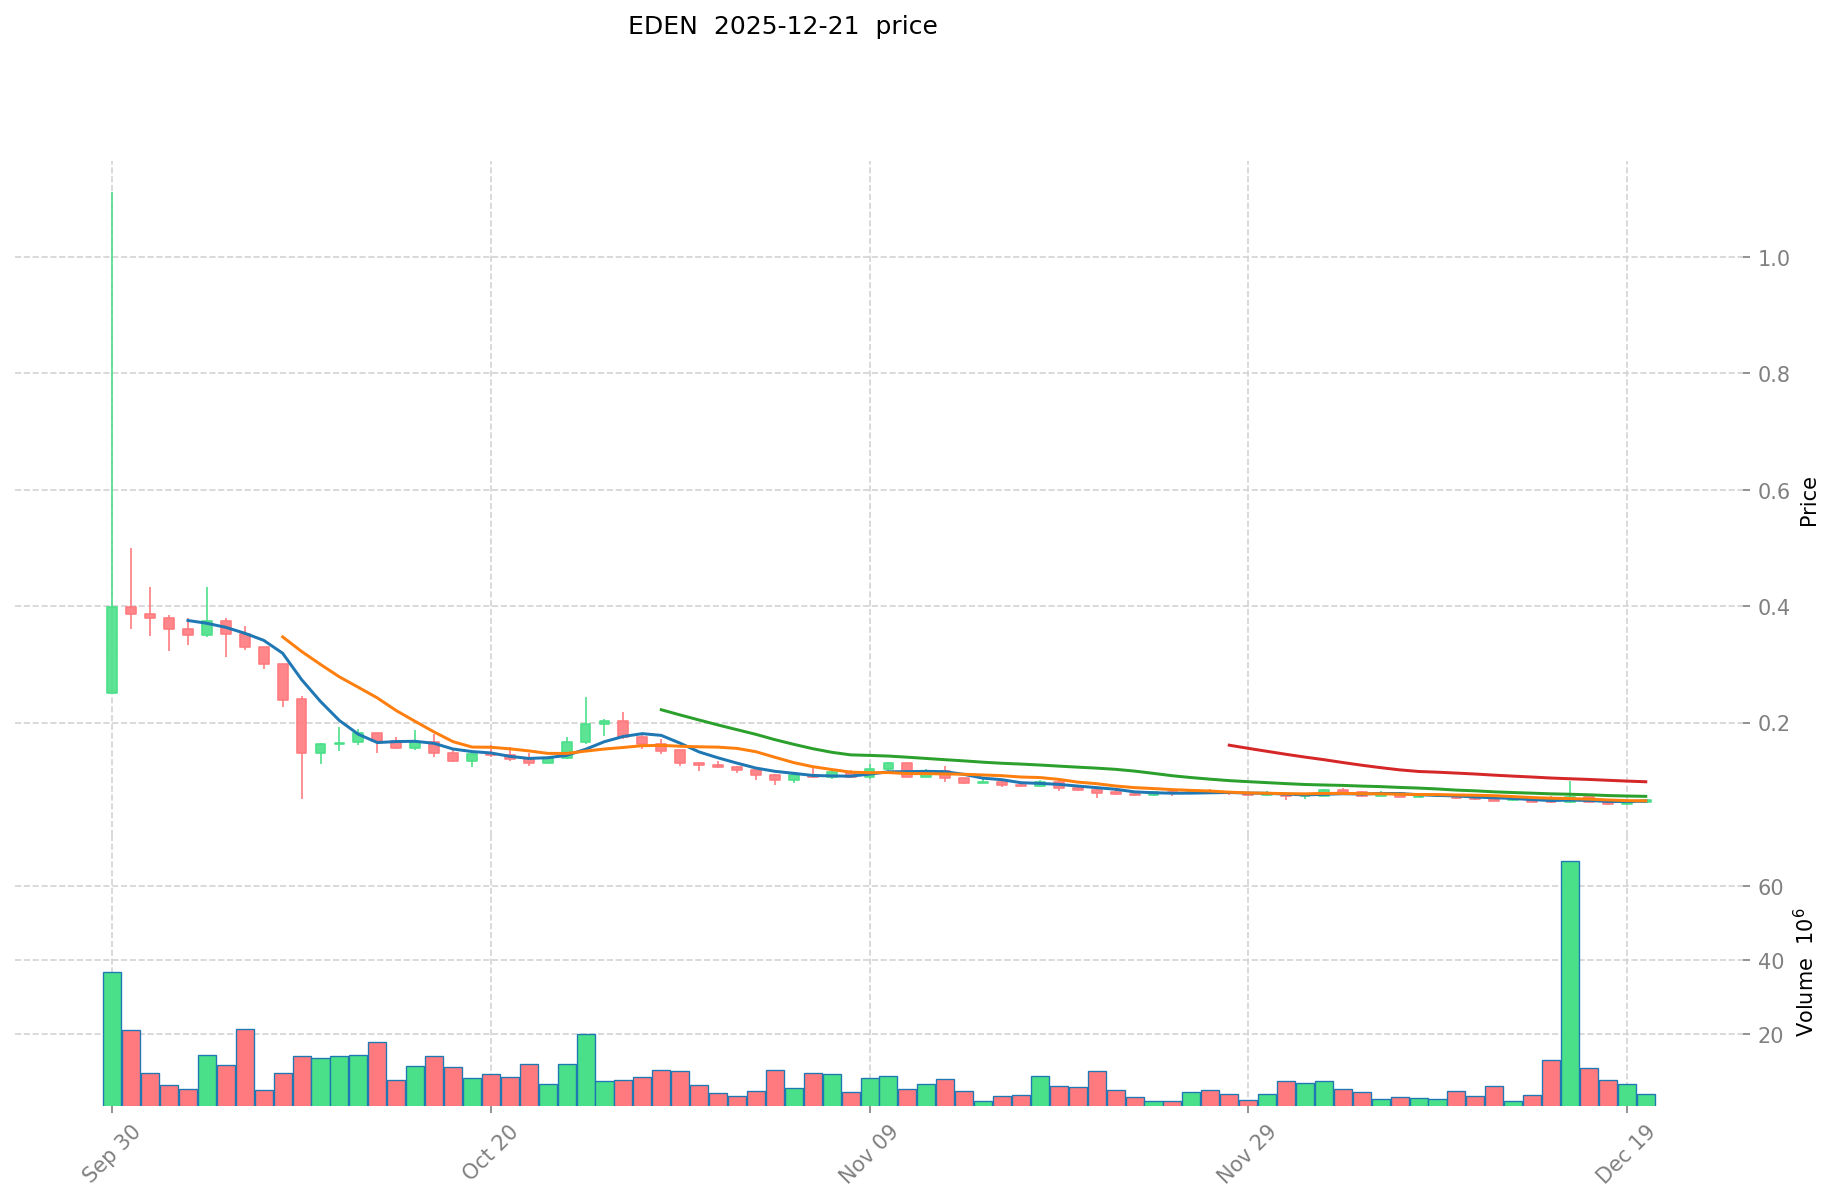
EDEN Historical Price Movement
EDEN reached its all-time high (ATH) of $1.1123 on September 30, 2025, marking the peak of market enthusiasm for the token. Following this peak, the token entered a significant correction phase throughout October and November 2025. By December 18, 2025, EDEN hit its all-time low (ATL) of $0.0576, representing a decline of approximately 94.82% from its historical peak, reflecting the severe market downturn during this period.
EDEN Current Market Status
As of December 21, 2025, EDEN is trading at $0.06682, demonstrating a modest recovery from its recent low. The token exhibits the following characteristics:
Price Performance:
- Current price: $0.06682
- 24-hour change: +3.26% ($0.002110 increase)
- 1-hour change: +0.8%
- 7-day change: +1.52%
- 30-day change: -12.24%
- Year-to-date change: -93.39%
Market Metrics:
- Market capitalization: $12,286,193.4 USD
- Fully diluted valuation (FDV): $66,820,000 USD
- Market cap to FDV ratio: 18.39%
- Circulating supply: 183,870,000 EDEN (18.39% of total supply)
- Total supply: 1,000,000,000 EDEN
- 24-hour trading volume: $365,401.54 USD
- Current market ranking: 1,075
Trading Range (24-hour):
- High: $0.06907
- Low: $0.06346
The token is distributed across 5,198 token holders and is available on 22 exchanges. EDEN operates on both Ethereum (ETH) and Binance Smart Chain (BSC) networks, with contract addresses on both chains enabling cross-chain accessibility for users.
Click to view current EDEN market price
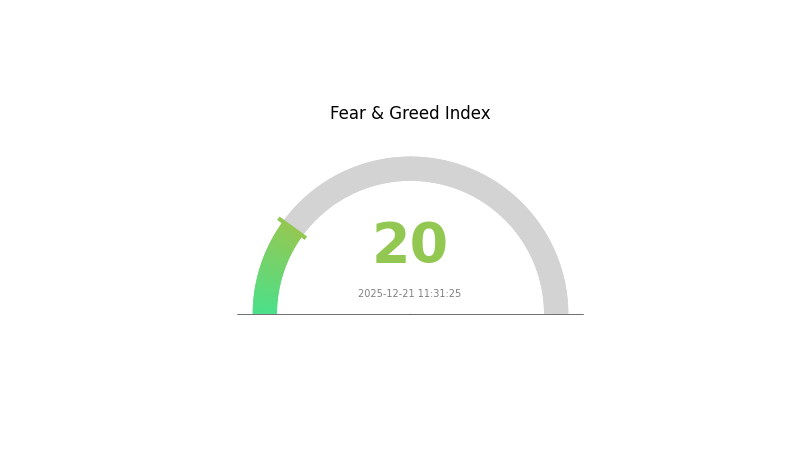
EDEN Market Sentiment Index
2025-12-21 Fear and Greed Index: 20 (Extreme Fear)
Click to view current Fear & Greed Index
The crypto market is currently experiencing extreme fear, with the Fear and Greed Index at 20. This indicates significant pessimism among investors, reflecting concerns about market volatility and uncertainty. During such periods, seasoned traders often view extreme fear as a potential buying opportunity, as markets historically rebound from these lows. However, investors should remain cautious and conduct thorough research before making investment decisions. Gate.com provides real-time market sentiment analysis to help you navigate these challenging market conditions.
EDEN Holdings Distribution
An address holdings distribution chart illustrates how token supplies are allocated across different wallet addresses on the blockchain. This metric is crucial for assessing the decentralization level of a project, identifying potential concentration risks, and understanding the tokenomics structure. By analyzing the top holders and their respective percentages, stakeholders can gauge market vulnerability to large-scale liquidations or coordinated movements that could significantly impact price stability.
EDEN's current holdings distribution reveals a notably concentrated ownership structure. The top holder commands 37.95% of total supply, while the combined holdings of the top five addresses account for approximately 85.46% of all tokens in circulation. This level of concentration presents a meaningful centralization concern. The second-largest holder alone controls 20.49%, and the third holds 13.02%, creating a three-tier concentration pattern where the top three addresses collectively represent over 71% of the token supply. Such distribution patterns are characteristic of projects in earlier development stages or those with significant allocations reserved for core teams, strategic investors, or ecosystem initiatives.
This concentrated holdings structure carries notable implications for market dynamics. The presence of three mega-holders creates potential liquidity risks and price volatility vulnerability, as coordinated movements or large selloffs from these addresses could exert substantial downward pressure on token value. The relatively modest "Others" category at 14.54% further emphasizes the centralization concern. While the distributed nature of blockchain ensures immutability and transparency of these holdings, the current concentration levels suggest that EDEN's market structure remains heavily dependent on the actions and confidence of a select few stakeholders, indicating the token has yet to achieve substantial decentralization comparable to mature network projects.
Click to view current EDEN holdings distribution
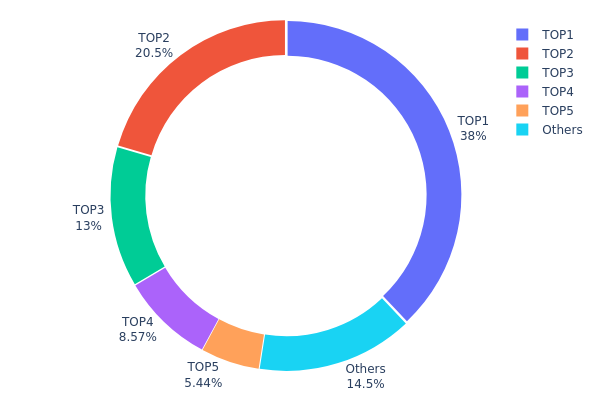
| Top | Address | Holding Qty | Holding (%) |
|---|---|---|---|
| 1 | 0x80aa...0afbe8 | 352800.00K | 37.95% |
| 2 | 0x7ffd...d5ec66 | 190559.64K | 20.49% |
| 3 | 0x7e6c...65af23 | 121038.88K | 13.02% |
| 4 | 0xad11...d7e7ff | 79666.67K | 8.56% |
| 5 | 0xf64b...7263cc | 50616.66K | 5.44% |
| - | Others | 134946.08K | 14.54% |
II. Core Factors Affecting EDEN's Future Price
Community Participation and Market Sentiment
-
Community-Driven Valuation: EDEN's price movement is primarily influenced by community participation and cultural trends rather than technical or economic fundamentals. The token's value is largely shaped by social engagement and market sentiment.
-
Short-Term Price Volatility: Short-term price fluctuations may be influenced by staking opportunities and reward mechanisms. As staking rewards become available, increased participation can create temporary price movements driven by incentive structures rather than underlying utility.
-
Market Speculation: The token's price trajectory is significantly affected by market speculation and investor sentiment. Unlike tokens with strong use cases or institutional adoption, EDEN relies heavily on speculative trading dynamics and cultural momentum.
Note: The provided materials lack sufficient information to complete sections on supply mechanisms, institutional dynamics, macroeconomic factors, and technological development for EDEN. These sections have been omitted accordingly.
III. 2025-2030 EDEN Price Forecast
2025 Outlook
- Conservative Forecast: $0.05675 - $0.06677
- Neutral Forecast: $0.06677 (average level)
- Optimistic Forecast: $0.06877 (range peak)
2026-2028 Mid-term Outlook
- Market Stage Expectation: Gradual recovery and consolidation phase with incremental growth momentum
- Price Range Forecast:
- 2026: $0.05557 - $0.09556
- 2027: $0.04165 - $0.10453
- 2028: $0.07075 - $0.10334
- Key Catalysts: Ecosystem development expansion, increased institutional adoption, market sentiment recovery, and protocol upgrades
2029-2030 Long-term Outlook
- Base Case Scenario: $0.08250 - $0.09822 (sustained ecosystem growth and gradual market maturation)
- Optimistic Scenario: $0.09822 - $0.10509 (accelerated adoption and positive regulatory environment)
- Transformative Scenario: $0.10776 (breakthrough technological innovation and mainstream market integration)
- December 21, 2025: EDEN trading activity monitoring across Gate.com (current market observation point)
| 年份 | 预测最高价 | 预测平均价格 | 预测最低价 | 涨跌幅 |
|---|---|---|---|---|
| 2025 | 0.06877 | 0.06677 | 0.05675 | 0 |
| 2026 | 0.09556 | 0.06777 | 0.05557 | 1 |
| 2027 | 0.10453 | 0.08166 | 0.04165 | 22 |
| 2028 | 0.10334 | 0.0931 | 0.07075 | 39 |
| 2029 | 0.10509 | 0.09822 | 0.0825 | 46 |
| 2030 | 0.10776 | 0.10166 | 0.06709 | 52 |
OpenEden (EDEN) Professional Investment Strategy and Risk Management Report
IV. EDEN Professional Investment Strategy and Risk Management
EDEN Investment Methodology
(1) Long-term Holding Strategy
- Suitable Investors: Those seeking exposure to RWA tokenization growth, institutional investors, and compliance-focused crypto participants
- Operational Recommendations:
- Build positions gradually over 6-12 months to average entry costs, as RWA market adoption accelerates
- Hold through market cycles while EDEN develops its ecosystem and expands regulatory partnerships
- Reinvest any protocol rewards or ecosystem distributions to compound long-term returns
(2) Active Trading Strategy
- Technical Analysis Tools:
- Support/Resistance Levels: Monitor key levels at $0.07-$0.08 resistance and $0.06-$0.065 support zones based on recent price action
- Volume Analysis: Track 24-hour trading volume patterns on Gate.com to identify momentum shifts in the $365K daily volume baseline
- Wave Trading Key Points:
- Capitalize on the current 3.26% 24-hour price momentum during uptrend phases
- Establish take-profit targets at 5-10% gains given the token's 1.52% weekly volatility
EDEN Risk Management Framework
(1) Asset Allocation Principles
- Conservative Investors: 1-3% portfolio allocation maximum
- Aggressive Investors: 5-10% portfolio allocation
- Professional Investors: 10-15% portfolio allocation with hedging strategies
(2) Risk Hedging Solutions
- Dollar-Cost Averaging (DCA): Deploy fixed amounts monthly to minimize timing risk in a volatile 24-hour market
- Diversification Strategy: Balance EDEN holdings with other established RWA projects and traditional crypto assets to reduce concentration risk
(3) Secure Storage Solutions
- Hot Wallet Option: Gate.com Web3 Wallet for active trading and frequent transactions with built-in security features
- Cold Storage Approach: Transfer long-term holdings to non-custodial wallets for enhanced security against exchange hacks
- Security Considerations: Enable two-factor authentication on trading accounts, use unique passwords, regularly audit wallet permissions, and never share private keys or seed phrases
V. EDEN Potential Risks and Challenges
EDEN Market Risk
- Price Volatility: EDEN has experienced extreme volatility with -93.39% year-over-year decline and -12.24% monthly downtrend, indicating high market sensitivity to sentiment shifts
- Liquidity Risk: With 22 exchange listings and $365K daily volume, trading depth may be insufficient for large institutional orders, potentially causing slippage
- Market Adoption Risk: Success depends on mainstream adoption of RWA tokenization, which remains in early stages and faces institutional hesitation
EDEN Regulatory Risk
- Jurisdictional Uncertainty: While OpenEden maintains compliant entities in BVI and Bermuda, the global regulatory framework for RWA tokenization remains evolving and fragmented
- Compliance Changes: Sudden regulatory shifts in major markets could impact token utility and trading access without warning
- Cross-Border Restrictions: Future regulations may limit token trading or holding in certain jurisdictions, reducing addressable market
EDEN Technology Risk
- Smart Contract Vulnerabilities: RWA platforms require complex contracts linking on-chain and off-chain systems, introducing potential security vectors
- Platform Dependency: EDEN's value is tied to OpenEden's operational success; technical failures or security breaches would directly impact token value
- Blockchain Scalability: Transactions across multiple chains (Ethereum, BSC) introduce latency and potential failure points in asset bridging
VI. Conclusion and Action Recommendations
EDEN Investment Value Assessment
OpenEden operates in the promising RWA tokenization sector with strong regulatory positioning and a bridge between traditional and decentralized finance. However, the 18.39% circulating supply ratio and -93.39% year-over-year performance reflect both early-stage market dynamics and significant downside risk. The token's market capitalization of $12.3M relative to its $66.8M fully diluted valuation suggests limited token distribution but substantial dilution potential. For risk-aware investors, EDEN presents a speculative opportunity in the RWA growth narrative, though near-term volatility and regulatory uncertainty pose considerable challenges.
EDEN Investment Recommendations
✅ Beginners: Start with 1-2% portfolio allocation through Gate.com's spot trading, use dollar-cost averaging monthly, hold in the secure Gate.com Web3 Wallet, and avoid leverage trading
✅ Experienced Investors: Consider 5-8% allocation with technical analysis-based wave trading, establish clear take-profit levels at 8-12% gains, monitor RWA sector developments for trend shifts, and implement stop-loss orders at 10-15% below entry
✅ Institutional Investors: Conduct thorough due diligence on OpenEden's compliance infrastructure, diversify RWA exposure across multiple platforms, use hedging strategies to manage downside risk, and maintain ongoing regulatory compliance monitoring
EDEN Trading Participation Methods
- Spot Trading on Gate.com: Simple buy-and-hold strategy with direct custody options available
- Dollar-Cost Averaging: Automated recurring purchases to reduce timing risk and average acquisition cost over time
- Technical Trading: Active management using support/resistance levels with risk management stops for disciplined position control
Cryptocurrency investment carries extreme risk and potential for total loss. This report does not constitute investment advice. Investors must conduct thorough due diligence and assess their personal risk tolerance before participating. Consult professional financial advisors before making investment decisions. Never invest more capital than you can afford to lose completely.
FAQ
What is the future of Eden coin?
Eden coin shows promising growth potential driven by increasing adoption and market demand. Price projections indicate steady appreciation, with forecasts suggesting EDEN could reach $0.01237 by May 2026. The project's development roadmap and community engagement support long-term value growth.
What factors influence EDEN token price?
EDEN token price is influenced by market sentiment, trading volume, technological developments, and user adoption rates. Supply and demand dynamics, broader crypto market trends, and ecosystem growth also significantly impact its valuation.
What is EDEN coin and what is its use case?
EDEN coin represents two innovative projects: OpenEden for tokenizing real-world assets, and Eden Network for enhancing Ethereum transparency and addressing MEV challenges. It symbolizes dual innovation in decentralized finance and blockchain infrastructure.
Is EDEN a good investment for long-term holders?
EDEN is a strong long-term investment choice. It demonstrates steady growth potential with experienced leadership driving the project forward. Currently positioned as an undervalued asset with solid fundamentals for sustained appreciation.
How does EDEN compare to other similar projects in the market?
EDEN distinguishes itself through superior tokenomics, robust ecosystem integration, and innovative governance features. Unlike competitors, EDEN offers enhanced utility, stronger community adoption, and sustainable growth mechanisms that position it as a market leader in the cryptocurrency space.
Share
Content
Introduction: EDEN's Market Position and Investment Value
I. EDEN Price Historical Trajectory and Current Market Situation
II. Core Factors Affecting EDEN's Future Price
III. 2025-2030 EDEN Price Forecast
IV. EDEN Professional Investment Strategy and Risk Management
V. EDEN Potential Risks and Challenges
VI. Conclusion and Action Recommendations
FAQ
How to Buy Cryptocurrency


Trending Cryptocurrencies


Where to Find Alpha in the 2025 Crypto Spot Market

why is crypto crashing and will it recover ?

Gate Launchpad Welcomes Ika (IKA): The Future of Privacy Computing on Sui

Pi to GBP: Price and Prediction

2025 CHZ Price Prediction: Will Chiliz Soar to New Heights in the Crypto Sports Market?

2025 BRETTPrice Prediction: Analyzing Future Market Trends, Challenges, and Growth Potential
Comprehensive Guide to Investing in New Cryptocurrencies

Understanding Crypto Token Basics for Beginners

Unlocking Passive Income: Fairstake Launchpool Guide
Spur Protocol Daily Quiz Answer Today 22 december 2025

Dropee Question of the Day for 22 december 2025