Trade
Trading Type
Spot
Trade crypto freely
Alpha
Points
Get promising tokens in streamlined on-chain trading
Pre-Market
Trade new tokens before they are officially listed
Margin
Magnify your profit with leverage
Convert & Block Trading
0 Fees
Trade any size with no fees and no slippage
Leveraged Tokens
Get exposure to leveraged positions simply
Futures
Futures
Hundreds of contracts settled in USDT or BTC
Options
HOT
Trade European-style vanilla options
Unified Account
Maximize your capital efficiency
Demo Trading
Futures Kickoff
Get prepared for your futures trading
Futures Events
Participate in events to win generous rewards
Demo Trading
Use virtual funds to experience risk-free trading
Earn
Launch
CandyDrop
Collect candies to earn airdrops
Launchpool
Quick staking, earn potential new tokens
HODLer Airdrop
Hold GT and get massive airdrops for free
Launchpad
Be early to the next big token project
Alpha Points
NEW
Trade on-chain assets and enjoy airdrop rewards!
Futures Points
NEW
Earn futures points and claim airdrop rewards
Investment
Simple Earn
Earn interests with idle tokens
Auto-Invest
Auto-invest on a regular basis
Dual Investment
Buy low and sell high to take profits from price fluctuations
Soft Staking
Earn rewards with flexible staking
Crypto Loan
0 Fees
Pledge one crypto to borrow another
Lending Center
One-stop lending hub
VIP Wealth Hub
Customized wealth management empowers your assets growth
Private Wealth Management
Customized asset management to grow your digital assets
Quant Fund
Top asset management team helps you profit without hassle
Staking
Stake cryptos to earn in PoS products
BTC Staking
HOT
Stake BTC and earn 10% APR
GUSD Minting
Use USDT/USDC to mint GUSD for treasury-level yields

More
UnlimitedCryptoTrading
No content yet
UnlimitedCryptoTrading
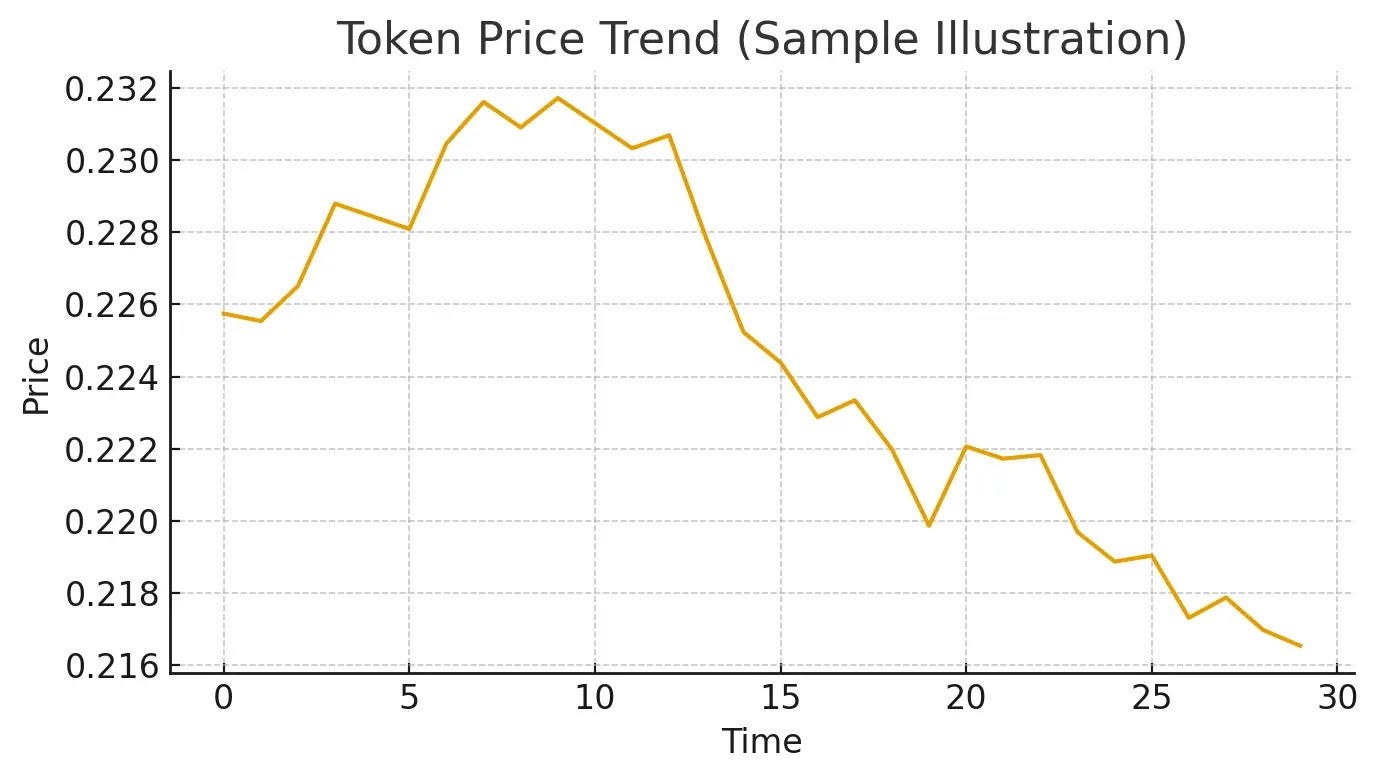
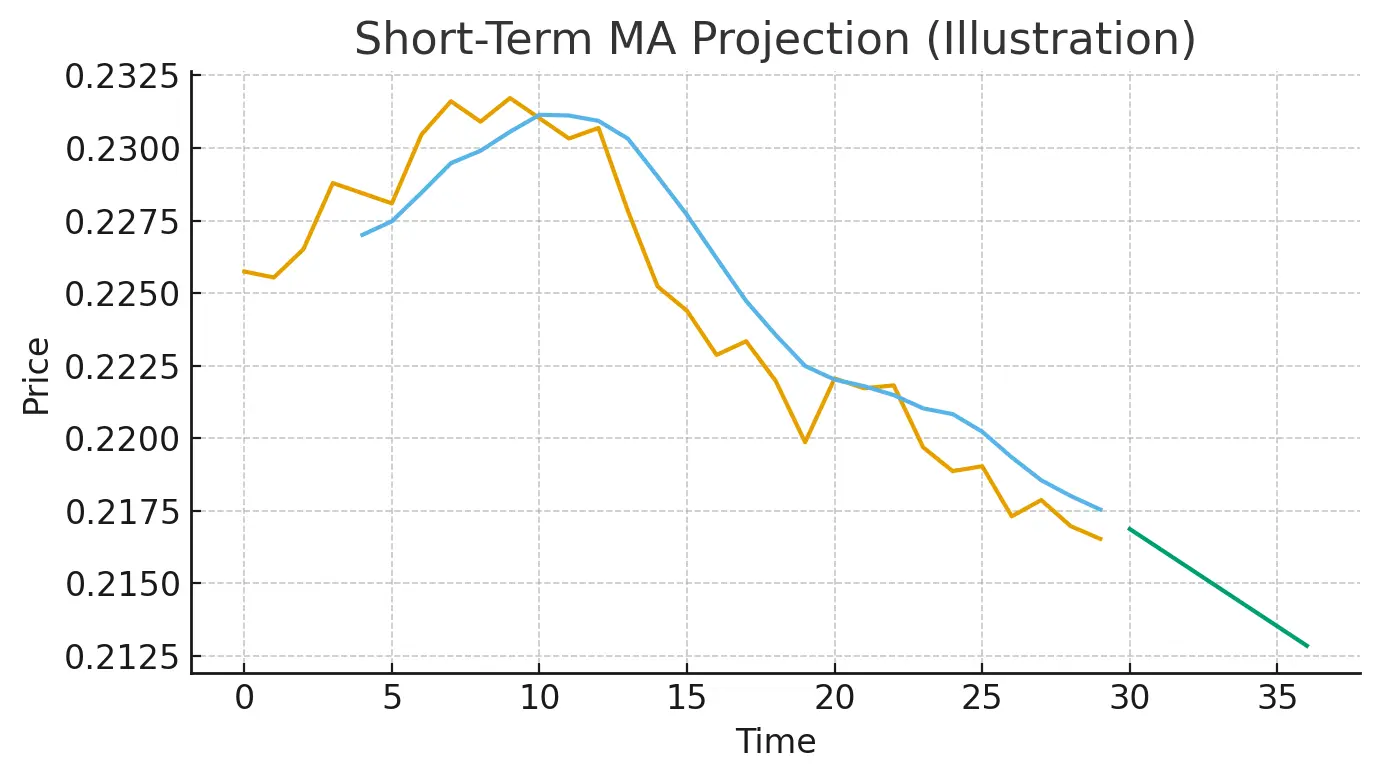
📉 PI/USDT Market Update — Simple Breakdown
The market has been moving in a tight range, and PI is trying to hold above the 0.22 zone. Volume is steady, but momentum indicators are still mixed, which means the market hasn’t chosen a strong direction yet.
What I’m seeing now:
Price is mostly moving sideways after yesterday’s drop
RSI is sitting around the mid-40s → neither overbought nor oversold
MA lines are still close together → no strong trend yet
Small pullback pressure but buyers are defending the lower range
📌 Short-Term View
If the price can stay above 0.223, we might see another push
PI-0.39%
- Reward
- 1
- Comment
- Repost
- Share
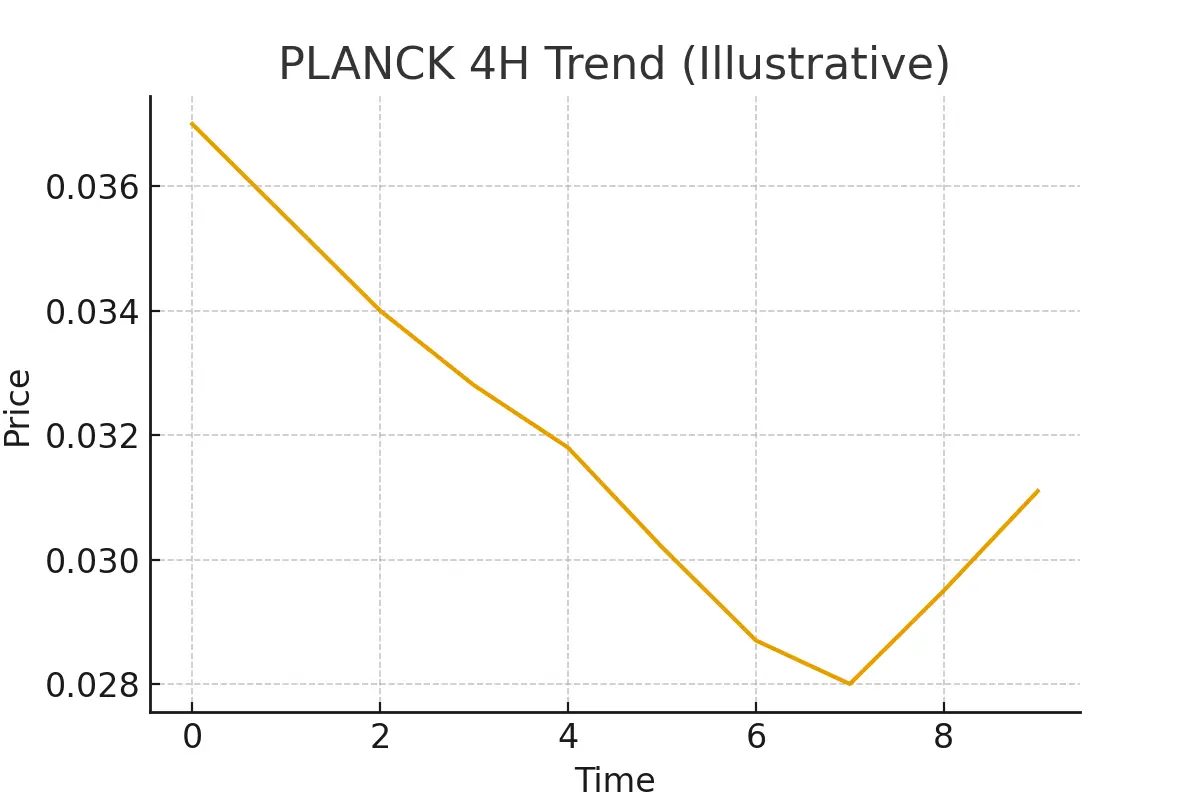
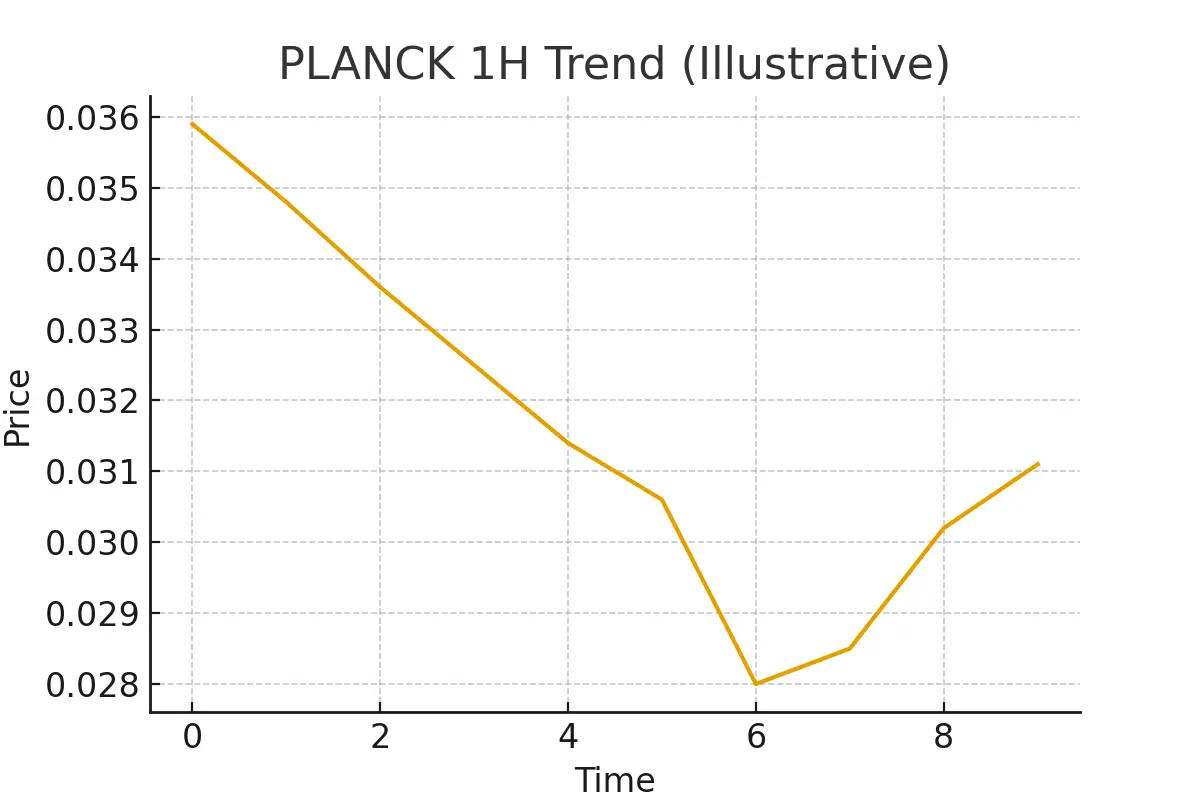
PLANCK Market Update
PLANCK finally showed some strength after a long drop. Buyers stepped in near the bottom, and the price moved up smoothly, breaking back above the short-term moving averages. Momentum looks better now, and indicators are showing a healthier recovery.
On the 1H timeframe, the trend is climbing slowly. Pullbacks are light, and buyers are still active around the support zones.
On the 4H timeframe, the bigger trend is starting to shift from a downtrend to a possible early reversal. If the price holds above the recent support, it may continue this steady climb.
Short-Term: Mild
PLANCK7.46%
- Reward
- like
- Comment
- Repost
- Share
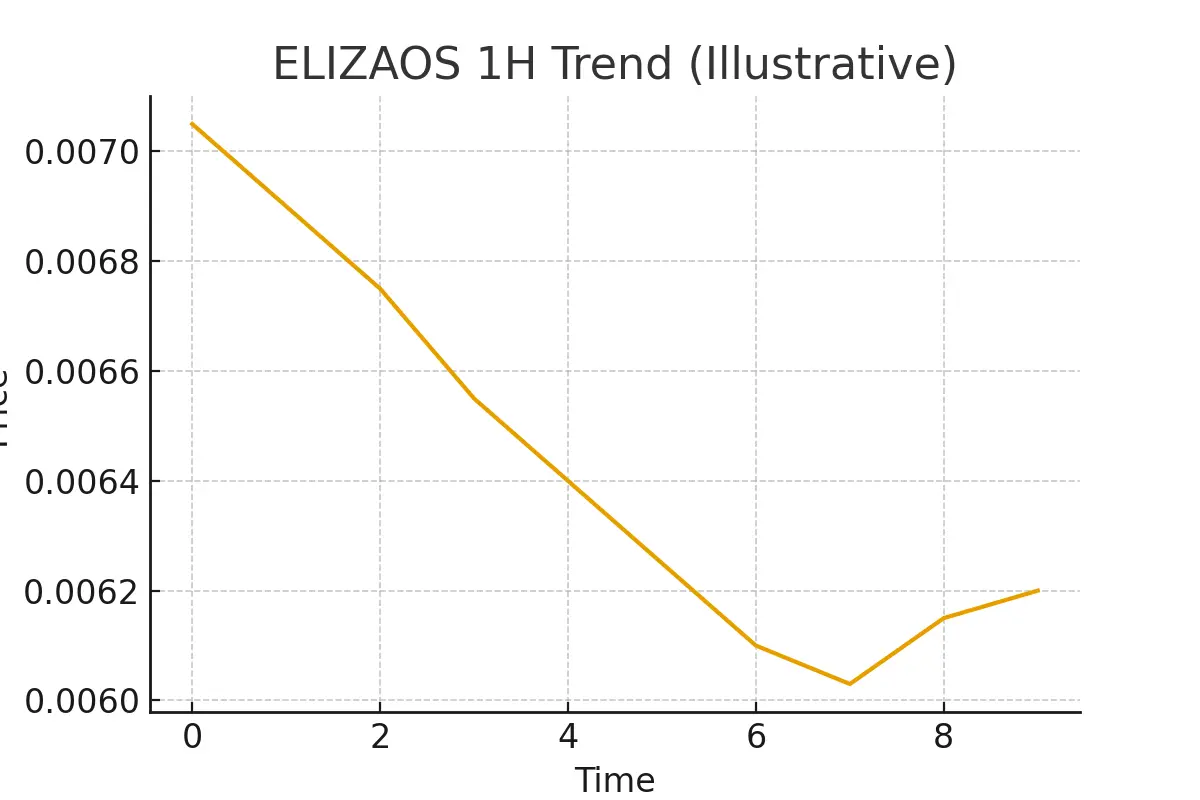
ELIZAOS Market Update
The chart has been sliding down for a while, but the last few candles show the price trying to slow down near support. Both the moving averages and indicators are still pointing to a weak trend, but the selling pressure looks lighter than before.
On the 1H view, the price is trying to hold above the recent low, showing small attempts from buyers. It’s not strong yet, but the market looks calmer than yesterday.
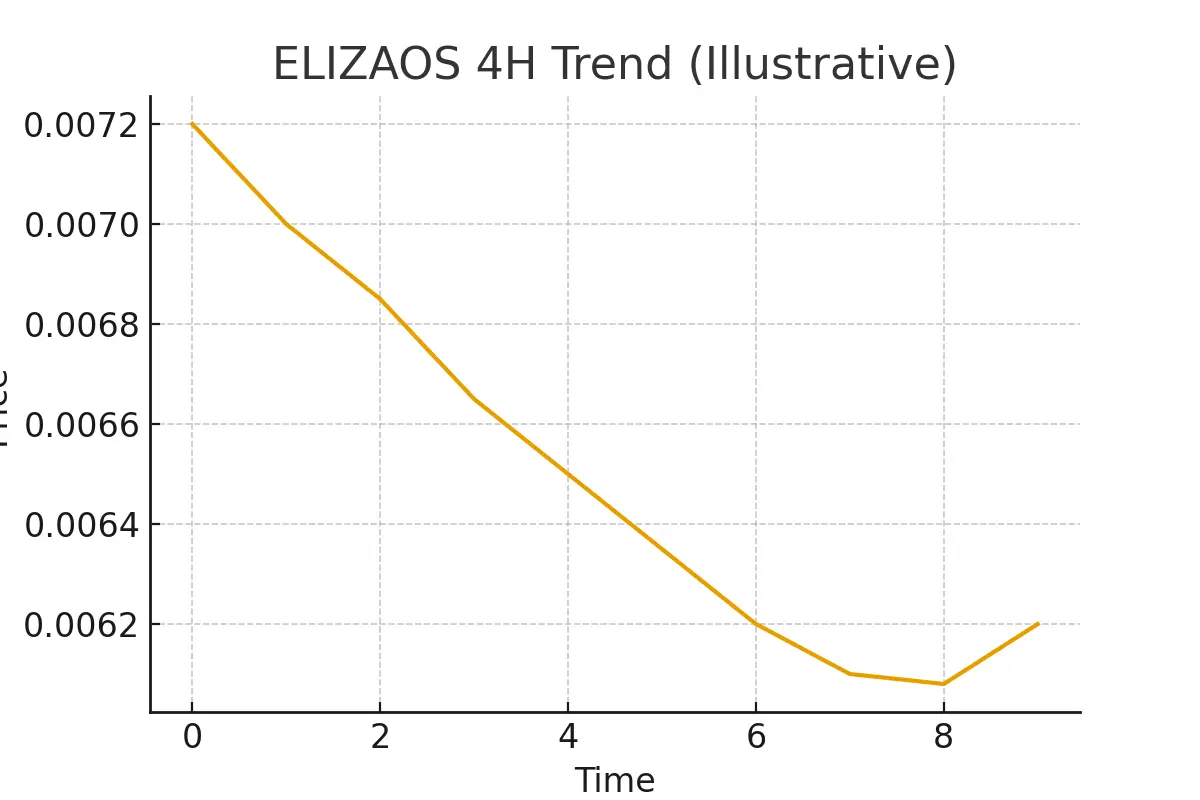
On the 4H view, the overall trend is still down, but the momentum is losing speed. If the support continues to hold, the market might try a small bounce. If not, it
The chart has been sliding down for a while, but the last few candles show the price trying to slow down near support. Both the moving averages and indicators are still pointing to a weak trend, but the selling pressure looks lighter than before.
On the 1H view, the price is trying to hold above the recent low, showing small attempts from buyers. It’s not strong yet, but the market looks calmer than yesterday.
On the 4H view, the overall trend is still down, but the momentum is losing speed. If the support continues to hold, the market might try a small bounce. If not, it
ELIZAOS-1.96%
- Reward
- like
- Comment
- Repost
- Share
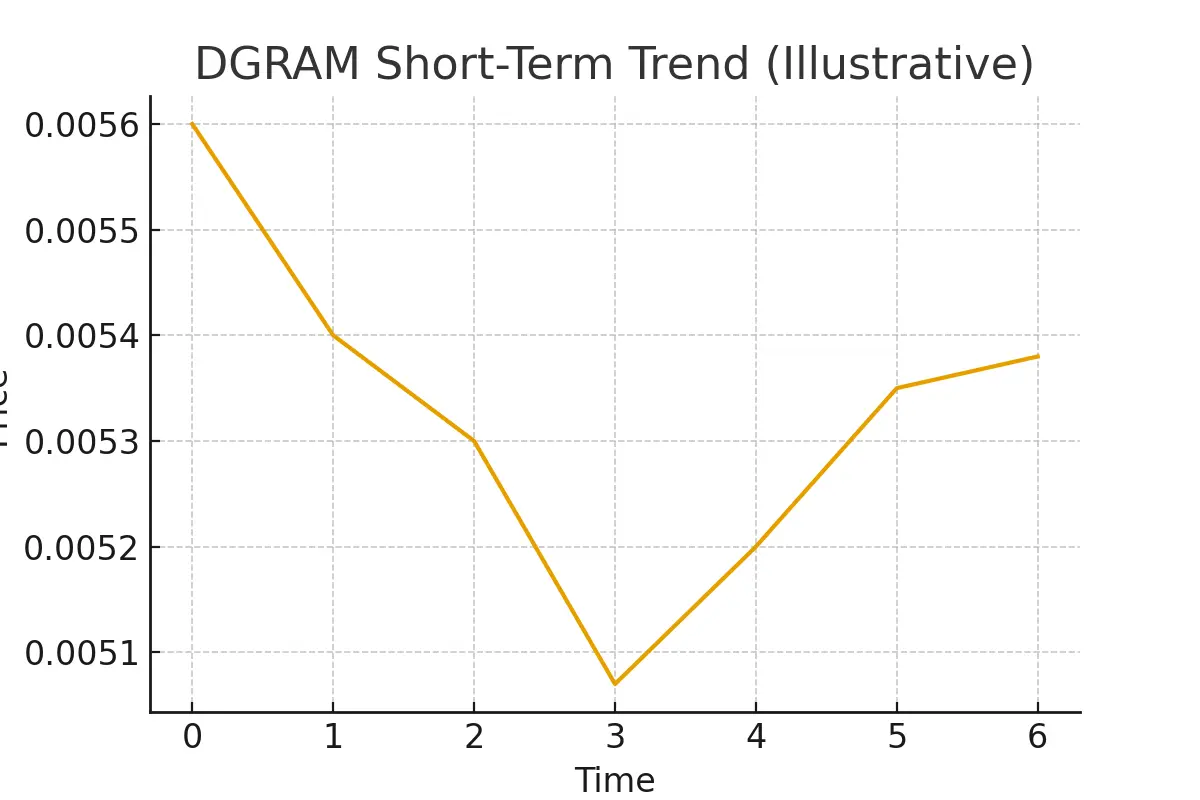
DGRAM Market Update
DGRAM is moving in a calm range after a long dip, and the chart is starting to look more stable. Buyers stepped in a few times, lifting the price from the recent bottom. The candles are now sitting close to the moving averages, which usually means the market is getting ready for a direction.
In the short-term frame, DGRAM is slowly pushing upward from its weak zone. The small bumps in price show early signs of buyers returning, though the momentum is still soft.
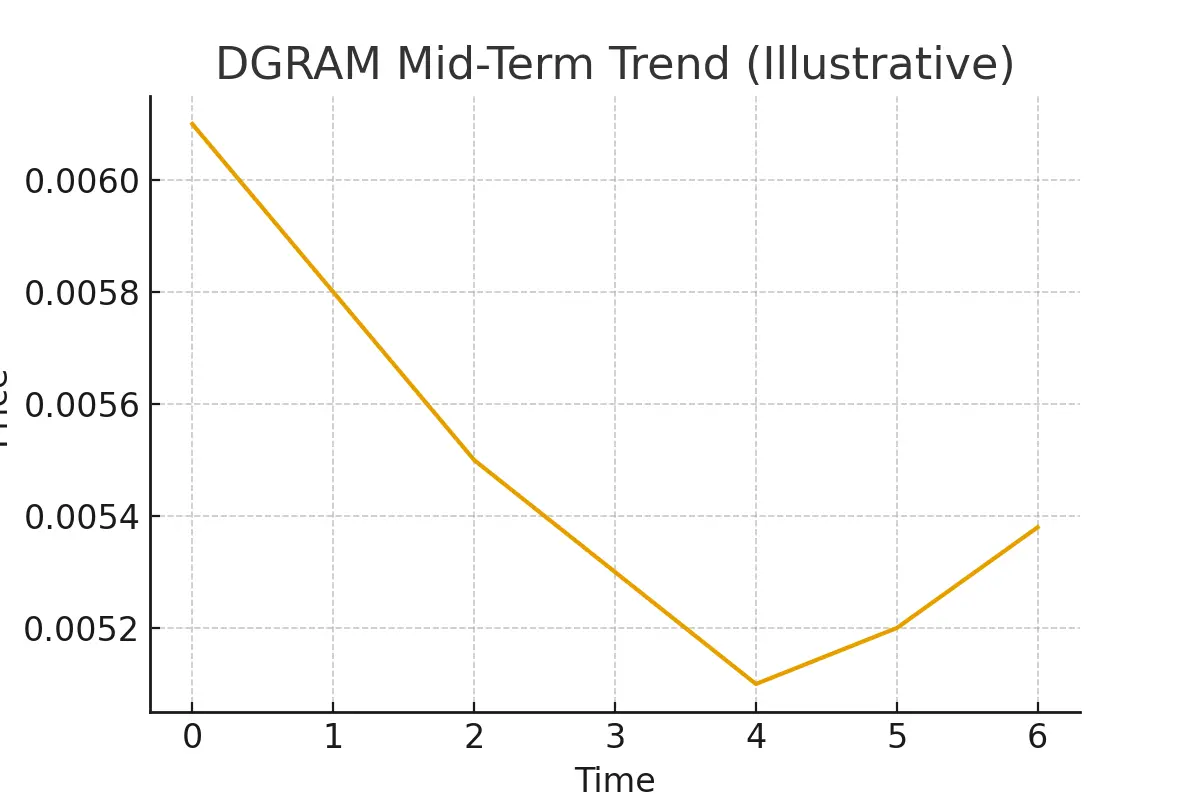
In the mid-term view, the downtrend has slowed down a lot. If the price continues to hold above its recent suppor
DGRAM is moving in a calm range after a long dip, and the chart is starting to look more stable. Buyers stepped in a few times, lifting the price from the recent bottom. The candles are now sitting close to the moving averages, which usually means the market is getting ready for a direction.
In the short-term frame, DGRAM is slowly pushing upward from its weak zone. The small bumps in price show early signs of buyers returning, though the momentum is still soft.
In the mid-term view, the downtrend has slowed down a lot. If the price continues to hold above its recent suppor
DGRAM2.92%
- Reward
- like
- Comment
- Repost
- Share
GAIB Market Update
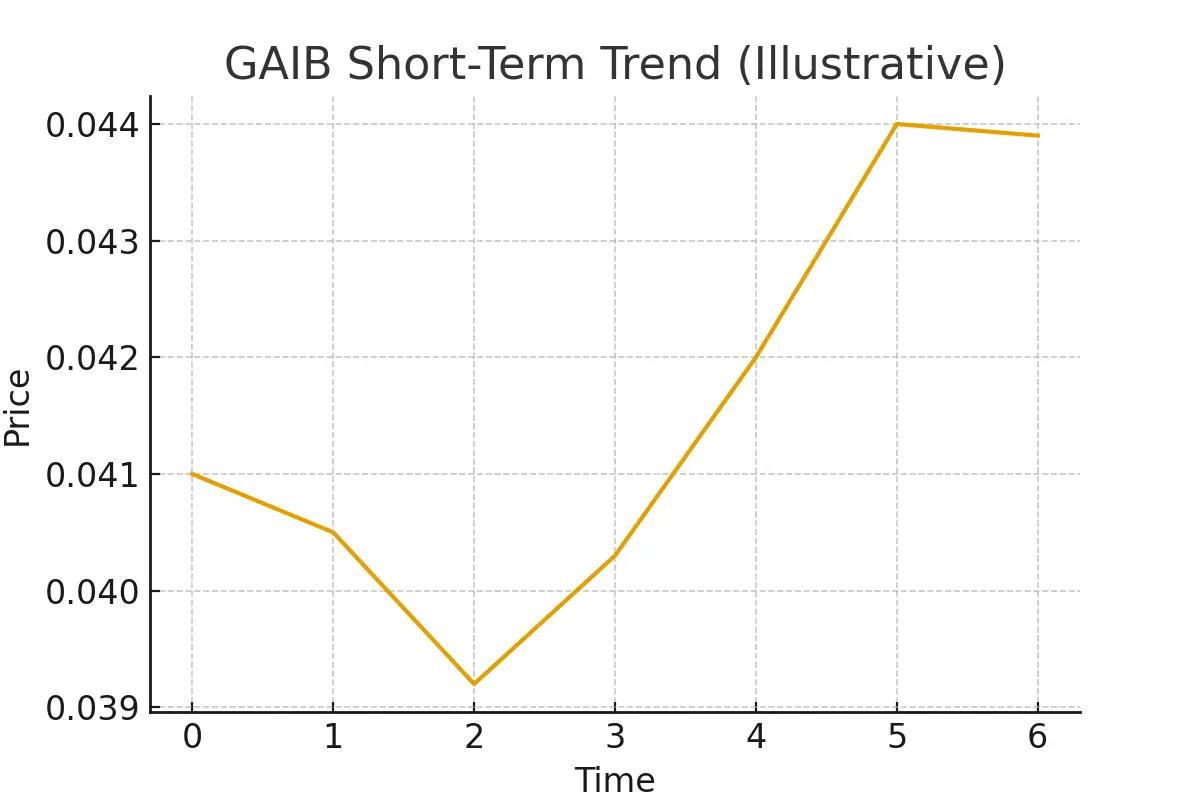
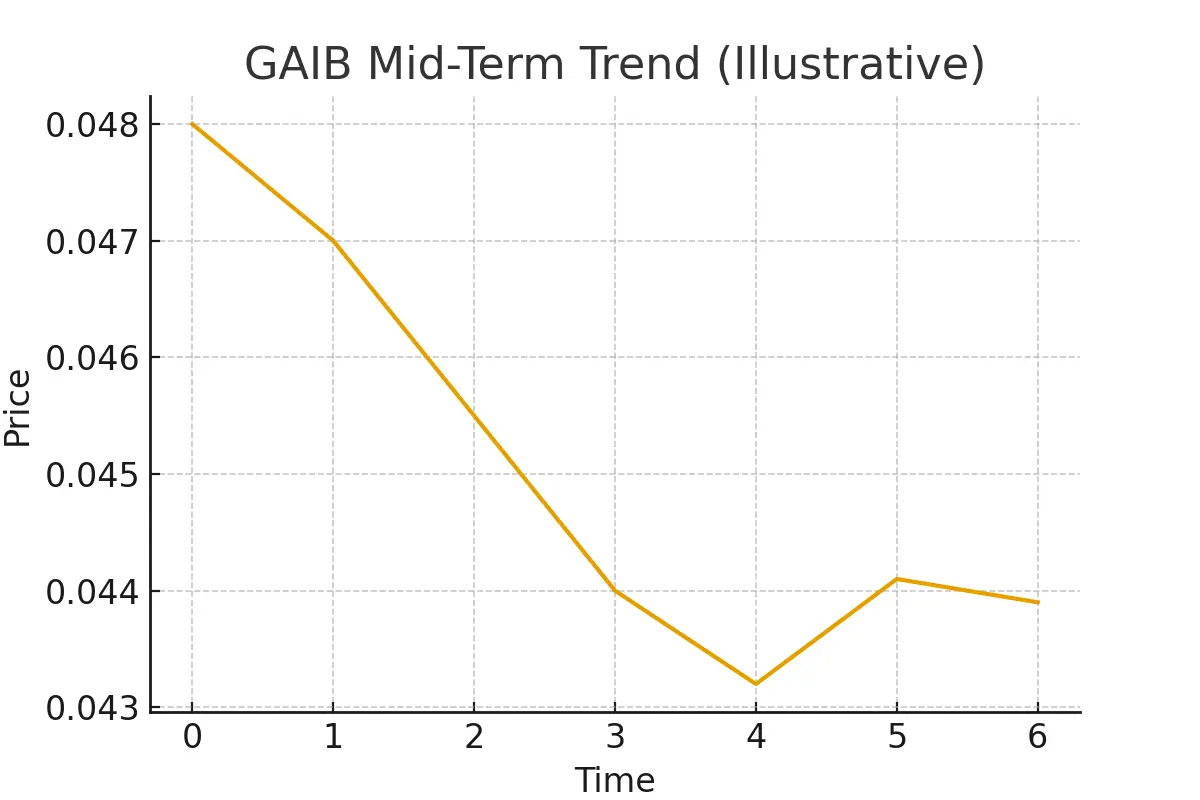
GAIB showed a clean bounce after hitting the recent low, and momentum is slowly coming back. Buyers stepped in strongly, which pushed the price up before cooling off again. Right now, the market looks like it’s trying to build a new support zone.
On the short-term view, the candles are moving tightly around the moving averages, which usually means the market is preparing for its next move. If buying pressure holds, GAIB may try to retest the recent spike zone again.
The mid-term structure looks smoother. The trend is still recovering from the dip, but the indicators are slow
- Reward
- 1
- Comment
- Repost
- Share
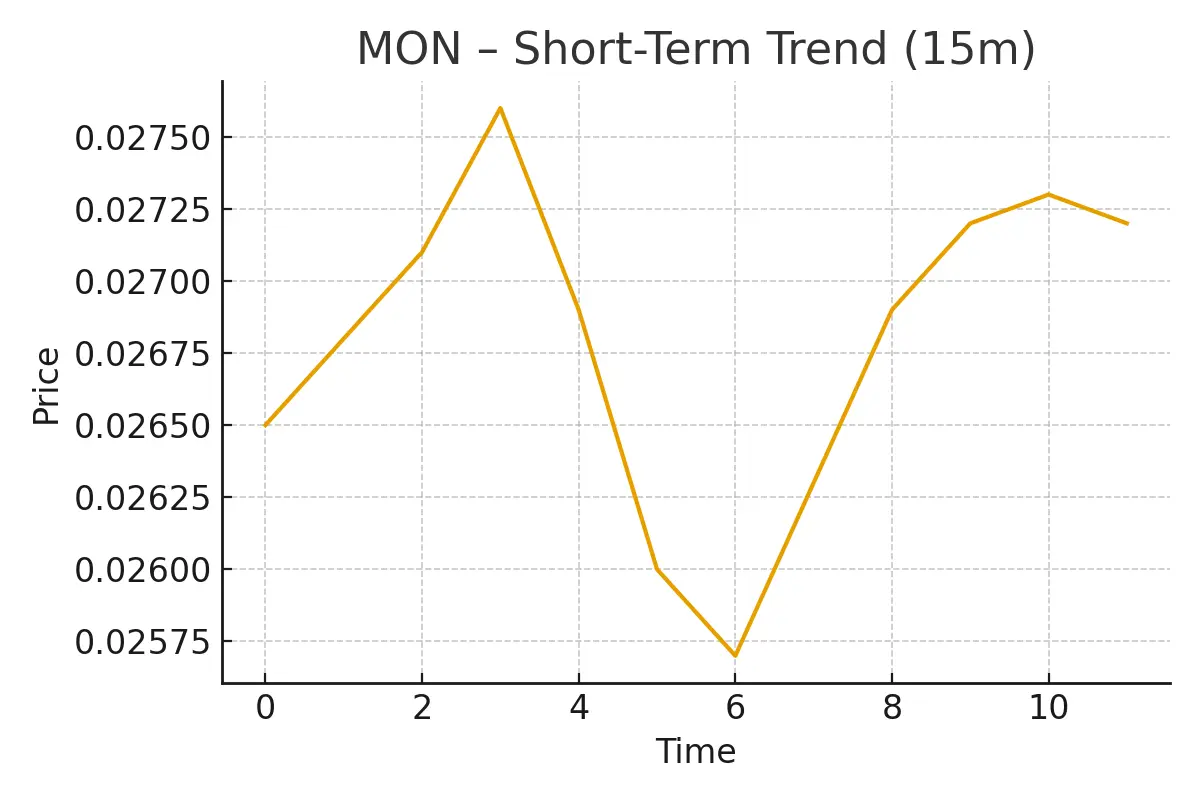
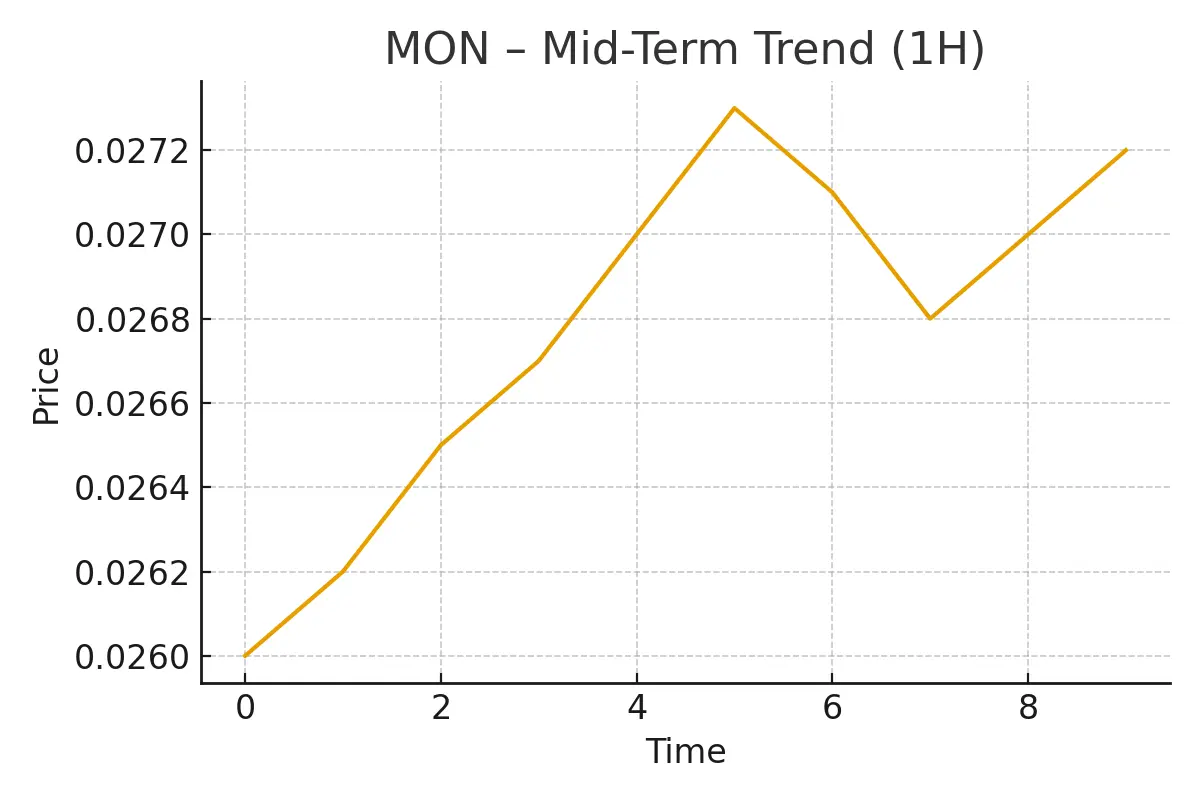
MON Market Update
MON is slowly recovering after a heavy dip, and the price is trying to build a stable base again. The candles are staying closer to the moving averages, which usually hints that the market is calming down and preparing for the next move.
On the 15-minute chart, MON is showing short bursts of buying pressure. Each pullback is getting a little weaker, which often means buyers are trying to take control again.
On the 1-hour chart, the trend looks smoother. As long as MON holds above its recent bottom zone, it may try another gradual push upward. If momentum strengthens, we could
MON-0.47%
- Reward
- 1
- Comment
- Repost
- Share
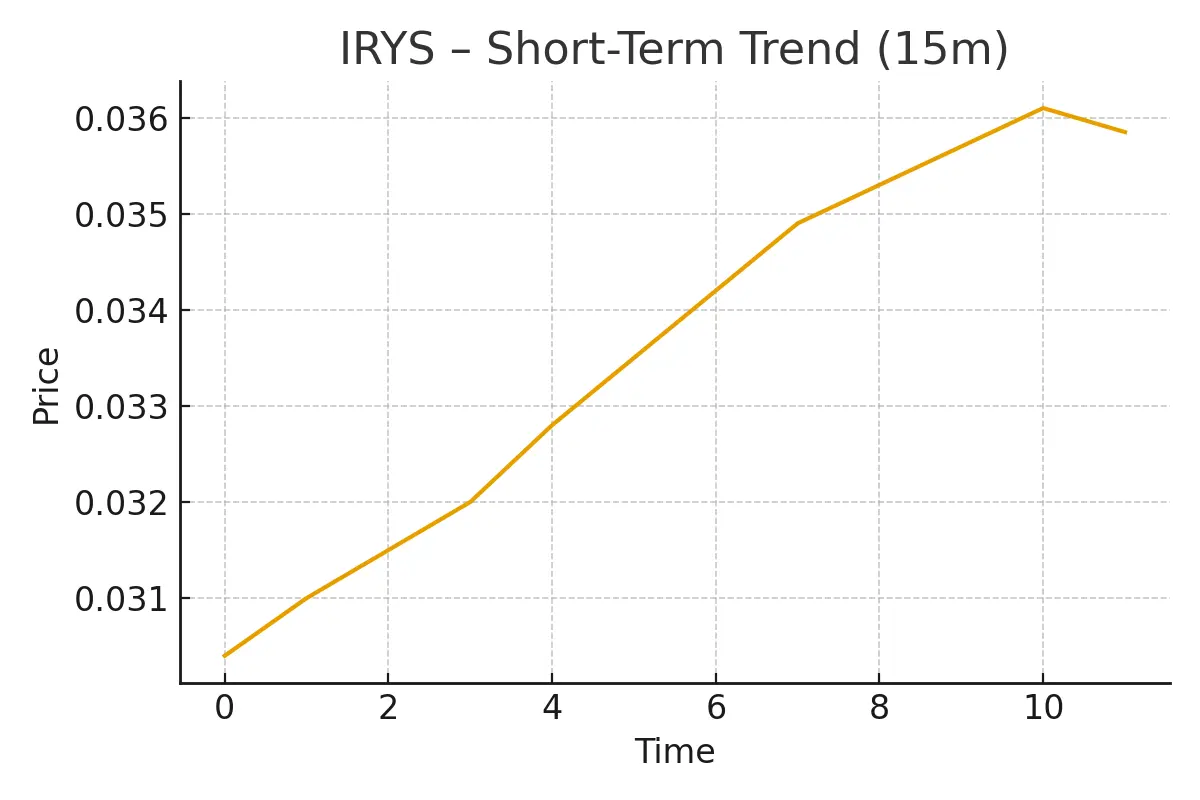
$IRYS IRYS Market Update
IRYS showed a clean breakout after holding a steady base for a while. Buyers stepped in strongly, pushing the price up with solid momentum on the short-term chart. The candles are riding above the moving averages, which usually shows strength is still active.
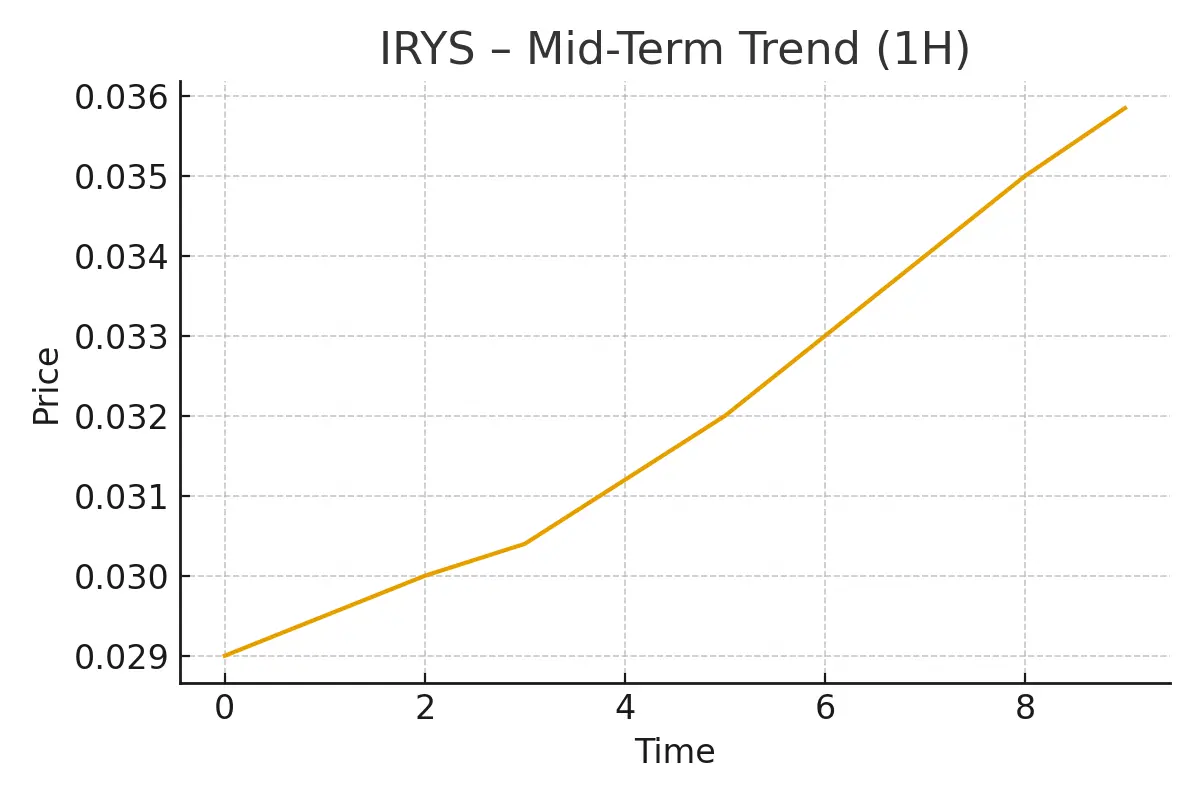
On the higher timeframe, IRYS is forming a smoother uptrend with gradual higher lows. As long as the market protects its recent support area, the trend can continue slowly upward. If momentum stays steady, IRYS might attempt another move toward the recent high zone.
Short-Term (15m):
Sharp push upward with quick
IRYS showed a clean breakout after holding a steady base for a while. Buyers stepped in strongly, pushing the price up with solid momentum on the short-term chart. The candles are riding above the moving averages, which usually shows strength is still active.
On the higher timeframe, IRYS is forming a smoother uptrend with gradual higher lows. As long as the market protects its recent support area, the trend can continue slowly upward. If momentum stays steady, IRYS might attempt another move toward the recent high zone.
Short-Term (15m):
Sharp push upward with quick
- Reward
- like
- Comment
- Repost
- Share
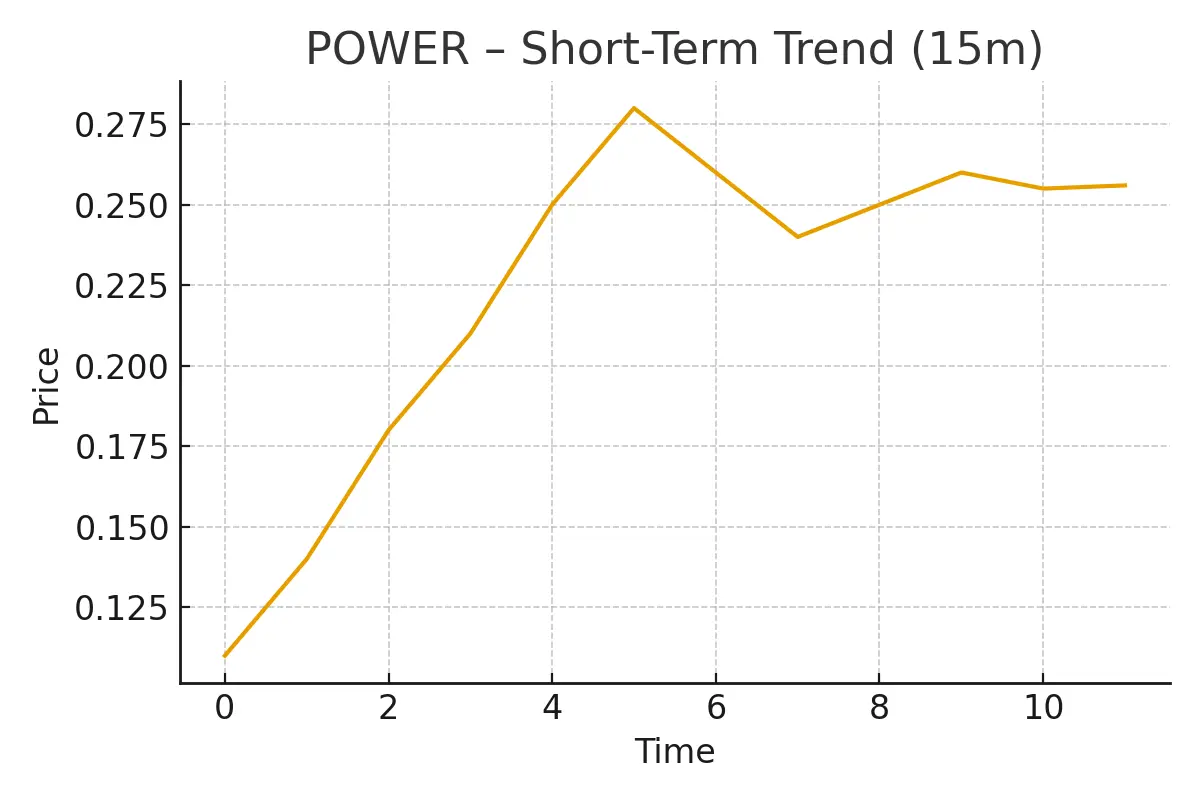
$POWER POWER Market Update
POWER just had a strong breakout and the price is trying to stabilize after a big move. On the short-term chart the momentum is still active — candles are holding above the moving averages, showing buyers are not fully letting go yet.
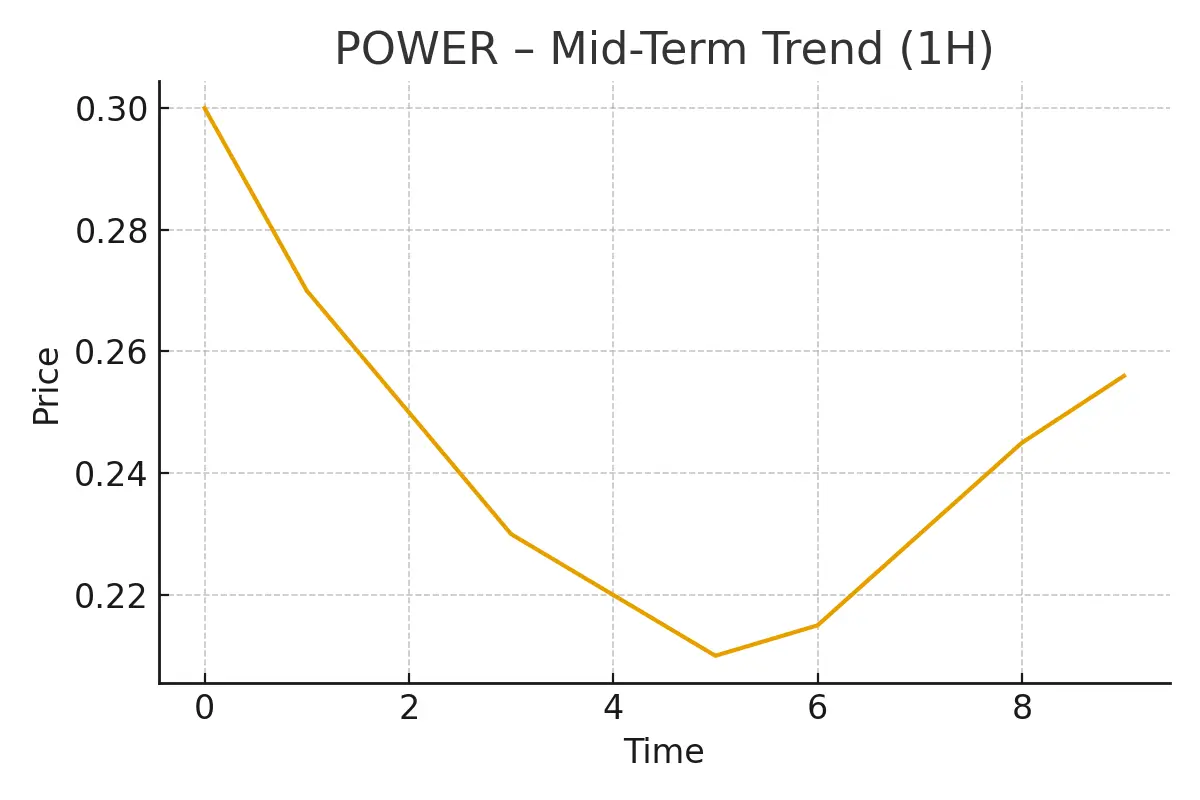
On the bigger timeframe, the token is cooling down but still maintaining higher lows, which usually shows the trend is not finished. If the current support holds, the market might attempt another push.
Short-Term View (15m):
Market is showing a steady climb with quick pullbacks. If the price stays above the recent support zone, a slow
POWER just had a strong breakout and the price is trying to stabilize after a big move. On the short-term chart the momentum is still active — candles are holding above the moving averages, showing buyers are not fully letting go yet.
On the bigger timeframe, the token is cooling down but still maintaining higher lows, which usually shows the trend is not finished. If the current support holds, the market might attempt another push.
Short-Term View (15m):
Market is showing a steady climb with quick pullbacks. If the price stays above the recent support zone, a slow
- Reward
- 1
- Comment
- Repost
- Share
HYPE Market Update
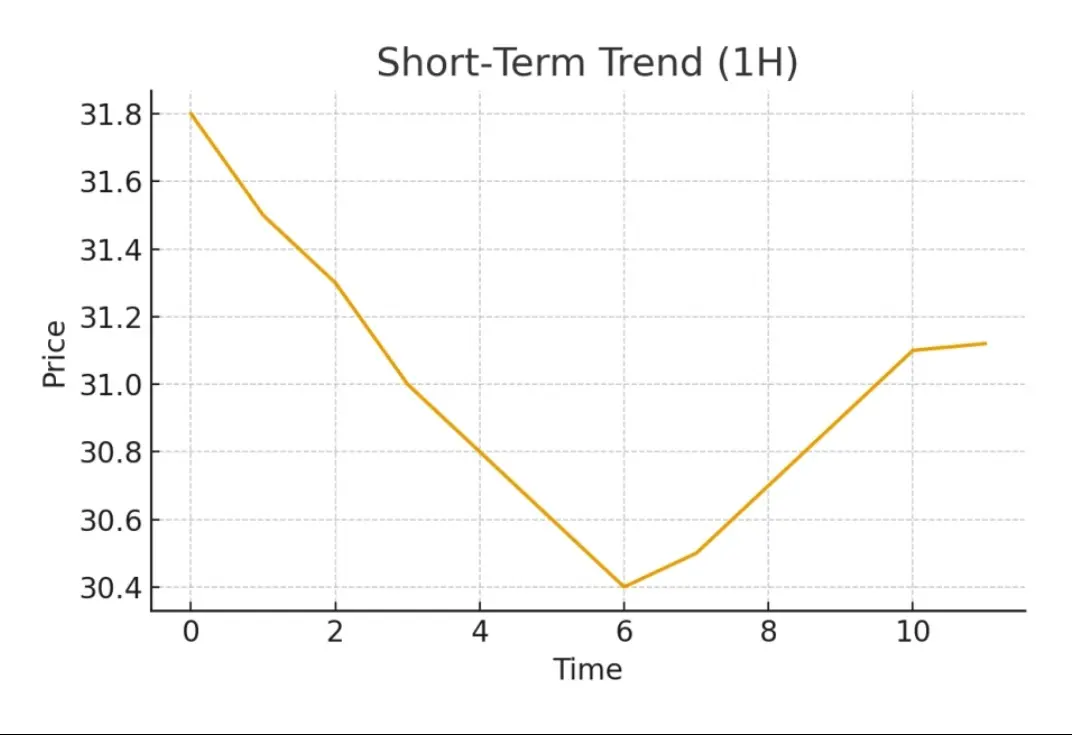
Price is trying to stabilize around the 31 zone after a long pullback. On the short-term chart, the token is showing small bullish attempts and the indicators are slowly turning upward. If this momentum holds, a push toward the next resistance area could happen.
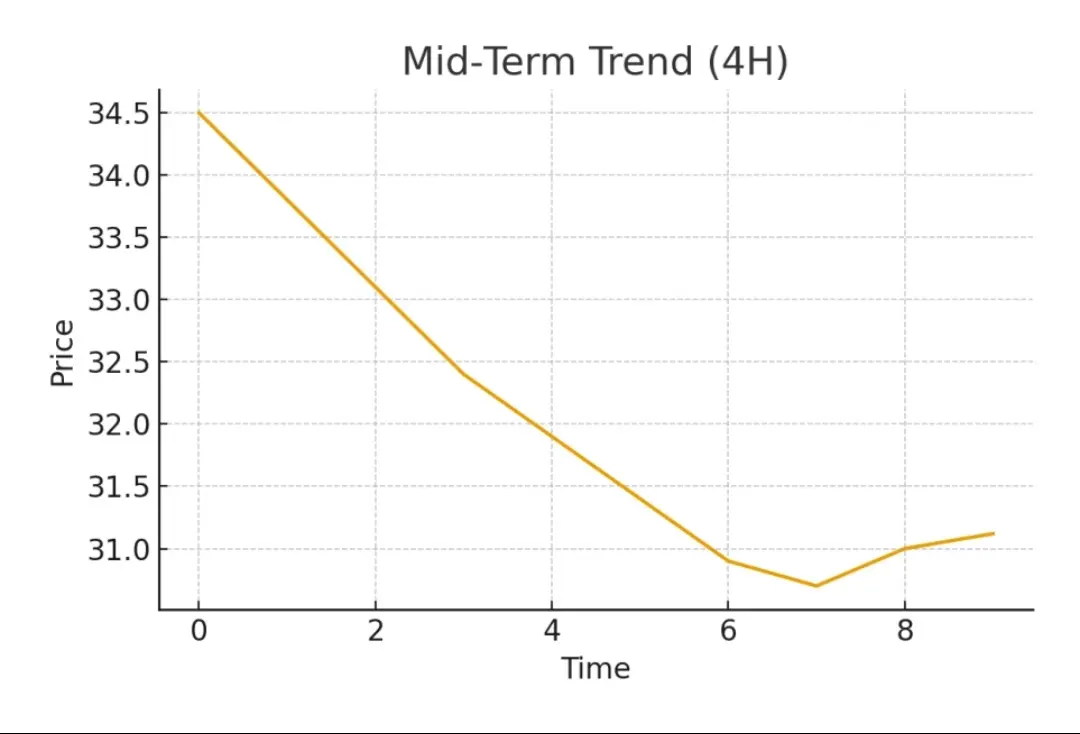
Looking at a bigger timeframe, the downtrend has started to slow down. Momentum indicators are flattening out, which usually suggests the market is preparing for either a recovery bounce or a consolidation phase before choosing direction.
Short-Term Outlook (1H):
If buyers keep stepping in above the 30.8–31 support,
Price is trying to stabilize around the 31 zone after a long pullback. On the short-term chart, the token is showing small bullish attempts and the indicators are slowly turning upward. If this momentum holds, a push toward the next resistance area could happen.
Looking at a bigger timeframe, the downtrend has started to slow down. Momentum indicators are flattening out, which usually suggests the market is preparing for either a recovery bounce or a consolidation phase before choosing direction.
Short-Term Outlook (1H):
If buyers keep stepping in above the 30.8–31 support,
HYPE0.2%
- Reward
- 2
- Comment
- Repost
- Share
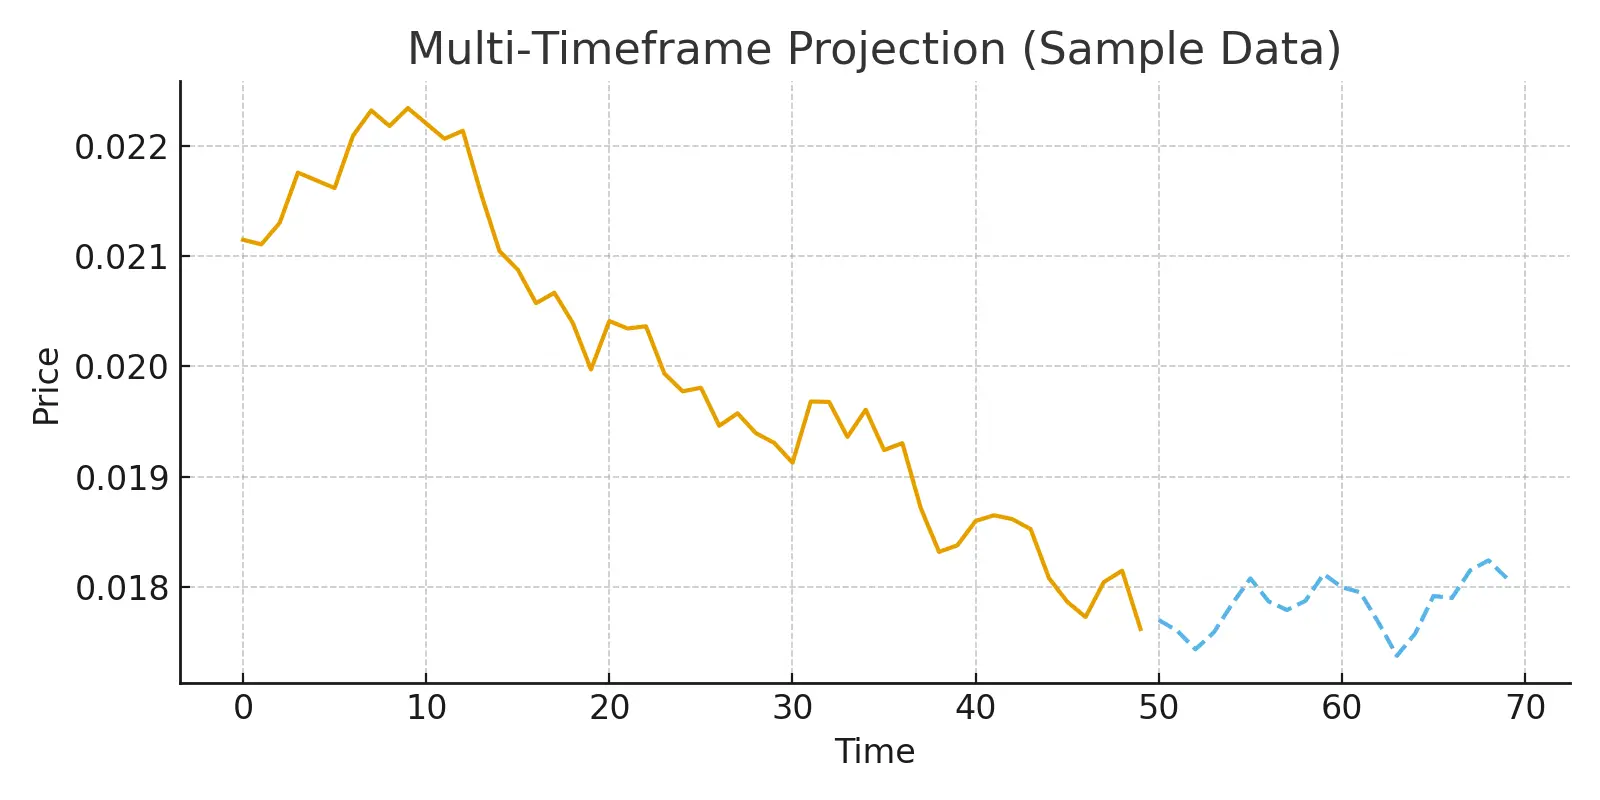
$RLS RLS Update:
Price is showing a nice recovery after touching the 0.018 zone. Buyers stepped in strongly and pushed it back toward the 0.022 area. Short-term trend is still holding above support and indicators are showing steady momentum.
For the next move, I’m watching two things:
• Short timeframe: If it stays above its moving averages, we could see another push toward the recent high area.
• Longer timeframe: As long as the trend holds above support, the structure looks healthy for gradual upside.
This is just my personal view — not financial advice. Always DYOR.
RLS4.61%
- Reward
- 2
- Comment
- Repost
- Share
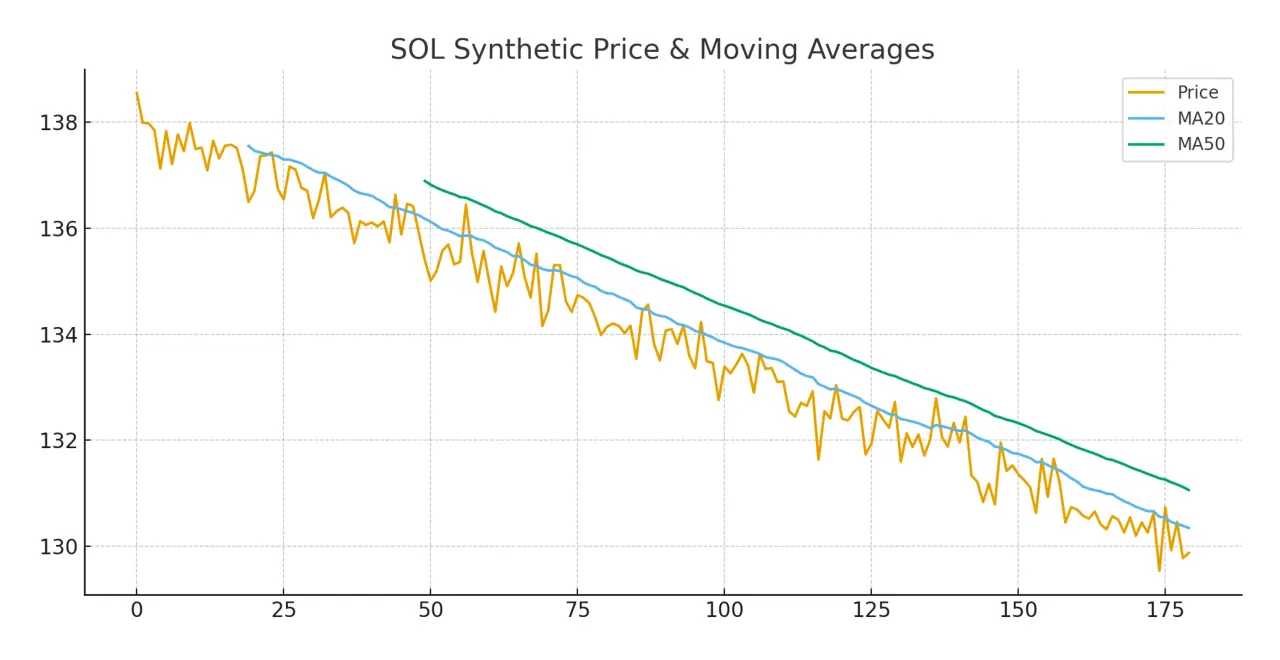
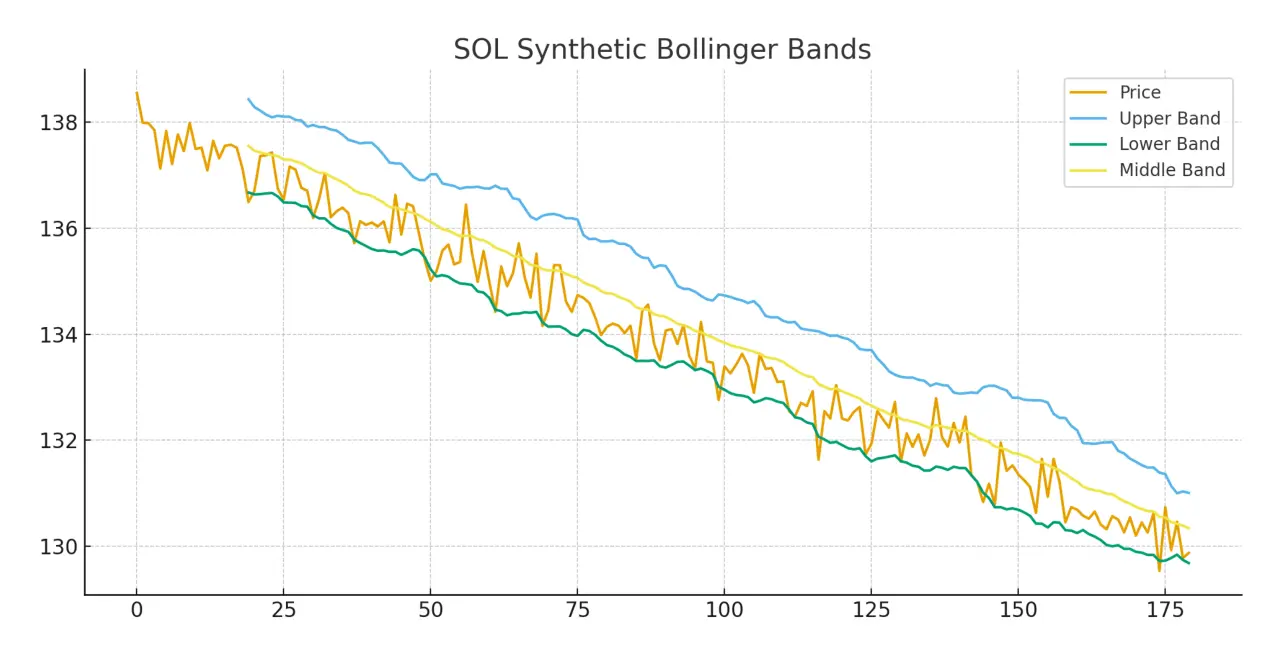
$SOL SOL 1H Quick Market Look
SOL has been moving in a steady downtrend, but the pace of the drop is slowing. Price is sitting near the lower band, showing the market is cooling down after the last move. The MA lines are still pointing slightly downward, meaning the trend hasn’t fully shifted yet — but momentum is flattening out.
Short-Term View (1H)
• Price is holding a tight range after the dip.
• A break above the short MAs could give a small bounce.
• If it slips under the recent support zone, sellers may push again.
Mid-Term View (4H)
Using MA + Bollinger formats, SOL still looks correc
SOL-0.71%
- Reward
- like
- Comment
- Repost
- Share
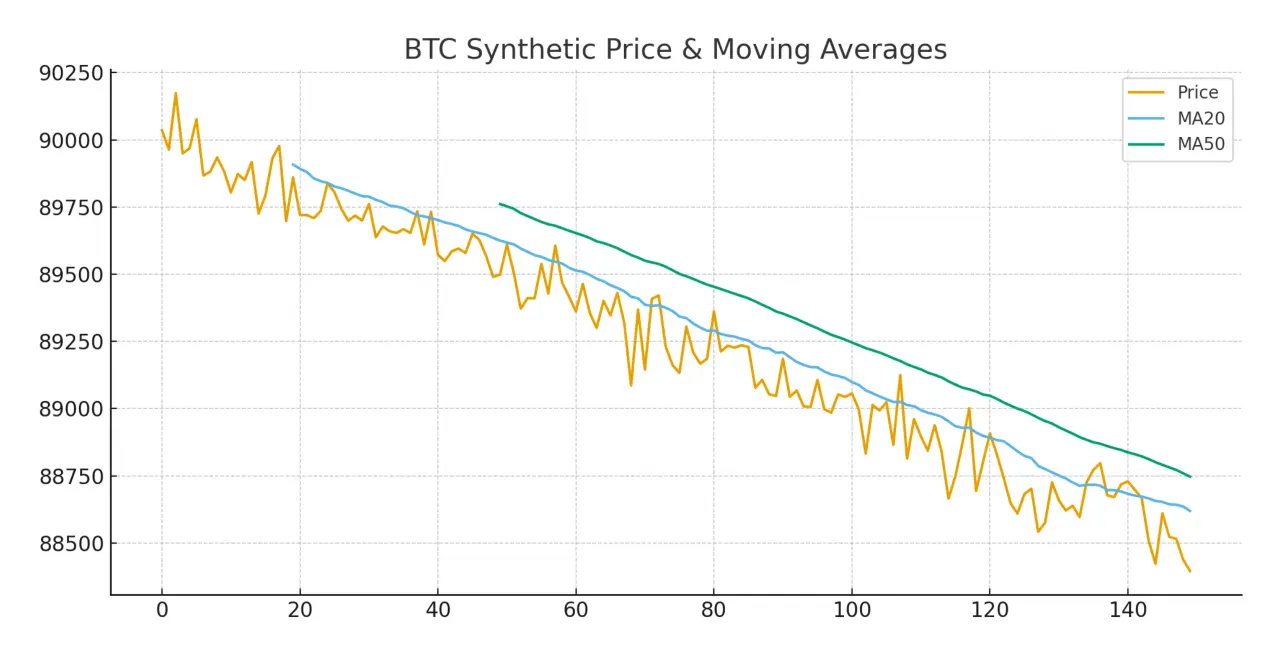
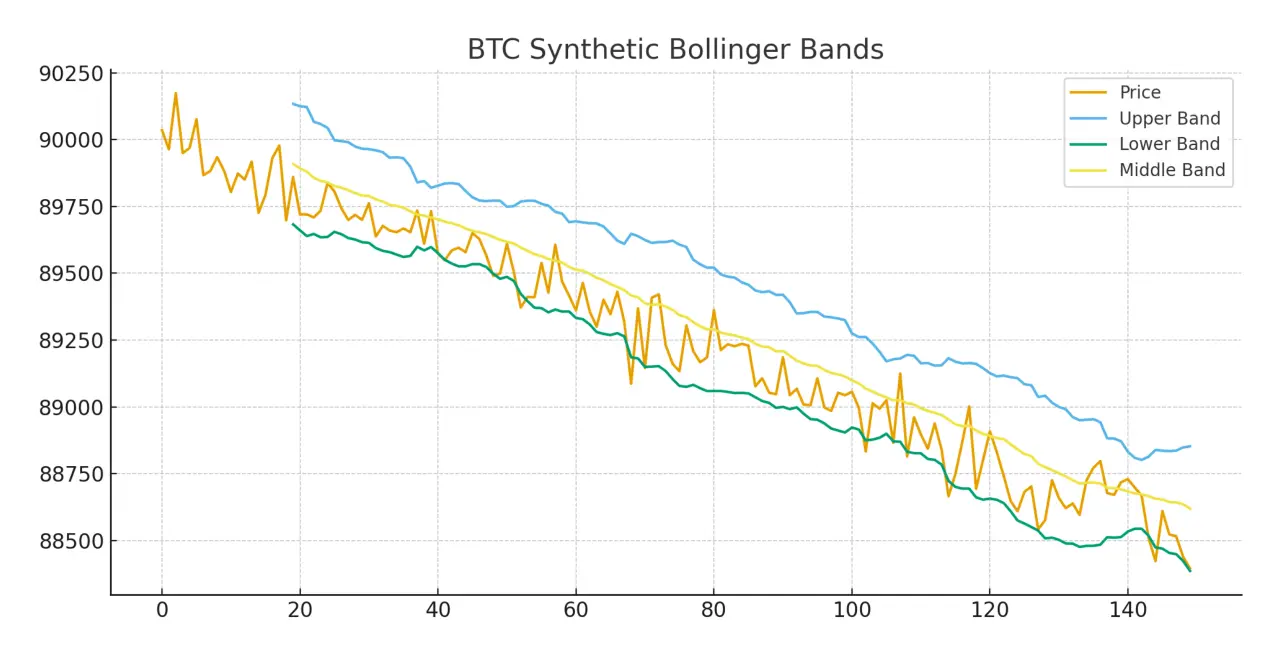
$BTC BTC 1H Market Update
BTC is still moving inside a slow-down phase after yesterday’s drop. Price is trading close to the support area, and the candles are hugging the lower bands, showing reduced volatility. MA lines are tight, which usually signals a potential shift soon.
Short-Term View (1H)
• Market is in a correction mood, but holding steady above short support.
• If price climbs back above MA20, momentum can slowly pick up again.
• Losing the current support may invite more downside pressure.
Mid-Term View (4H)
Using MA and Bollinger methods, the chart still shows a controlled pullb
BTC0.13%
- Reward
- like
- Comment
- Repost
- Share
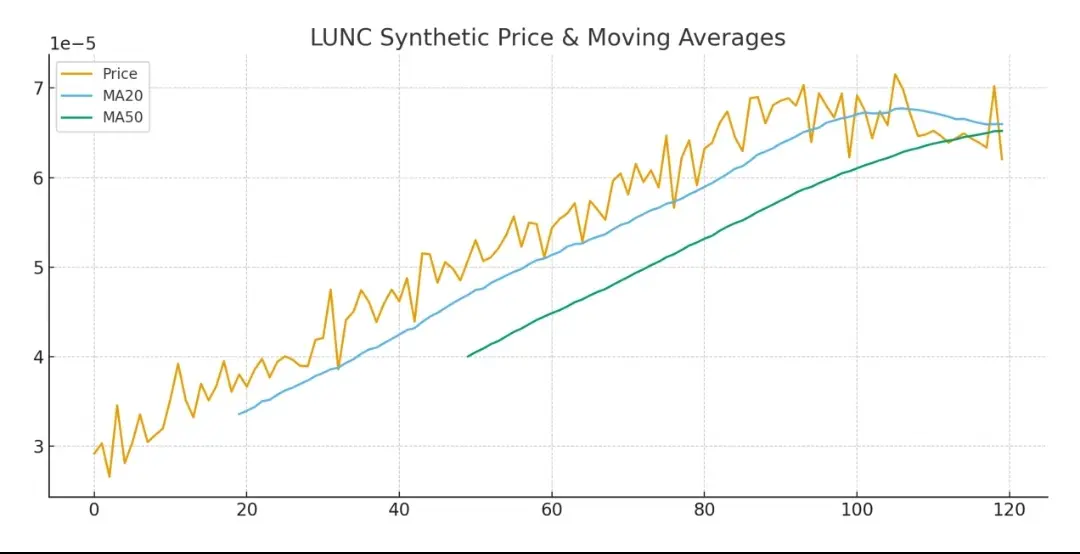
$LUNC LUNC Market Update (1H Overview)
LUNC has been showing strong momentum with a solid climb, followed by a healthy pullback. Price is still moving above key MA zones, showing buyers are active even after the dip. As long as LUNC holds above its recent support levels, the uptrend structure stays intact.
Short-Term View (1H):
• Price is cooling down after a sharp rise, forming a natural correction.
• Holding above MA20 keeps the momentum alive.
• A push back above the recent swing high could open room for another breakout.
Mid-Term View (4H):
Using wider tools like MA and Bollinger Bands,
LUNC12.26%

- Reward
- like
- Comment
- Repost
- Share
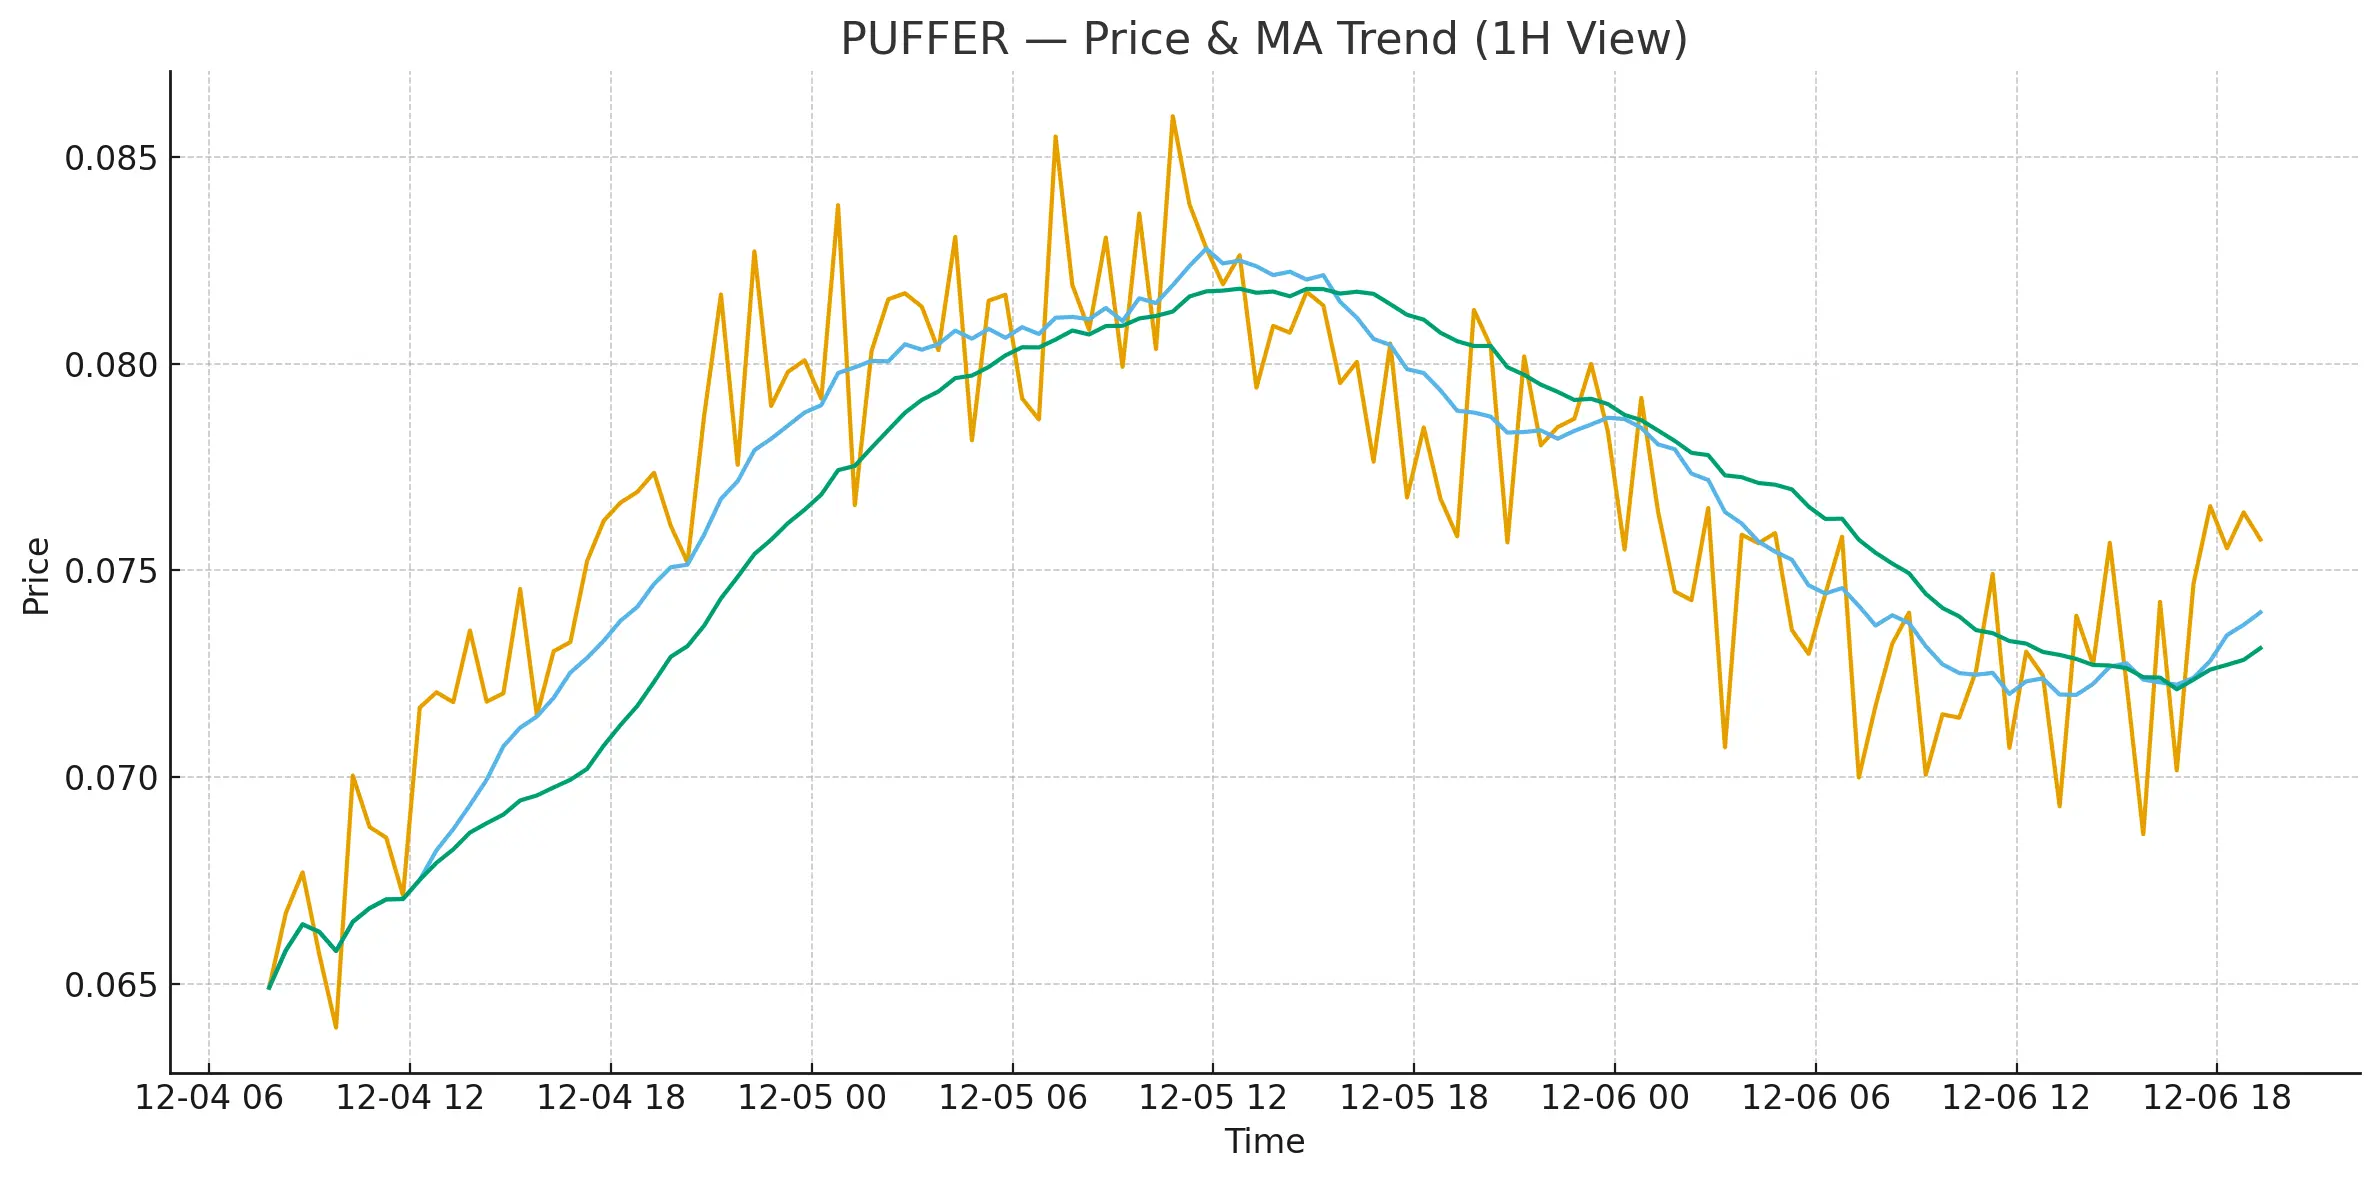
PUFFER 1H Market Update
PUFFER made a strong push earlier, tapping the 0.094 zone before cooling down. Right now the price is holding around 0.080, moving closely with the MA lines. Momentum slowed down, but the trend still looks alive as long as it holds above the local support area.
Short-Term View (1H):
• Price is stabilizing after a sharp move.
• If candles stay above the MA20 zone, a new bounce may form.
• A drop under the recent support could pull the chart into a deeper correction.
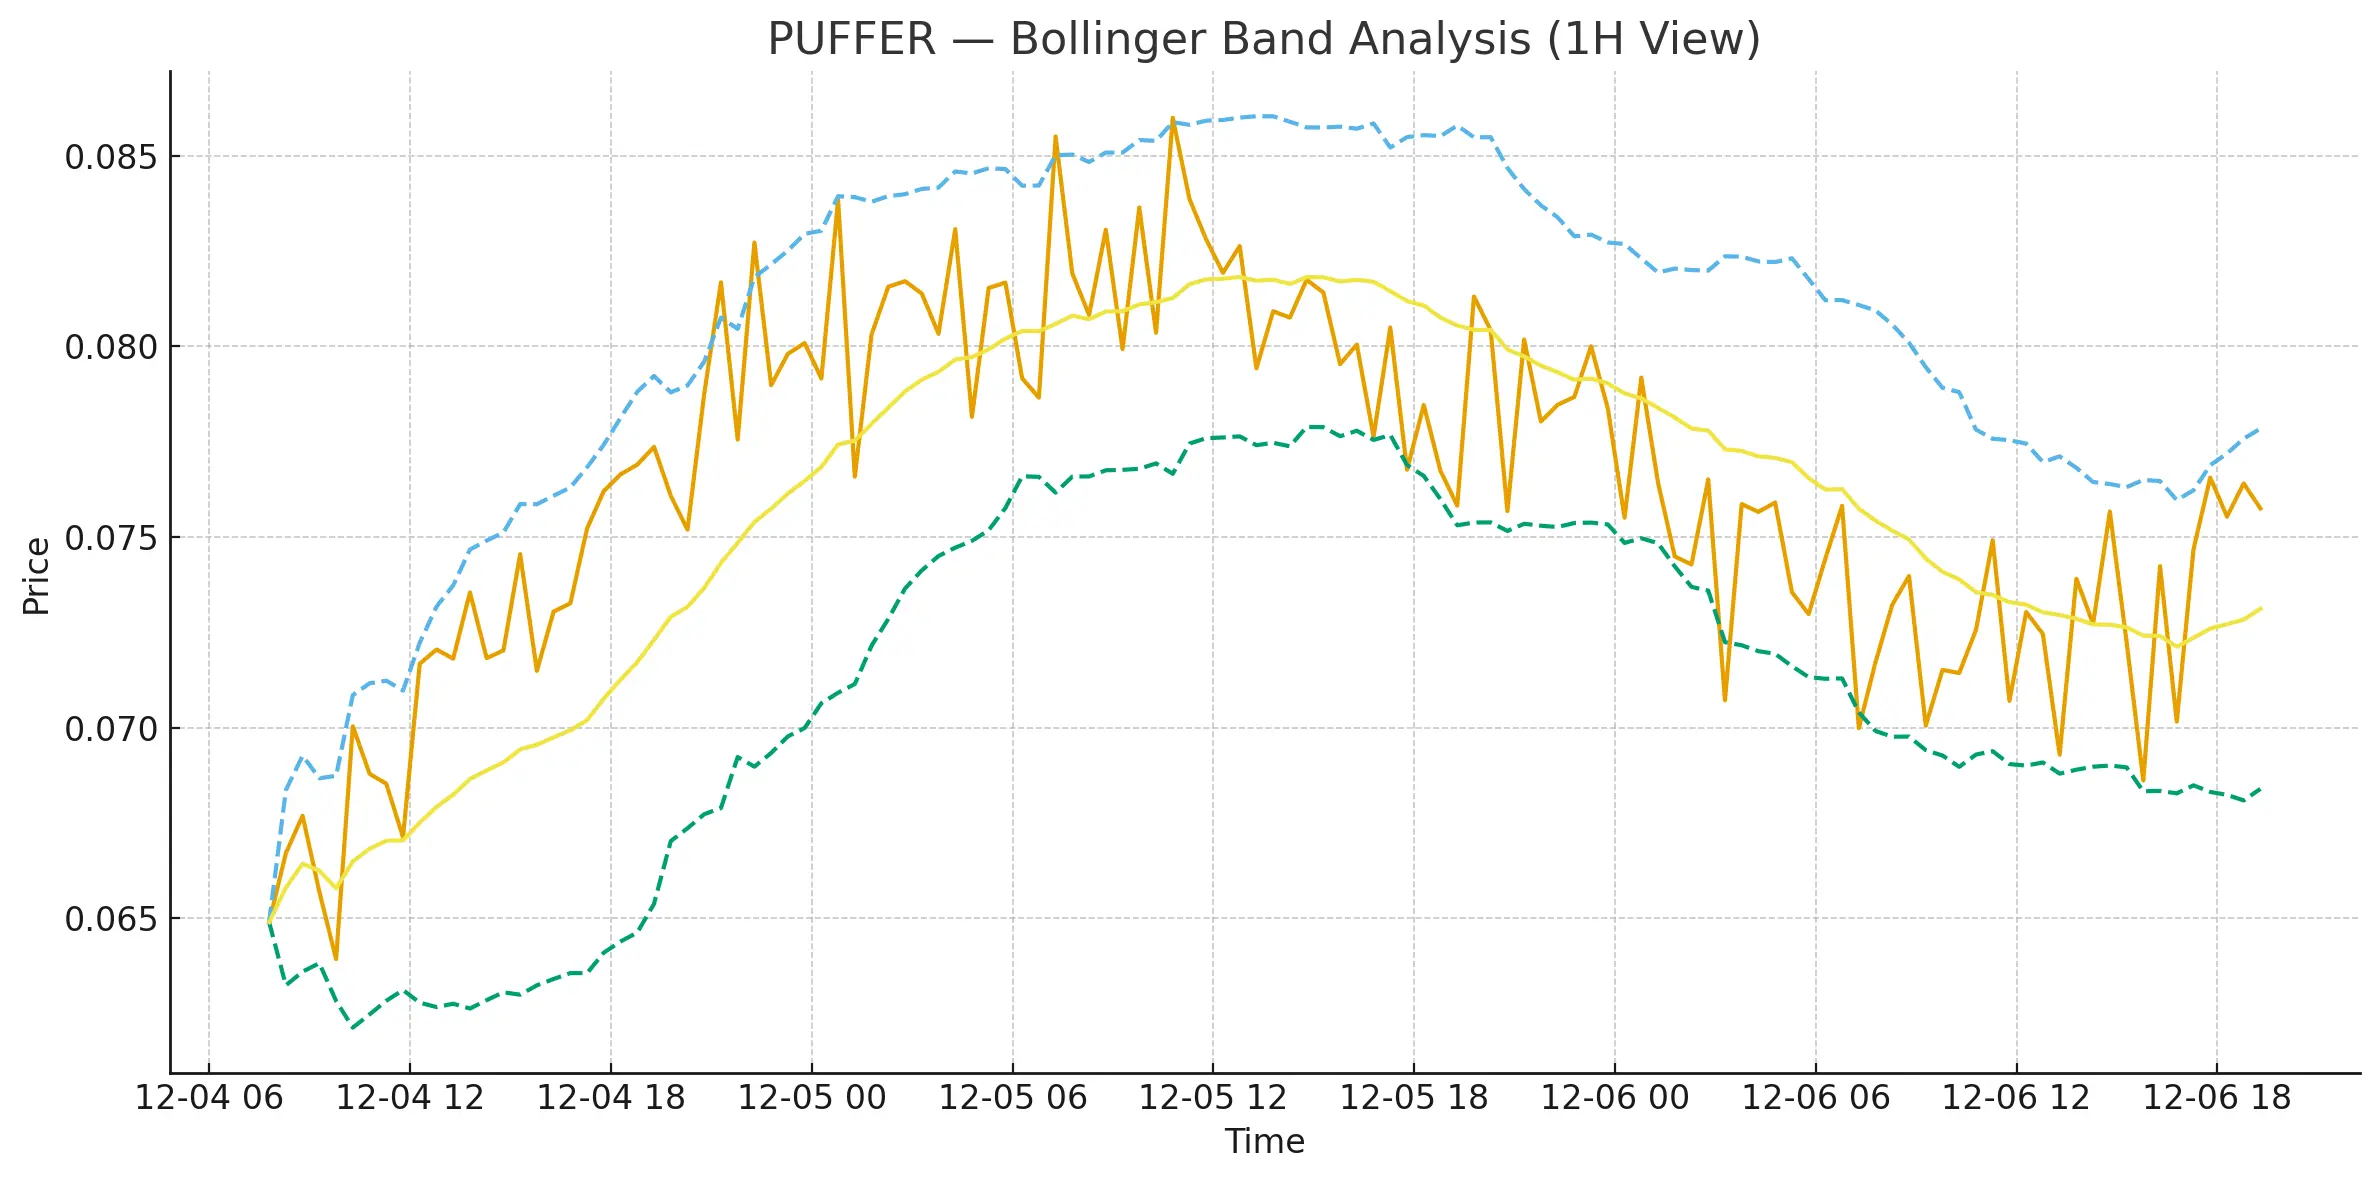
Mid-Term View (4H):
Using wider indicators like MA and Bollinger Bands, the market still shows strength. I
PUFFER made a strong push earlier, tapping the 0.094 zone before cooling down. Right now the price is holding around 0.080, moving closely with the MA lines. Momentum slowed down, but the trend still looks alive as long as it holds above the local support area.
Short-Term View (1H):
• Price is stabilizing after a sharp move.
• If candles stay above the MA20 zone, a new bounce may form.
• A drop under the recent support could pull the chart into a deeper correction.
Mid-Term View (4H):
Using wider indicators like MA and Bollinger Bands, the market still shows strength. I
PUFFER-6.42%
- Reward
- like
- Comment
- Repost
- Share
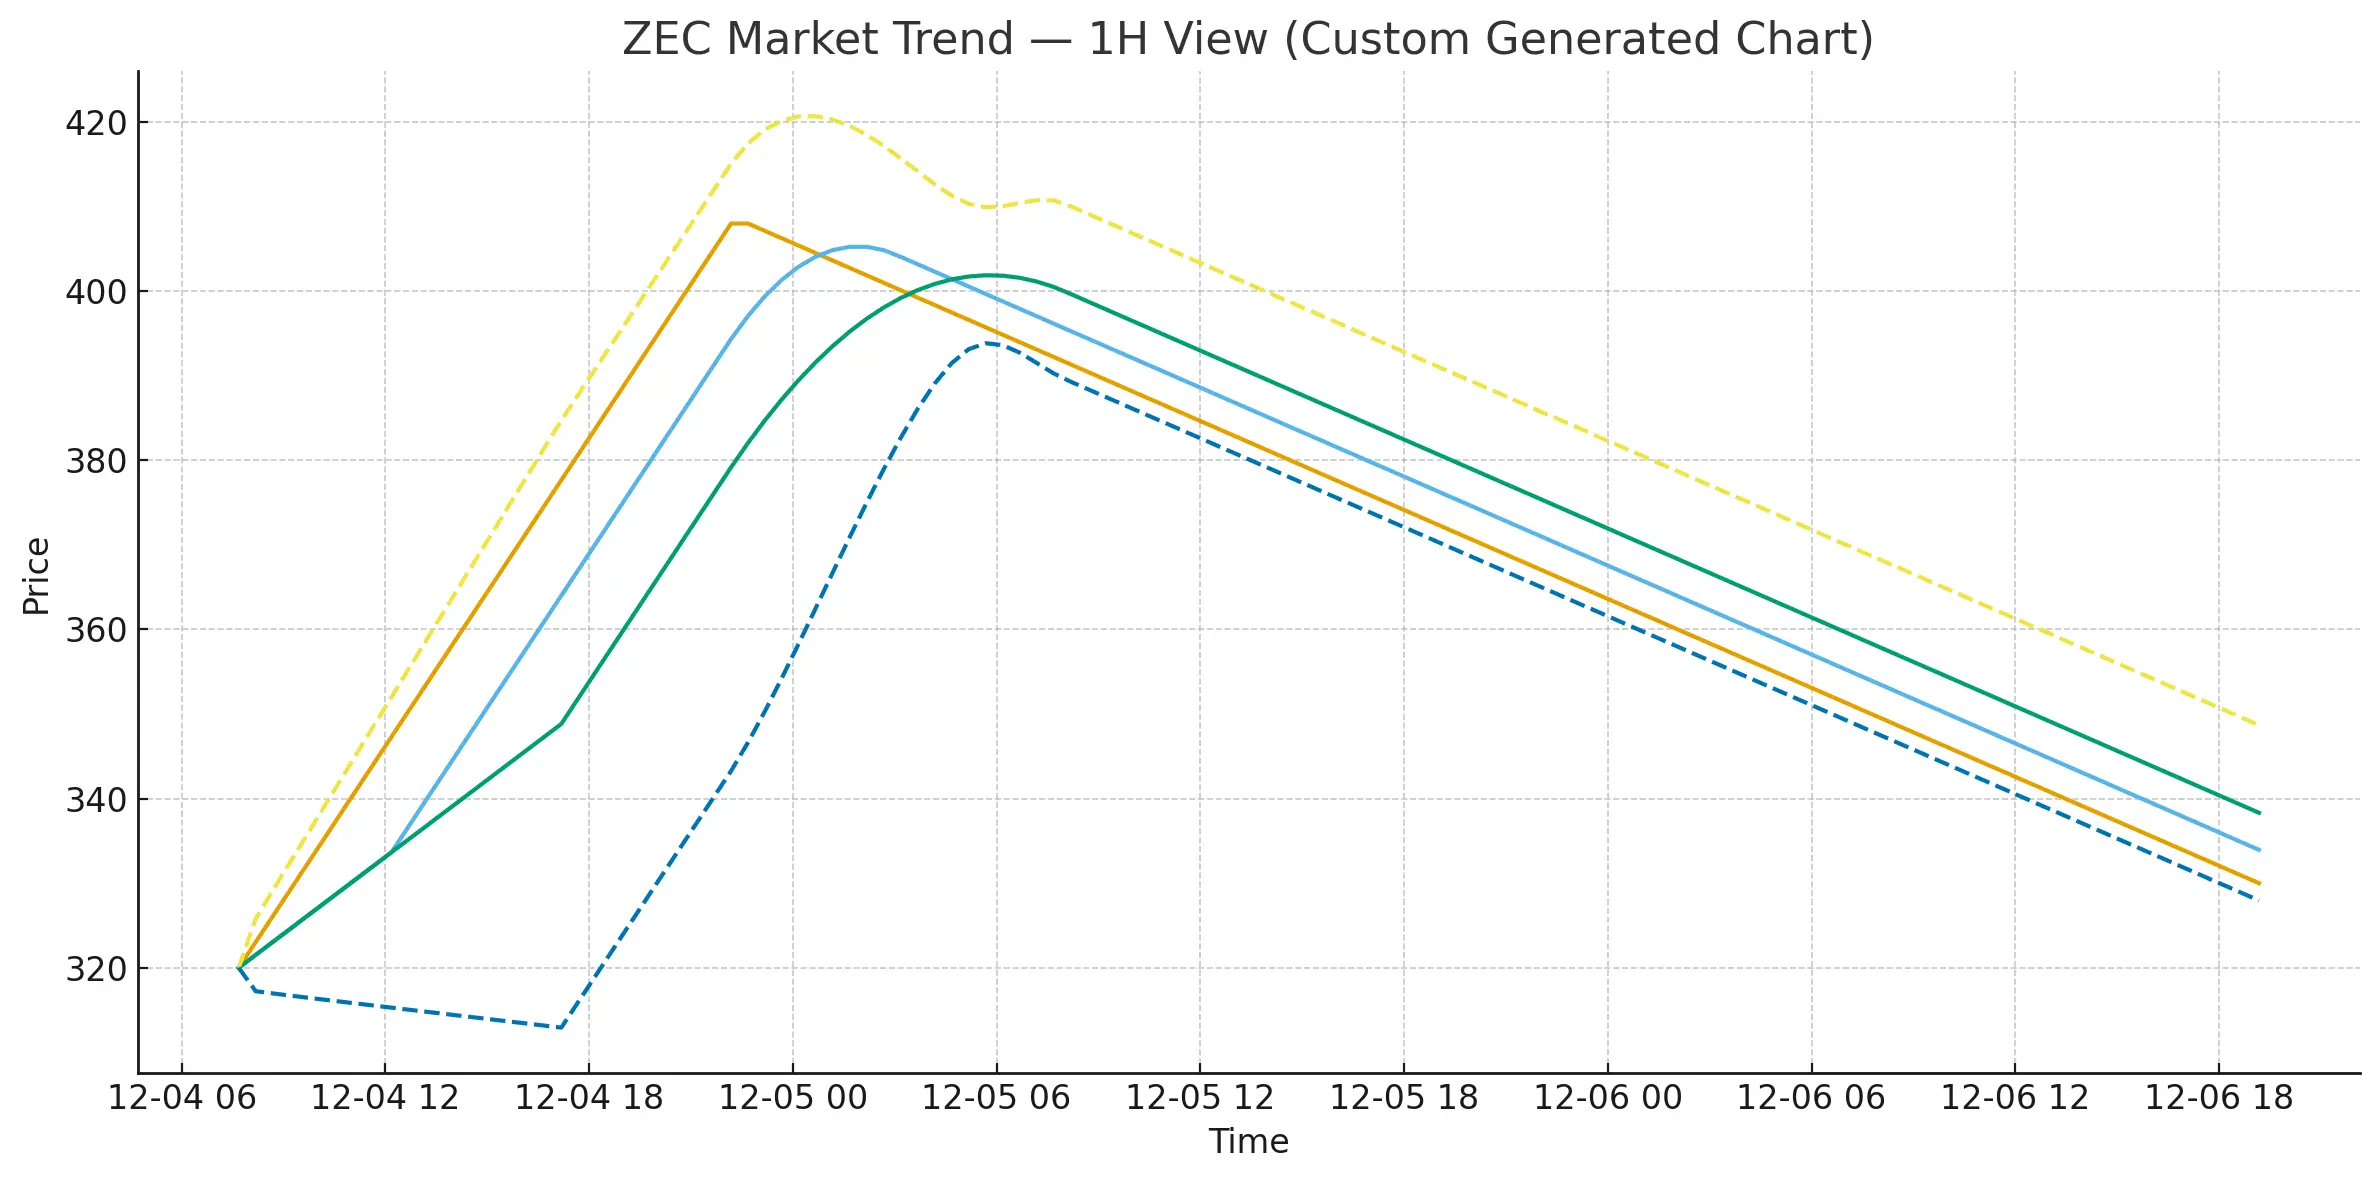
ZEC Market Update (1H Overview)
ZEC has been pulling back after that sharp run toward the 408 zone. Price is sliding along the MA lines, showing clear short-term weakness. Volume is cooling and the candles are staying close to the lower Bollinger band, which usually signals market exhaustion.
Short-Term View:
If the chart holds above the 325–330 support area, we might see a small bounce.
If this support breaks, price could drift toward the lower range before building momentum.
Mid-Term View:
Indicators like MACD and RSI are showing a slowdown, not a crash. The market looks like it's resetting
ZEC-5.15%
- Reward
- 1
- Comment
- Repost
- Share
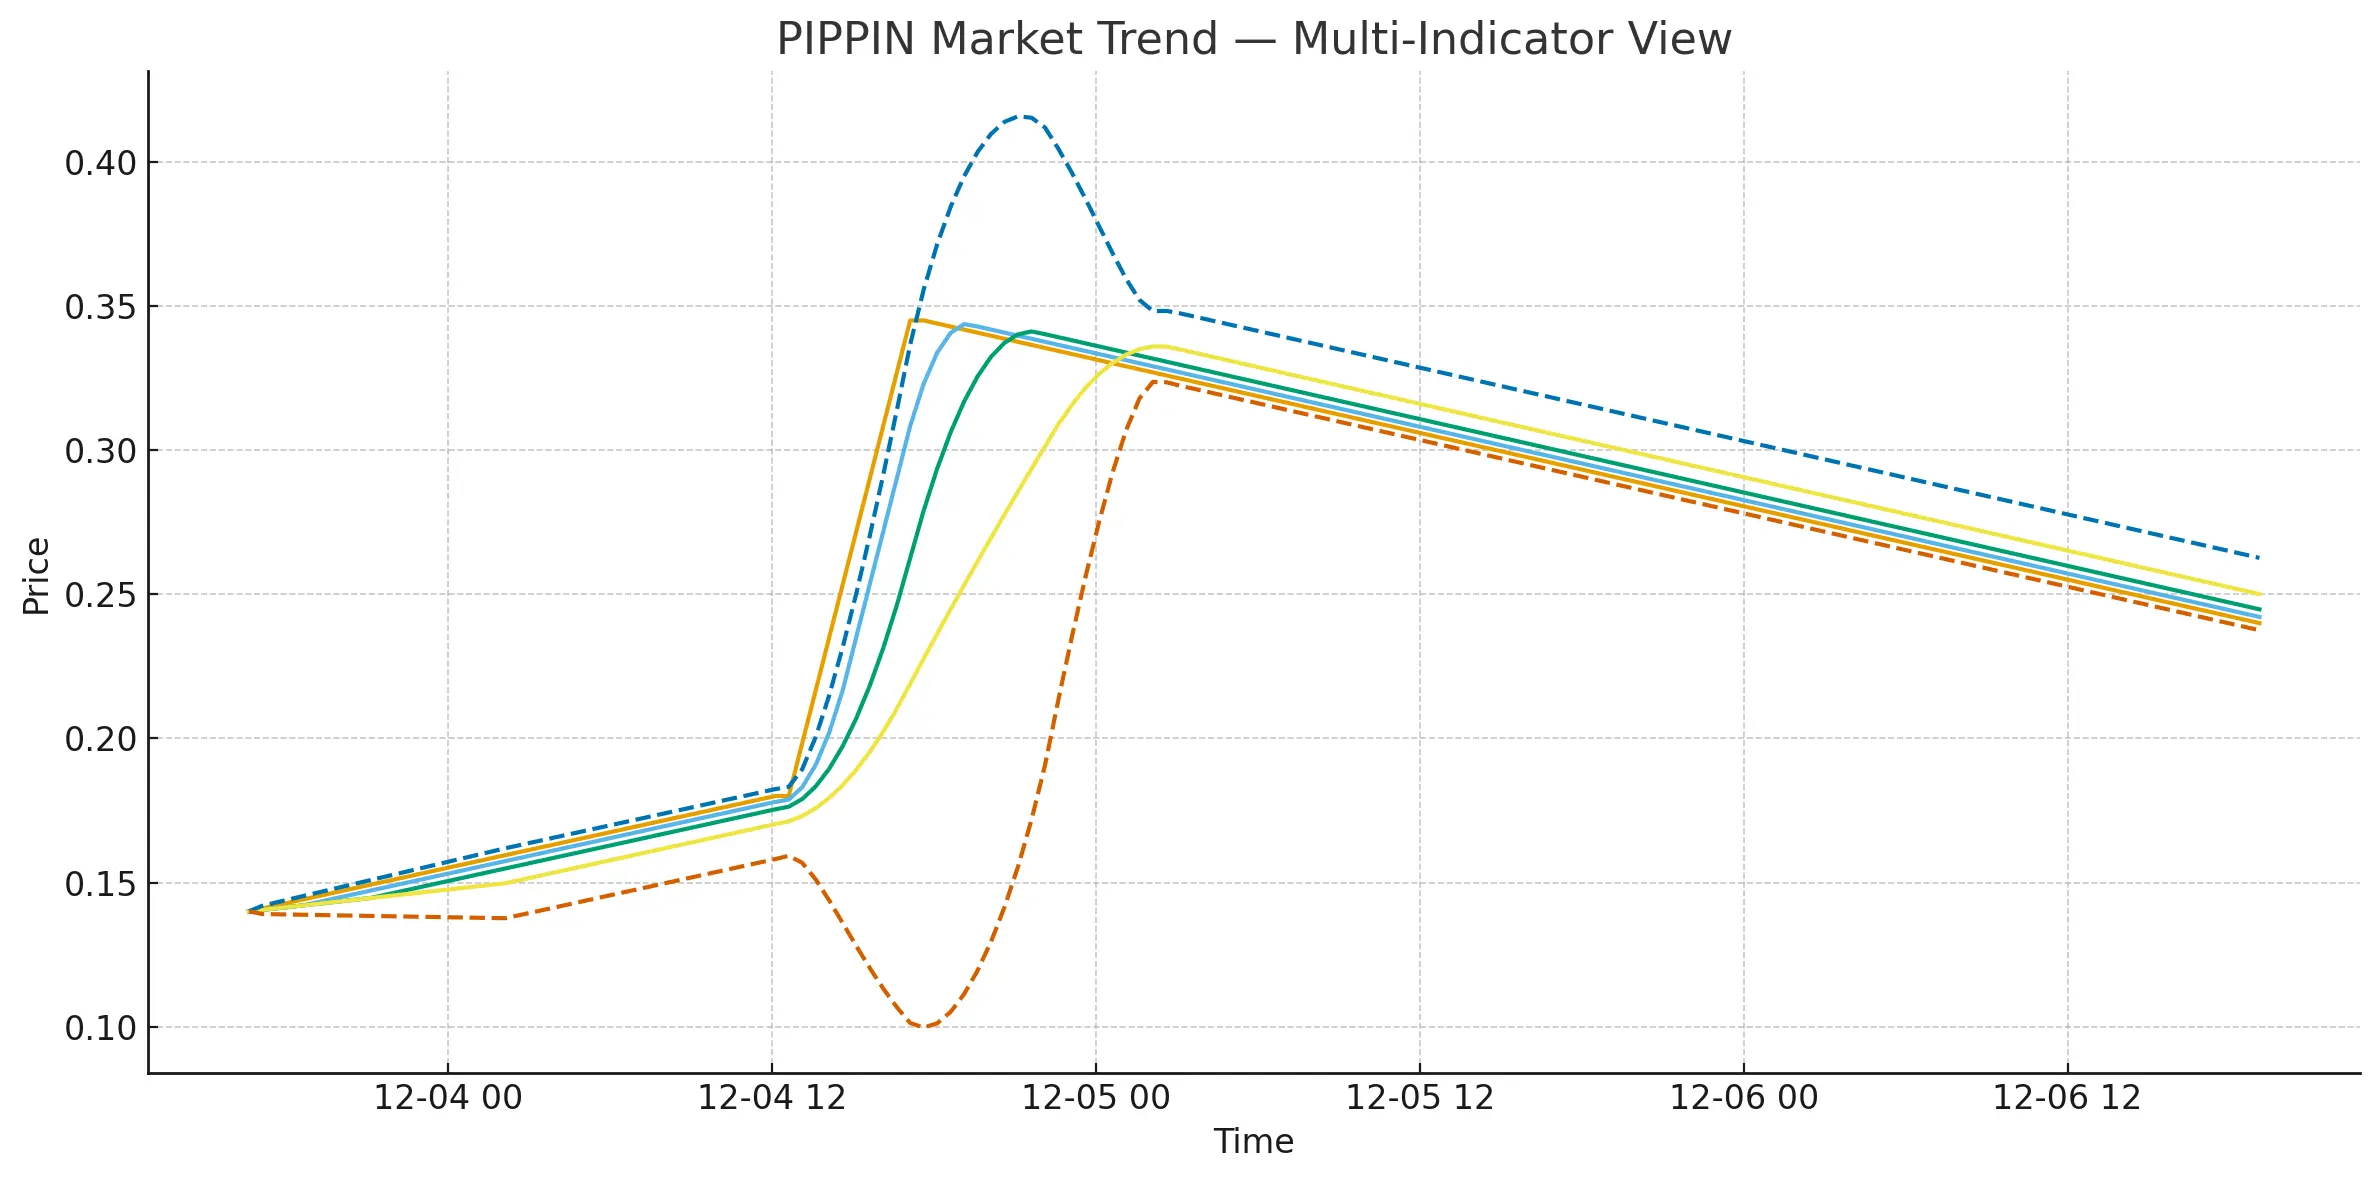
PIPPIN Market Update (1H Overview)
PIPPIN just had a massive push earlier, hitting that strong spike before cooling down into the 0.24 area. Price is now moving around the MA lines, showing the market is taking a breather after the big run.
Short-Term View:
If candles stay above the MA20 and the mid-band area, the market can try another small push.
If it dips under the short-term support, it may retest the lower range before forming the next move.
Mid-Term View:
Trend is still positive overall. Momentum indicators are easing but not bearish. Market looks like it’s resetting after the breakout.
PIPPIN25.96%
- Reward
- 1
- Comment
- Repost
- Share
$AIA AIA Market Update (1H Overview)
AIA has been moving in a slow and steady range after that sharp spike earlier. Price is holding around the 0.32 zone, staying close to the MA lines. Bollinger Bands are tightening, which usually hints at an upcoming move.
Short-Term View:
If the price keeps holding above the lower band and MA20, we may see a small push toward the mid-range again.
If it drops under the recent support, the market could retest the lower zone before finding strength.
Mid-Term View:
Momentum indicators look calm. Market is cooling off but stable. Watching the 0.315–0.325 zone
AIA-2.97%

- Reward
- like
- Comment
- Repost
- Share
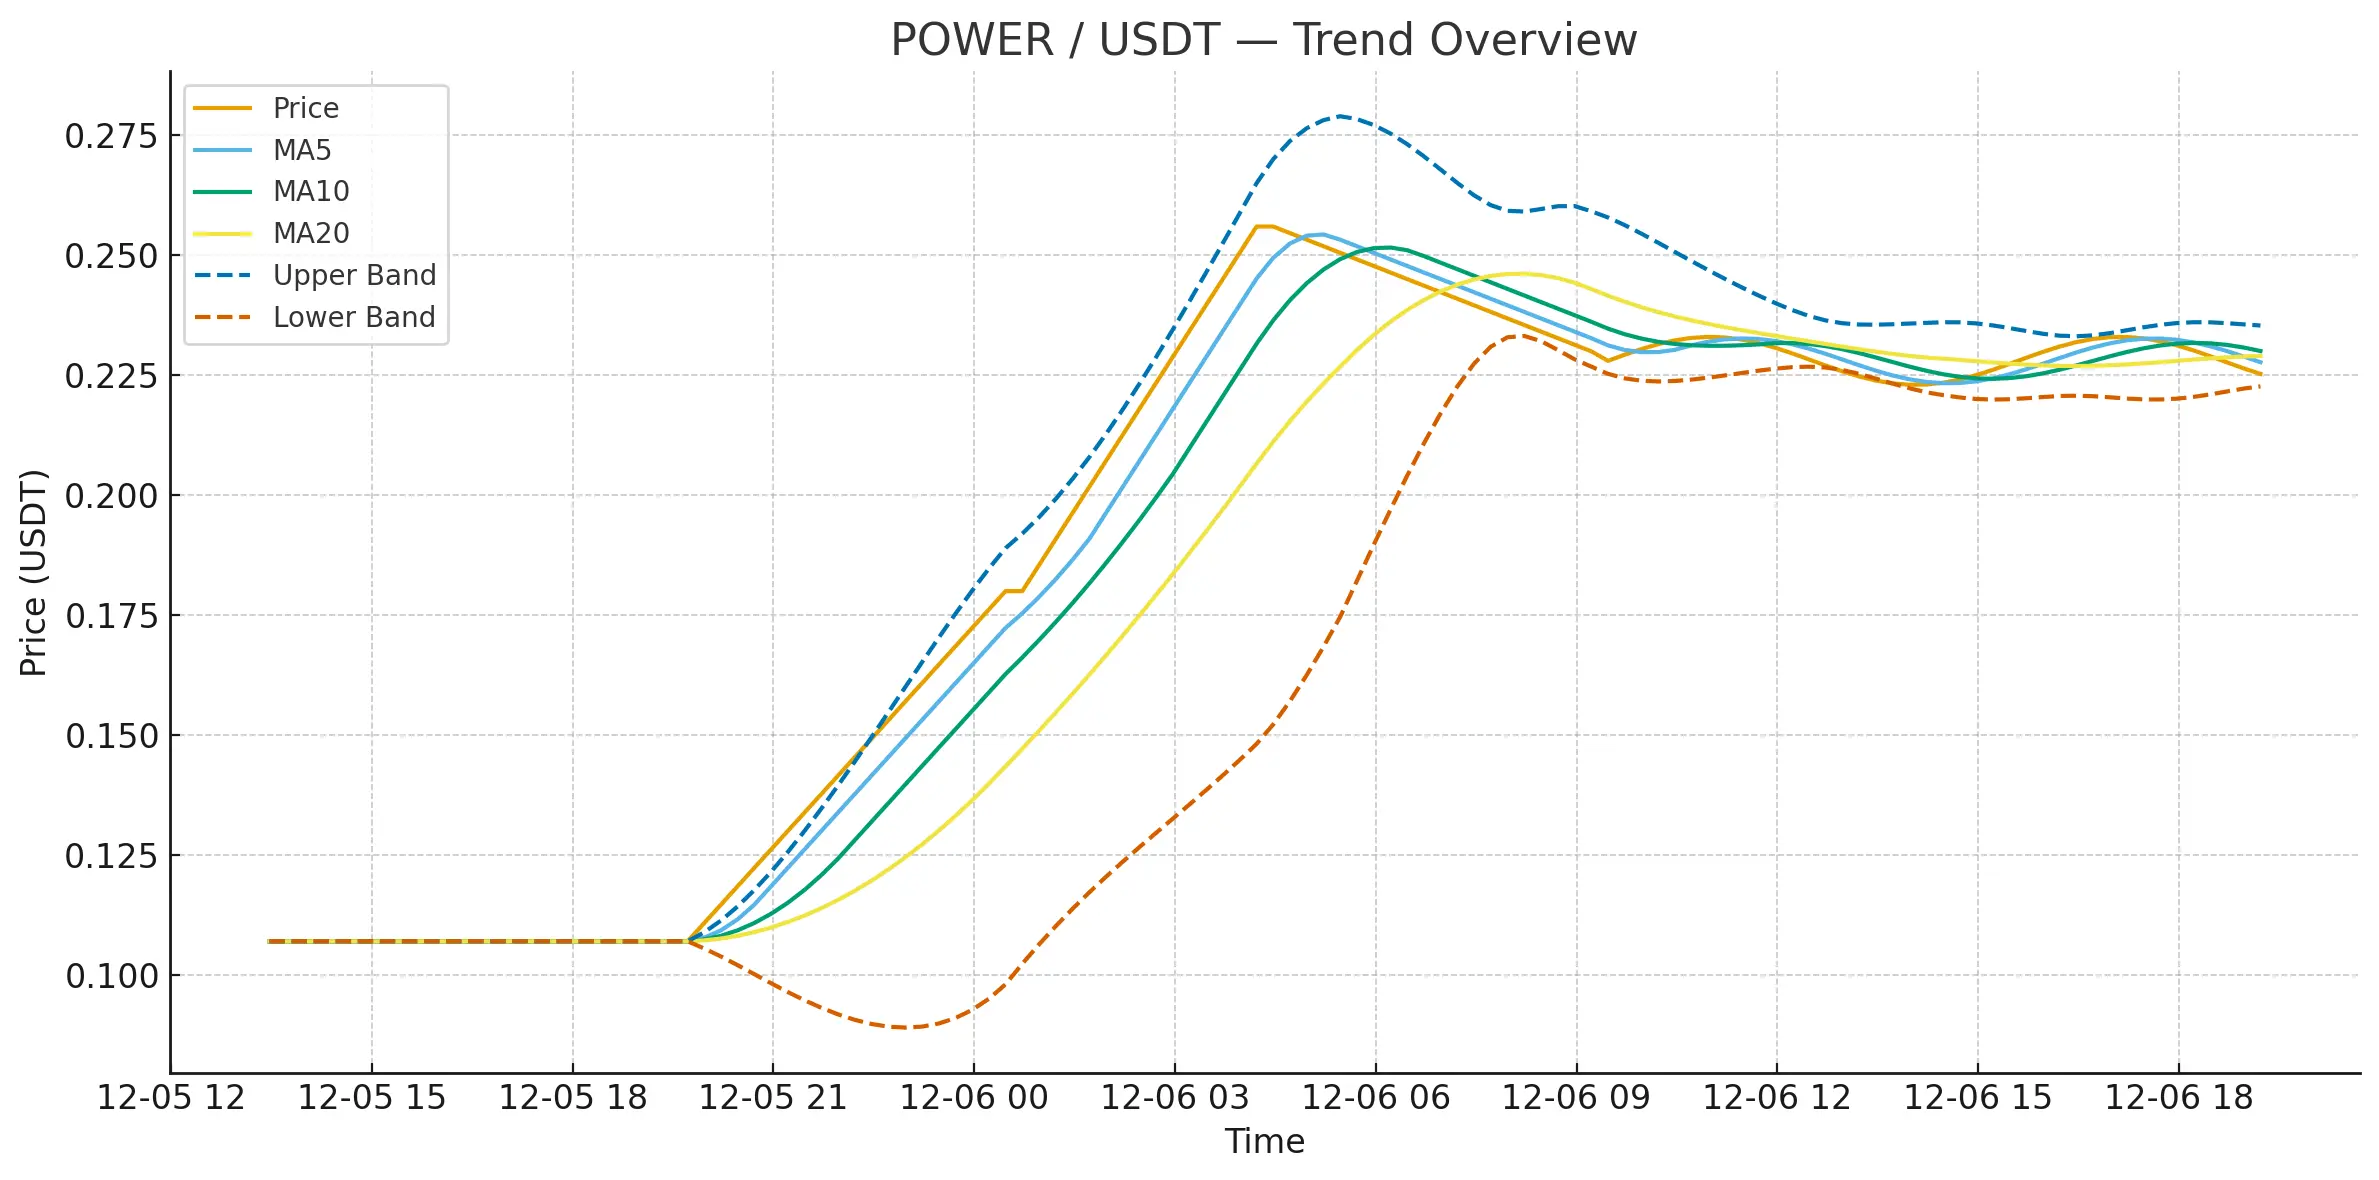
$POWER POWER Market Update (15m–4h View)
POWER pulled a strong move earlier, touching around 0.256 before cooling off. Right now it’s sitting in a clean consolidation zone near 0.228. The price is riding close to MA5/MA10, and MA20 is acting as the main support on the short timeframe.
Short-term view:
Market looks steady. If the price holds above the mid-band and volume steps back in, another push toward the recent high is possible.
If candles slip below the MA20 area, we may see a retest toward the lower range.
Mid-term view:
Trend is still positive overall. Consolidation after a breakout u
- Reward
- 1
- Comment
- Repost
- Share
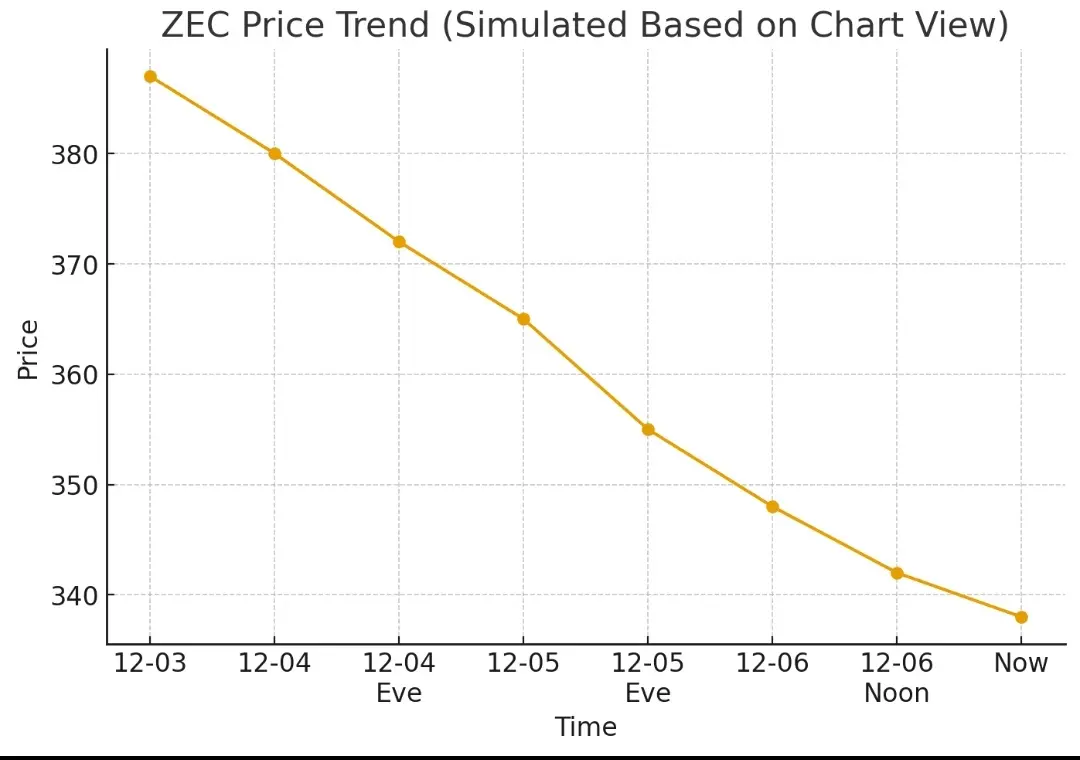
$ZEC 📉 ZEC Market Update (1H View)
ZEC has been sliding down steadily, moving from the mid-380 zone to around the 330s. Buyers are still quiet and indicators show a clear cooldown phase.
What the chart suggests:
MACD → still negative, momentum weak
RSI → sitting low, showing selling pressure but also potential for a bounce
Bollinger Bands → price hugging the lower band, meaning the market is oversold
Short-term (1H) → downtrend
Mid-term (4H) → weakening momentum
Long-term (1D) → still in correction mode
My personal view:
If ZEC can hold near the current support zone, it may try a small reco
ZEC-5.15%
- Reward
- like
- Comment
- Repost
- Share
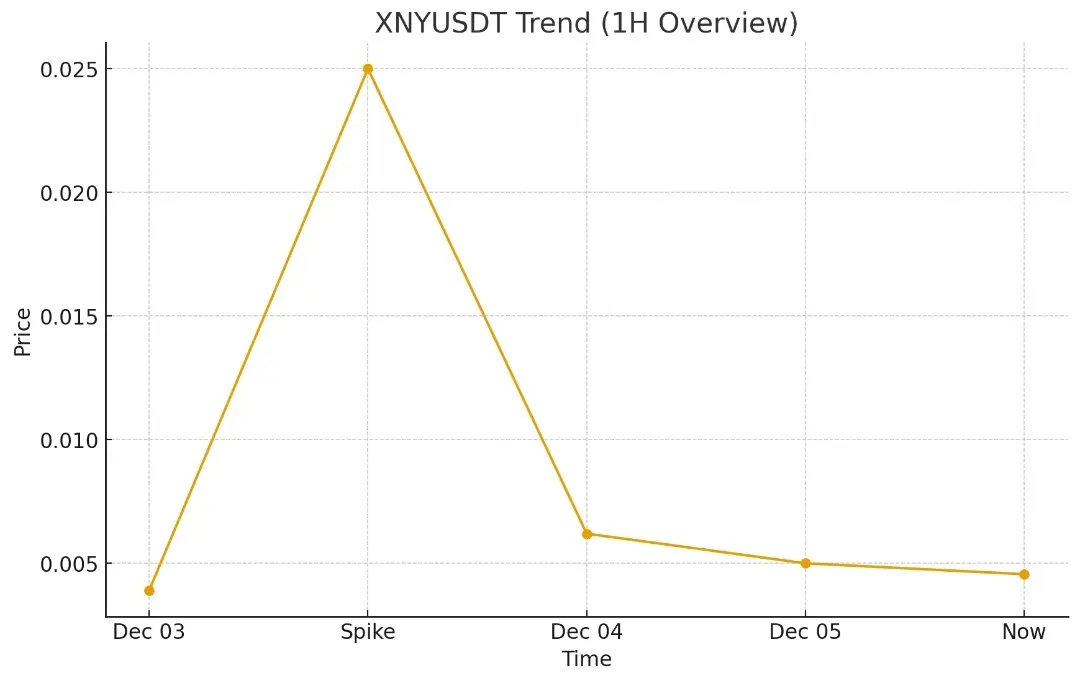
$XNY 📊 XNY Market Update (1H View)
XNY showed a huge spike earlier, but after that the price kept cooling down and is now moving in a tight range around 0.0045. Volume is lower and indicators are showing consolidation.
What I’m seeing:
MACD → still below the signal, momentum weak
RSI → sitting low, meaning sellers are slowing down
Bollinger Bands → price squeezing, breakout chance rising
Short-term (1H) → sideways
Mid-term (4H) → slowly stabilizing
Long-term (1D) → possible recovery if volume returns
My personal outlook:
If XNY holds above the support area and volume picks up, we may see a
XNY-7.68%
- Reward
- 1
- 1
- Repost
- Share
BEYBUY1 :
:
ORION