Trade
Basic
Futures
Futures
Hundreds of contracts settled in USDT or BTC
TradFi
Gold
Trade global traditional assets with USDT in one place
Options
Hot
Trade European-style vanilla options
Unified Account
Maximize your capital efficiency
Demo Trading
Futures Kickoff
Get prepared for your futures trading
Futures Events
Participate in events to win generous rewards
Demo Trading
Use virtual funds to experience risk-free trading
Earn
Launch
CandyDrop
Collect candies to earn airdrops
Launchpool
Quick staking, earn potential new tokens
HODLer Airdrop
Hold GT and get massive airdrops for free
Launchpad
Be early to the next big token project
Alpha Points
Trade on-chain assets and enjoy airdrop rewards!
Futures Points
Earn futures points and claim airdrop rewards
Investment
Simple Earn
Earn interests with idle tokens
Auto-Invest
Auto-invest on a regular basis
Dual Investment
Buy low and sell high to take profits from price fluctuations
Soft Staking
Earn rewards with flexible staking
Crypto Loan
0 Fees
Pledge one crypto to borrow another
Lending Center
One-stop lending hub
VIP Wealth Hub
Customized wealth management empowers your assets growth
Private Wealth Management
Customized asset management to grow your digital assets
Quant Fund
Top asset management team helps you profit without hassle
Staking
Stake cryptos to earn in PoS products
Smart Leverage
New
No forced liquidation before maturity, worry-free leveraged gains
GUSD Minting
Use USDT/USDC to mint GUSD for treasury-level yields
More
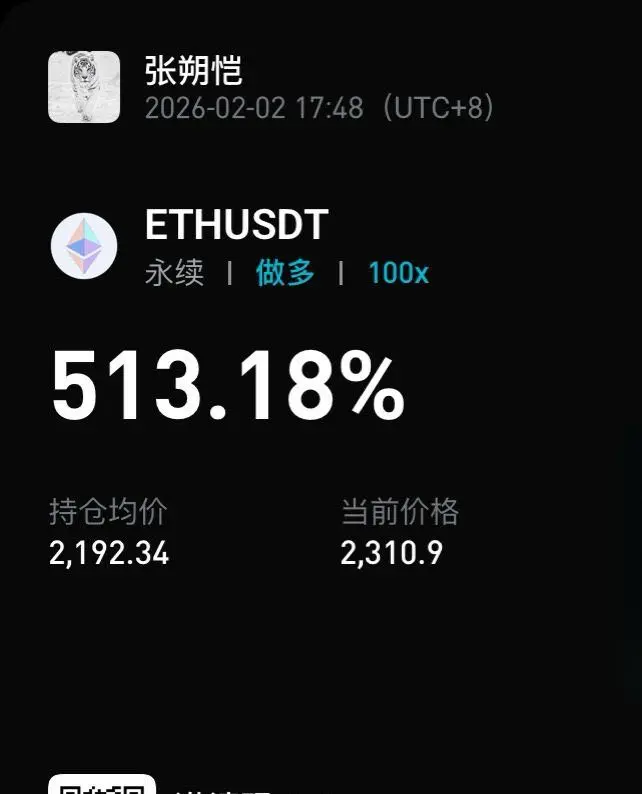
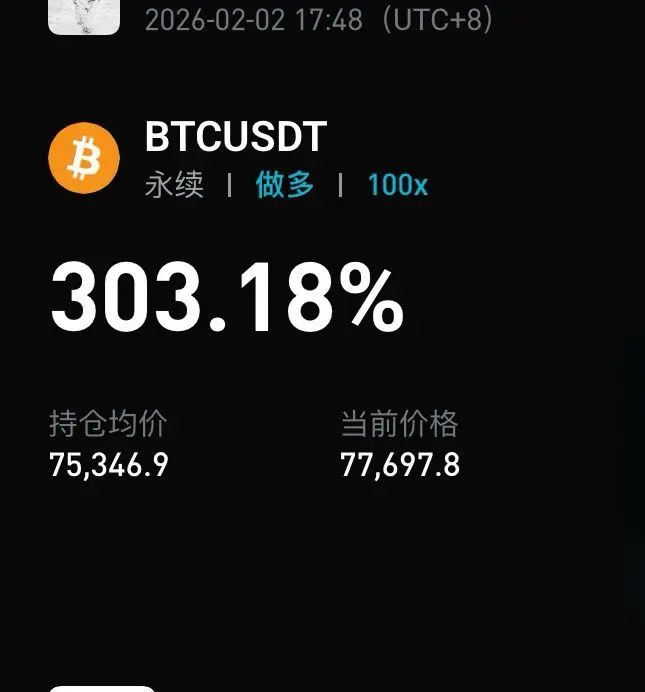
ZhangShukaiWinsAtTheK-Line
This morning, we emphasized the importance of preventing false rebounds after market诱空. But many people chase short positions based on indicators, prioritizing profits over risk management. This is especially deadly in the crypto derivatives space. We can never be certain which area the market will reach, and even if it does, it's a gift from above. While larger timeframes have directions, a small rebound on a big timeframe can easily lead to stop-losses of several times the position size. With small positions, it's just entertainment; with large positions, it turns into losses. This is all du
BTC-0,92%
- Reward
- 1
- Comment
- Repost
- Share
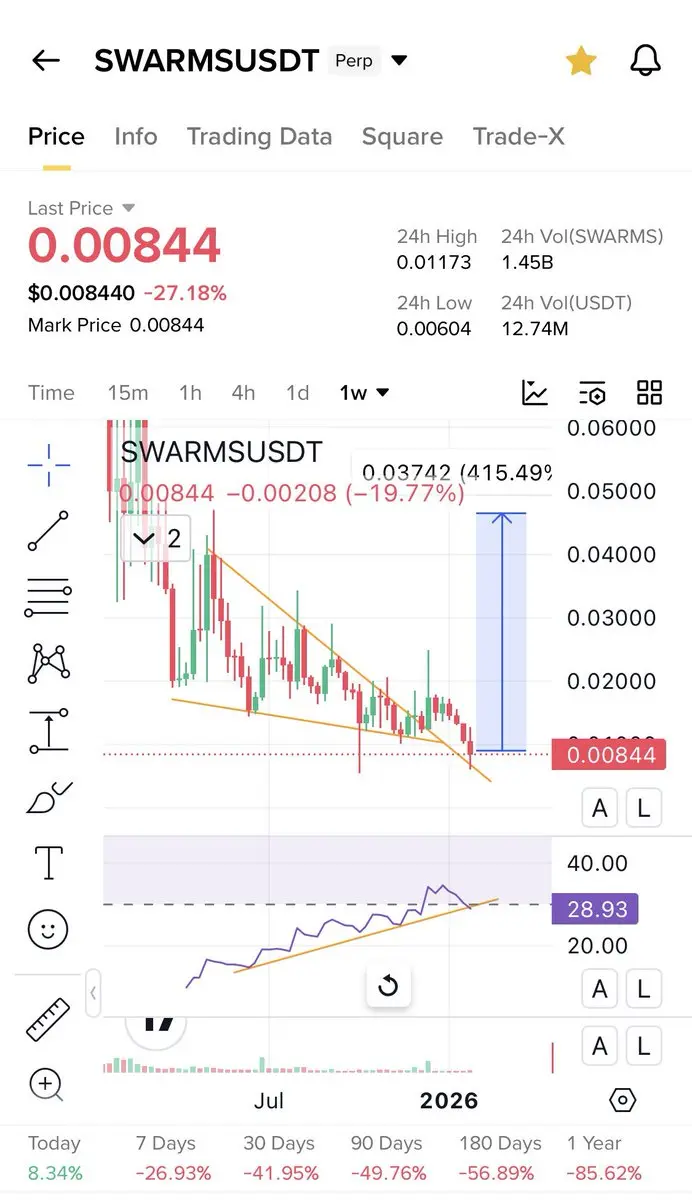
$Swarms most perfect fallingwedge breakout retest Buy the bottom and have patience will be worth it
SWARMS-2,9%
- Reward
- like
- 1
- Repost
- Share
BuyingHighAndSelling :
:
Take a break. Just seeing you annoys me.🇺🇸🧐 #MSTR According to Epstein-related documents released by the U.S. Department of Justice on January 31, an email from Peggy Siegal on May 8, 2010, revealed that Michael Saylor, founder of MicroStrategy, donated $25,000 to a charitable event. In return, he gained the opportunity to meet members of a high-end #social circle. The email described him as having no personality, being difficult to engage with socially, and lacking an understanding of #social norms. #crypto

- Reward
- like
- Comment
- Repost
- Share
¥
马内多多
Created By@GateUser-8e1712fd
Listing Progress
0.00%
MC:
$2.8K
Create My Token
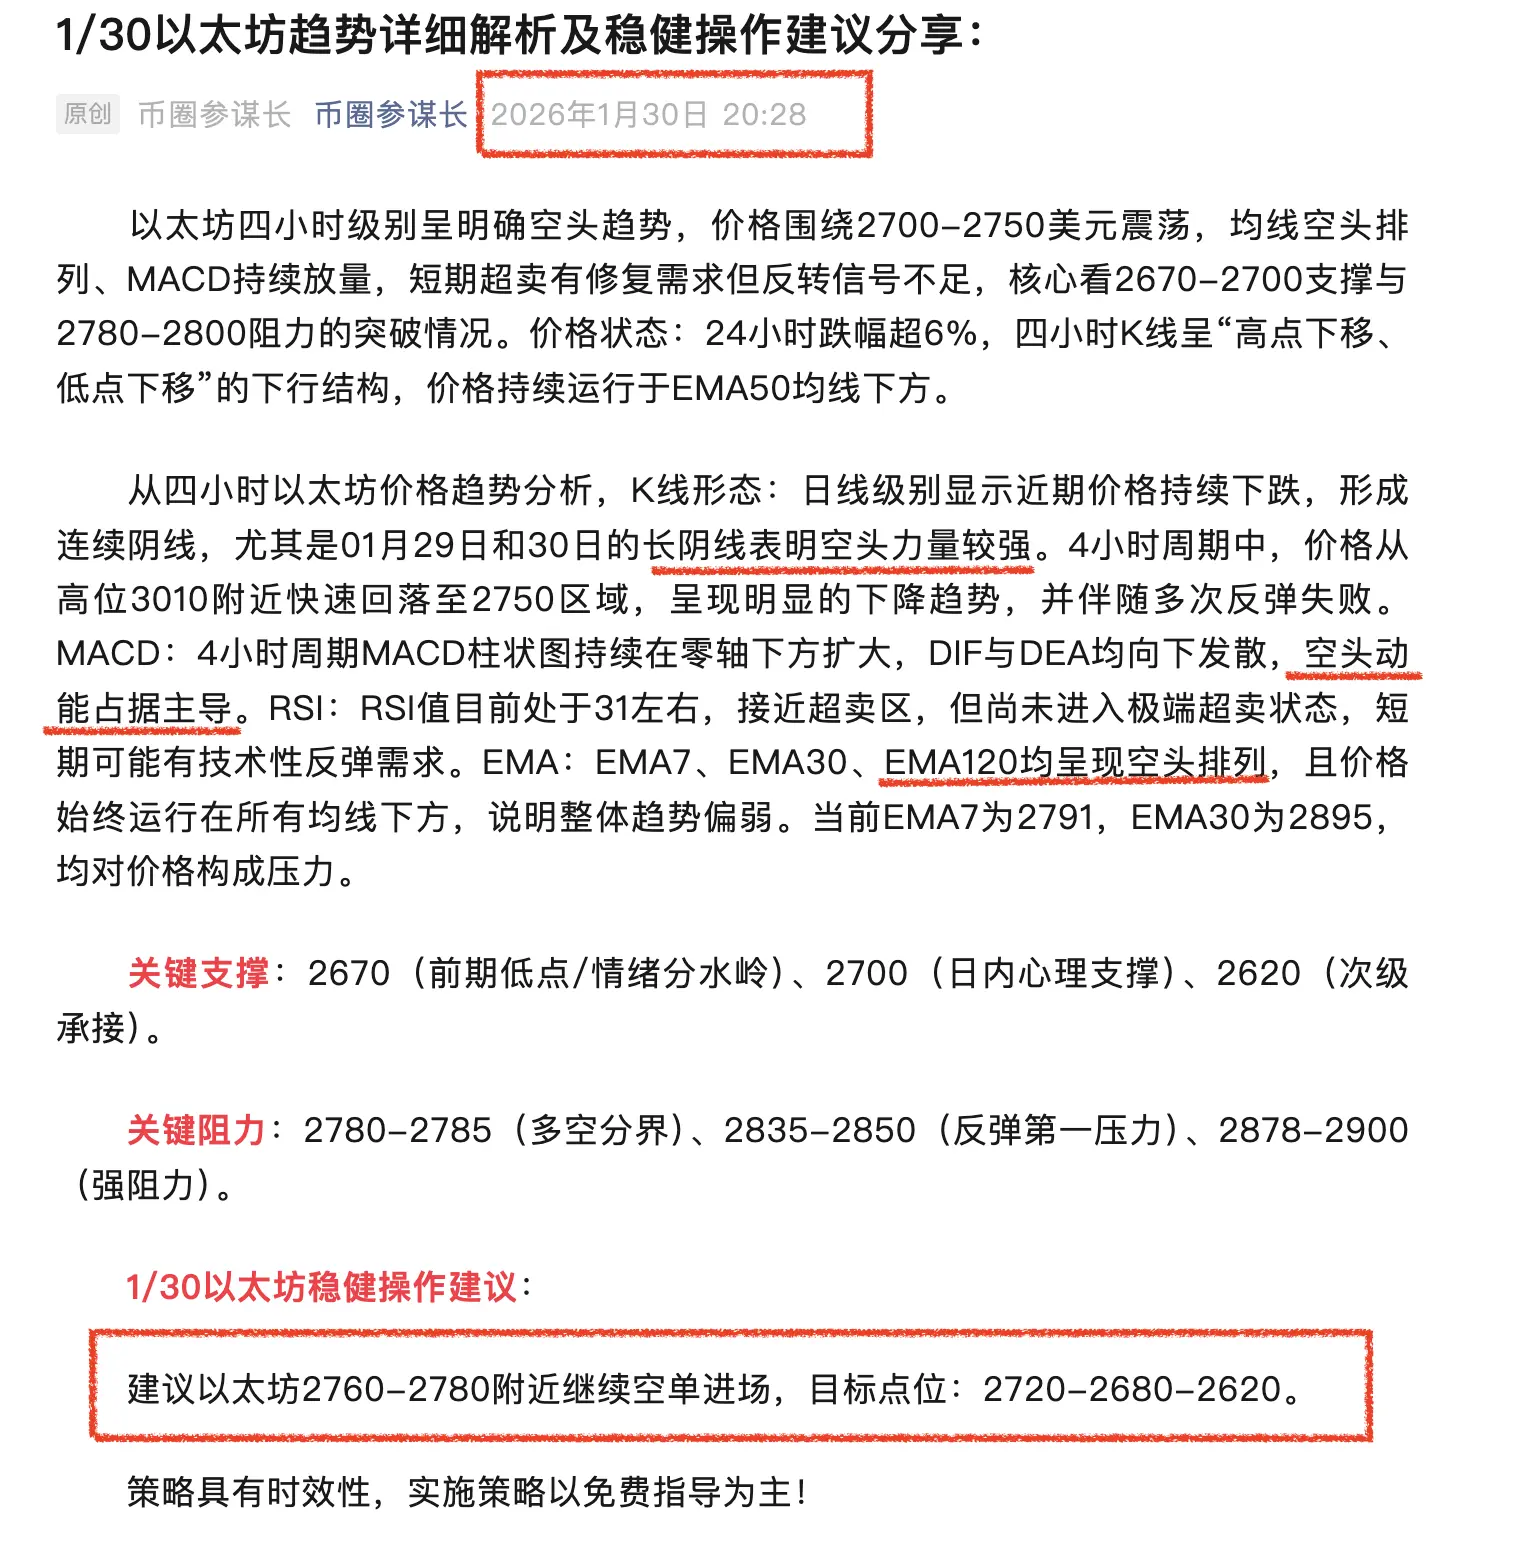
📣2/2 Ethereum Trend Detailed Analysis and Steady Operation Recommendations:
The four-hour chart for Ethereum shows a weak consolidation, with a bearish dominance pattern. The price fluctuates around $2,200, with clear key support below and resistance above. Technical indicators indicate that bearish momentum has not been fully released but show signs of oversold correction. Current price: approximately $2,277, oscillating above the previous key support zone ($2,150-$2,200). After touching a low of $2,163, it rebounded slightly, forming a typical bearish structure of "lower lows and lower
The four-hour chart for Ethereum shows a weak consolidation, with a bearish dominance pattern. The price fluctuates around $2,200, with clear key support below and resistance above. Technical indicators indicate that bearish momentum has not been fully released but show signs of oversold correction. Current price: approximately $2,277, oscillating above the previous key support zone ($2,150-$2,200). After touching a low of $2,163, it rebounded slightly, forming a typical bearish structure of "lower lows and lower
ETH-4,56%

- Reward
- like
- 1
- Repost
- Share
ChongChongGeGeWu:
It's too difficult😃Cent by cent, pip by pip on the SECOND chart!
On the second, damn it! 😹
This is how you should trade, brothers and sisters!
Good luck in trading! 😁
View OriginalOn the second, damn it! 😹
This is how you should trade, brothers and sisters!
Good luck in trading! 😁

- Reward
- 1
- Comment
- Repost
- Share
Check out Gate and join me in the hottest event! https://www.gate.com/campaigns/3867?ref=VLIXXFKJAQ&ref_type=132
- Reward
- 3
- 3
- Repost
- Share
DragonFlyOfficial :
:
2026 GOGOGO 👊View More
BREAKING: Russia insists any talks between Putin and Zelensky must happen in Moscow—no other location accepted. 🚨


- Reward
- 1
- 1
- Repost
- Share
DragonFlyOfficial:
2026 GOGOGO 👊BTC Prediction and Market Analysis
0
- Reward
- like
- Comment
- Repost
- Share
DO YOU KNOW ? $4.02 trillion wiped out from gold and silver\'s market cap today.

- Reward
- like
- Comment
- Repost
- Share
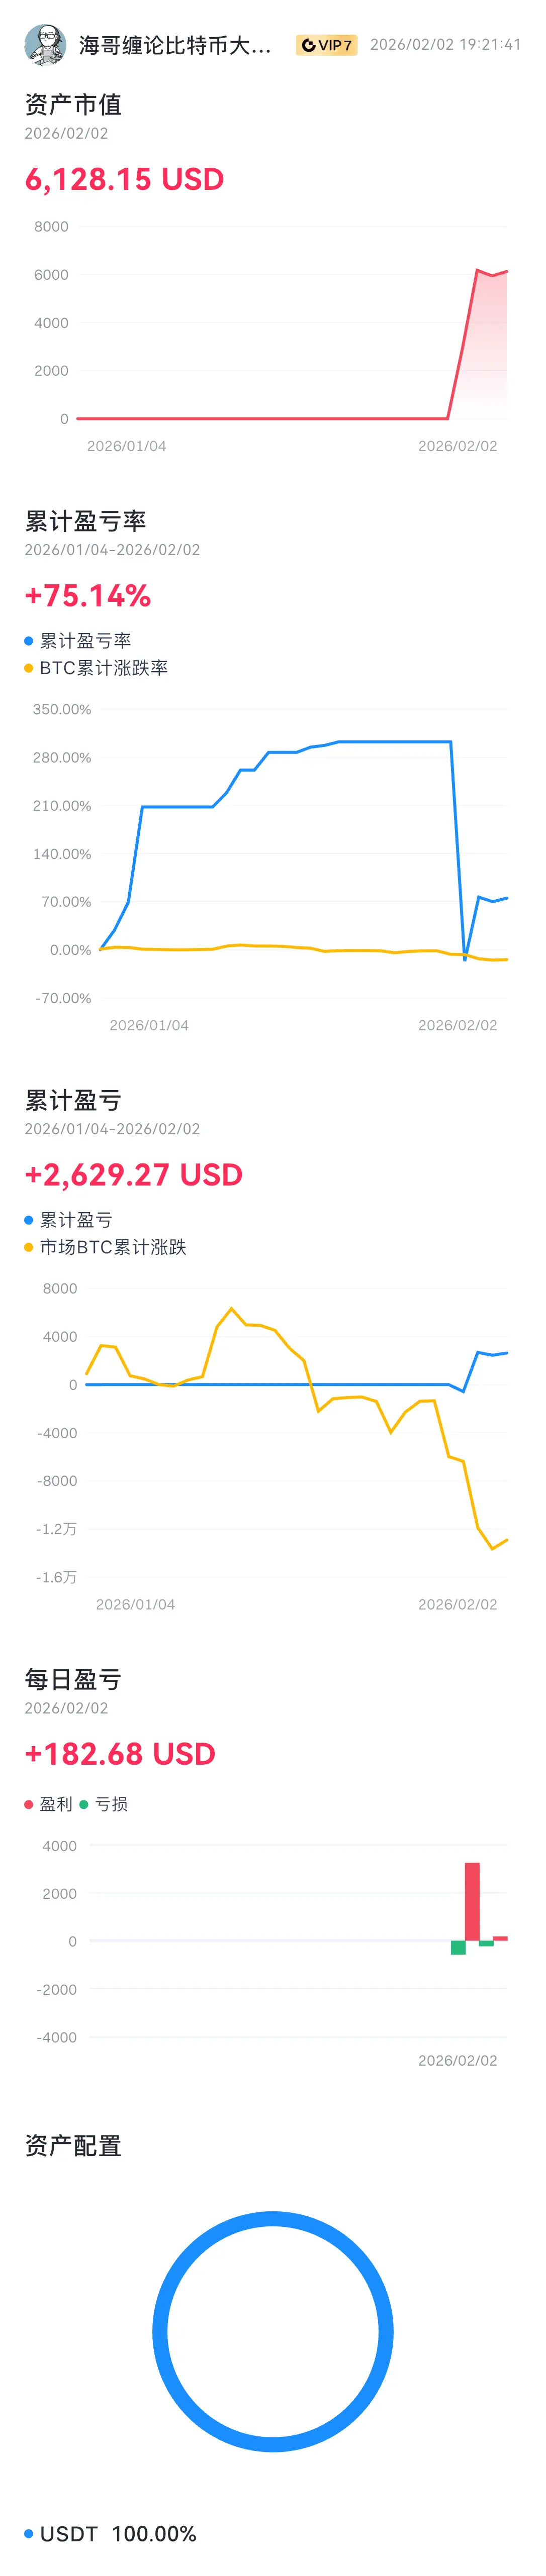
[The user has shared his/her trading data. Go to the App to view more.]
- Reward
- like
- Comment
- Repost
- Share
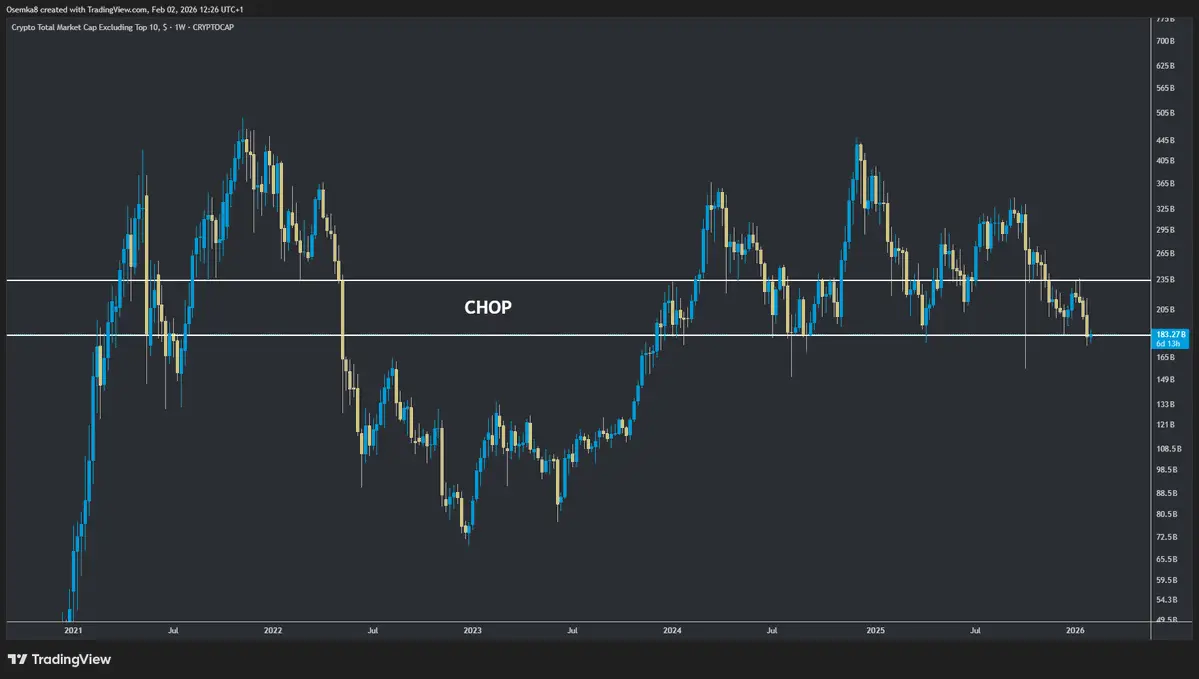
With all that\'s been going on during the weekend, altcoins $OTHERS have not yet lost the choppy range on chart
- Reward
- 1
- Comment
- Repost
- Share
It's a pity, Pan Tiantian is truly a girl, beautiful, tender, and cute. Everyone who has watched her understands. Her trilogy: Qixi, Girl's Regret, and The Secret of the Phone are all very nice. Highly recommended.
View Original
- Reward
- like
- Comment
- Repost
- Share
特斯马
TSM
Created By@NorthWarm
Listing Progress
100.00%
MC:
$13.05K
Create My Token
#BTCUSDT Take out the 30F chart from the pocket and look together: Structure: 4H oscillation, 30F lower rhythm: current 5F rebound reminder: pay attention to the completion status on the 30F, wait for a 30F central zone, then look for long and short opportunities. The Zen master said, in the mid-term correction, only the lower levels can be traded, so the 30F mid-term correction can only involve the 5F level. Isn’t it tiring? Are the transaction fees high?? What needs to be done now is to wait! This is just a record.
View Original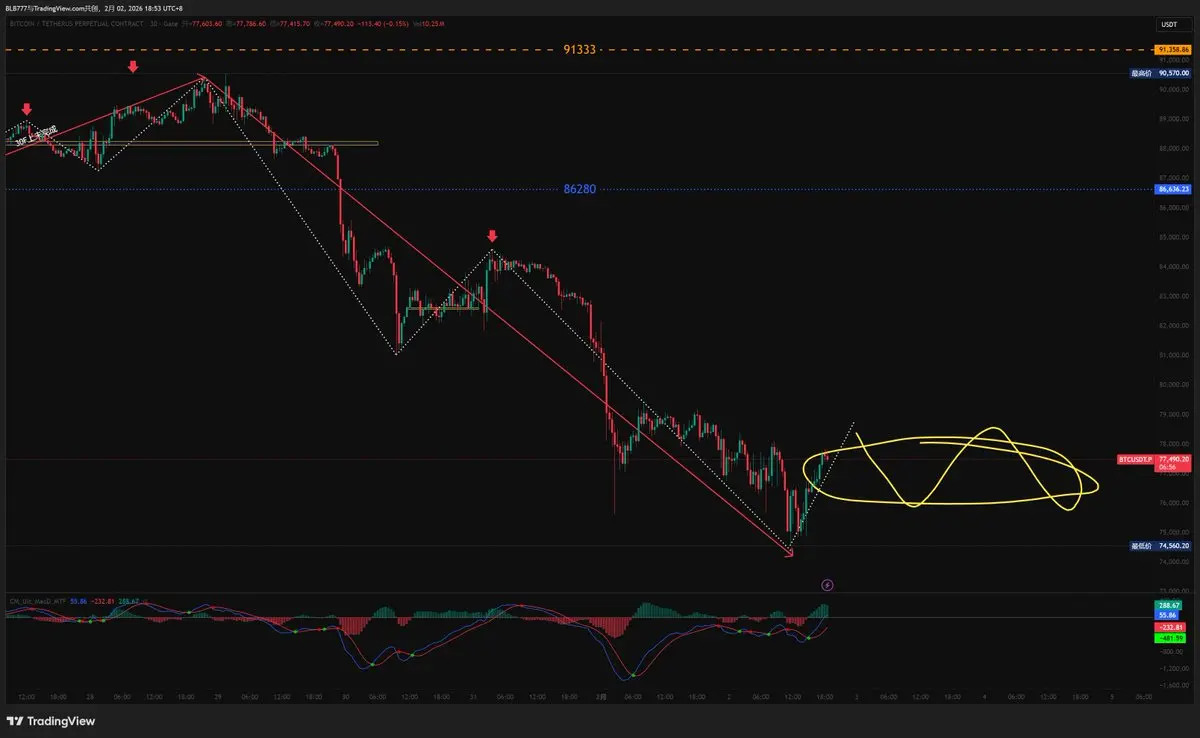
- Reward
- like
- 1
- Repost
- Share
BlackRoseExecutive:
Yes, I will wait for the right opportunity.
🚨 Apparently Trump has also sent the Nimitz aircraft carrier to the Middle East. #crypto

- Reward
- 1
- 1
- Repost
- Share
DragonFlyOfficial:
2026 GOGOGO 👊【$SUI Signal】Empty position + decline accompanied by abnormal open interest
$SUI price drops -2.72% with trading volume expanding to 370 million, but open interest remains high at 112 million USD. Market logic suggests that this should be considered in conjunction with open interest to determine whether it’s a long squeeze or main force distribution. The current market shows obvious selling pressure, with price action (PA) leaning weak. Until clear buy absorption or structural reversal signals appear, it is advisable to remain cautious.
🎯 Direction: Empty position
Trade 👇 $SUI
here
---
Fo
View Original$SUI price drops -2.72% with trading volume expanding to 370 million, but open interest remains high at 112 million USD. Market logic suggests that this should be considered in conjunction with open interest to determine whether it’s a long squeeze or main force distribution. The current market shows obvious selling pressure, with price action (PA) leaning weak. Until clear buy absorption or structural reversal signals appear, it is advisable to remain cautious.
🎯 Direction: Empty position
Trade 👇 $SUI
here
---
Fo
- Reward
- like
- Comment
- Repost
- Share
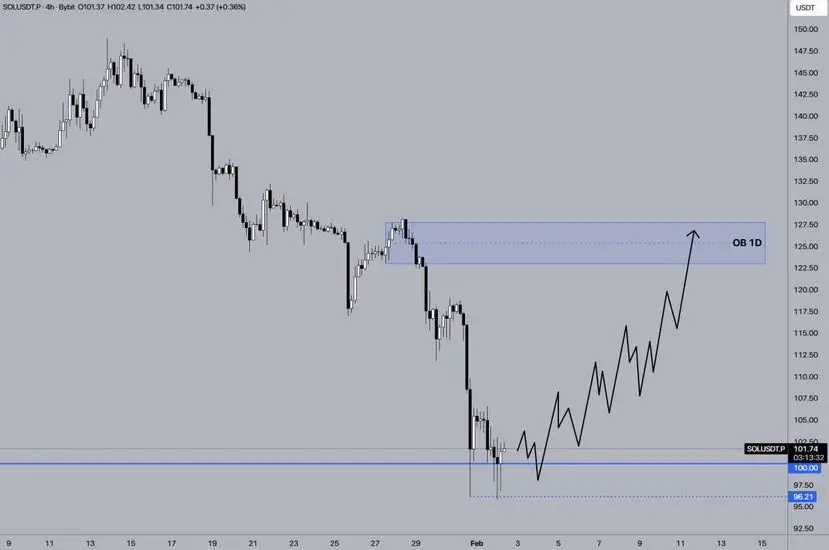
💰 $SOL Review/Analysis:
↗️ During its decline, SOL gathered liquidity below the $100 level and is now attempting to consolidate above it. If the price successfully consolidates above this level, an upward movement will begin. The main target for price growth is the OB 1D zone in the range of $123.0 - $127.8.
↗️ During its decline, SOL gathered liquidity below the $100 level and is now attempting to consolidate above it. If the price successfully consolidates above this level, an upward movement will begin. The main target for price growth is the OB 1D zone in the range of $123.0 - $127.8.
SOL-0,95%
- Reward
- 1
- Comment
- Repost
- Share
🔹 Price and sentiment under pressure: Bitcoin has fallen below $78,000. January marked one of its weakest performances in years, with market confidence deteriorating. Under persistent sell
201
- Reward
- 1
- Comment
- Repost
- Share
U.S. stocks and gold and silver experienced a short-term rebound, and the crypto market also surged. This is a oversold rebound, not a trend reversal. Contract trading volume hasn't even reached five billion dollars, so there's no need to rush into long positions. Short at high levels #加密市场回调
View Original
- Reward
- 1
- 18
- Repost
- Share
GateUser-cd13cdf0:
Is the current opening price too high?View More
#TraditionalFinanceAcceleratesTokenization reflects the growing trend of mainstream financial institutions leveraging blockchain technology to tokenize traditional assets. From equities and bonds to real estate and commodities, major banks, investment funds, and insurance companies are increasingly converting their physical or financial assets into digital tokens. Tokenization allows these assets to be traded, transferred, or fractionalized on blockchain networks, offering unprecedented levels of liquidity, transparency, and accessibility.
📈 How Traditional Finance is Driving Tokenization can
📈 How Traditional Finance is Driving Tokenization can

- Reward
- 7
- 8
- Repost
- Share
DragonFlyOfficial:
2026 GOGOGO 👊View More
Load More
Join 40M users in our growing community
⚡️ Join 40M users in the crypto craze discussion
💬 Engage with your favorite top creators
👍 See what interests you
Trending Topics
View More377.64K Popularity
5.93K Popularity
5.94K Popularity
3.69K Popularity
2.43K Popularity
News
View MoreA whale has spent 1.94 million USDC to buy 414.37 XAUT in the past 3 hours.
5 m
The current mainstream CEX and DEX funding rates indicate that the market's bearish sentiment towards BTC and ETH is stronger than towards altcoins.
8 m
ZAMA token will be listed on the exchange and available for claiming today at 21:00.
9 m
Zama announces token staking details, will adopt liquidity staking method
16 m
The White House will hold a meeting with cryptocurrency and banking officials on stablecoin yields
18 m
Pin