Trade
Basic
Futures
Futures
Hundreds of contracts settled in USDT or BTC
TradFi
Gold
Trade global traditional assets with USDT in one place
Options
Hot
Trade European-style vanilla options
Unified Account
Maximize your capital efficiency
Demo Trading
Futures Kickoff
Get prepared for your futures trading
Futures Events
Participate in events to win generous rewards
Demo Trading
Use virtual funds to experience risk-free trading
Earn
Launch
CandyDrop
Collect candies to earn airdrops
Launchpool
Quick staking, earn potential new tokens
HODLer Airdrop
Hold GT and get massive airdrops for free
Launchpad
Be early to the next big token project
Alpha Points
Trade on-chain assets and enjoy airdrop rewards!
Futures Points
Earn futures points and claim airdrop rewards
Investment
Simple Earn
Earn interests with idle tokens
Auto-Invest
Auto-invest on a regular basis
Dual Investment
Buy low and sell high to take profits from price fluctuations
Soft Staking
Earn rewards with flexible staking
Crypto Loan
0 Fees
Pledge one crypto to borrow another
Lending Center
One-stop lending hub
VIP Wealth Hub
Customized wealth management empowers your assets growth
Private Wealth Management
Customized asset management to grow your digital assets
Quant Fund
Top asset management team helps you profit without hassle
Staking
Stake cryptos to earn in PoS products
Smart Leverage
New
No forced liquidation before maturity, worry-free leveraged gains
GUSD Minting
Use USDT/USDC to mint GUSD for treasury-level yields
More
TheBuzzingBee
🚨 RIPPLE HAS OFFICIALLY CONQUERED THE EU! 🇪🇺🚀
The news we have been waiting for is finally here! Ripple has officially secured its full Electronic Money Institution (EMI) license from the CSSF in Luxembourg!
This is a monumental victory for Ripple, the #XRP community, and the future of digital finance.
🔹️Here is why this is a massive deal:
EU Wide Passporting Power:
With this license, Ripple can now "passport" its services across all 27 EU member states. No more jumping through hoops in every individual country it’s full speed ahead for the entire European Union!
⚡️Institutional Adopti
XRP0,18%
- Reward
- like
- Comment
- Repost
- Share
Check out Gate and join me in the hottest event! https://www.gate.com/id/campaigns/3988?ch=816&ref=VQVMB1BDCQ&ref_type=132

- Reward
- like
- Comment
- Repost
- Share
When the market dips, the most important thing is not speed, but clarity.
Most people panic because they confuse price movement with value change.
A dip doesn’t automatically mean something is broken. Sometimes it simply means liquidity is shifting, weak hands are exiting, or the market is taking a breath after excess optimism.
This is where discipline separates participants from spectators.
Chasing green candles feels good emotionally, but it rarely builds long-term conviction. Dips, on the other hand, force you to answer hard questions:
Do you actually understand what you’re holding?
Do you

- Reward
- 2
- Comment
- Repost
- Share
暗网入口
暗网
Created By@GateUser-8e1712fd
Listing Progress
0.00%
MC:
$0.1
Create My Token
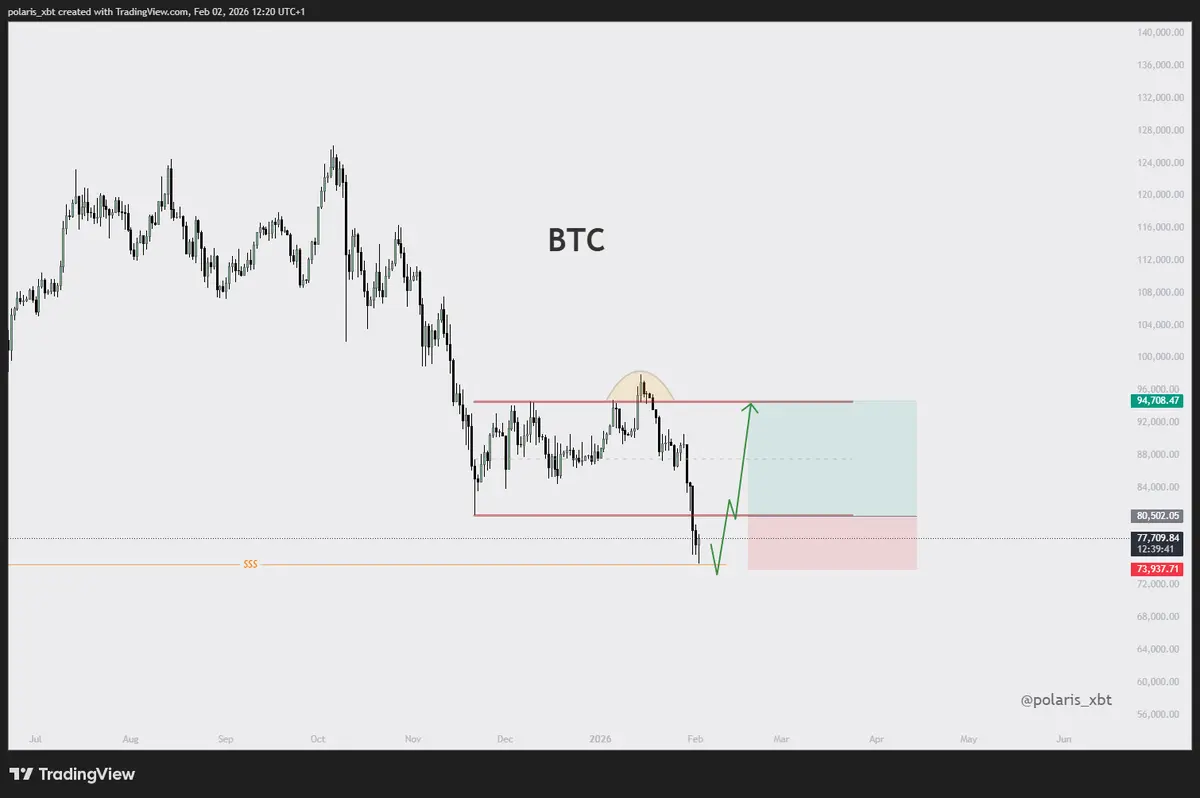
Bitcoin continues to probe lower approaching a new 2025 low.Could panic be hiding a turning point?
0
- Reward
- 2
- Comment
- Repost
- Share
- Reward
- 2
- 2
- Repost
- Share
IfYouCan'tPickItUp,It's :
:
I'm with you! 139 coins😘 profit—please let me know.View More
BTC1! 4H GAP formed in the CME futures market over this weekend
View Original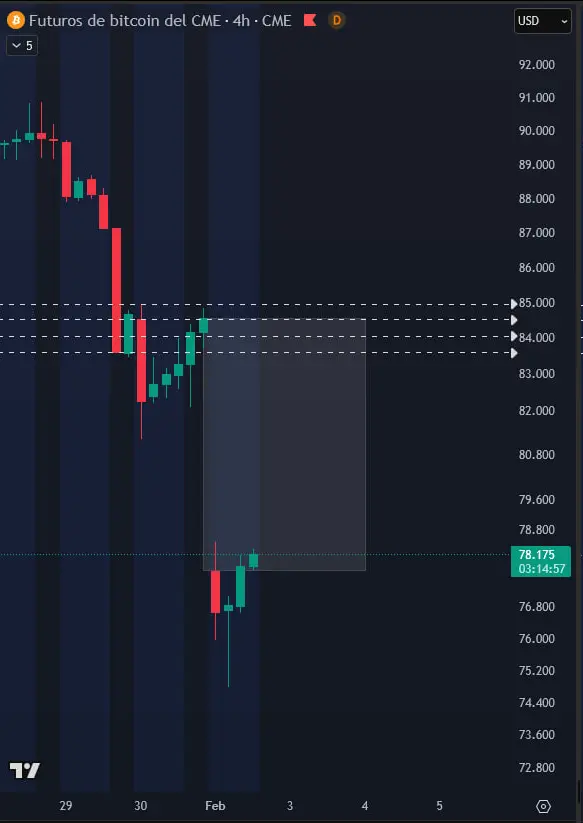
- Reward
- like
- Comment
- Repost
- Share
BTC Prediction and Market Analysis
1.763
- Reward
- 3
- 1
- Repost
- Share
GateUser-37edc23c:
nice possssssssst goooood【$BTC Signal】Empty Position + Position Change Observation
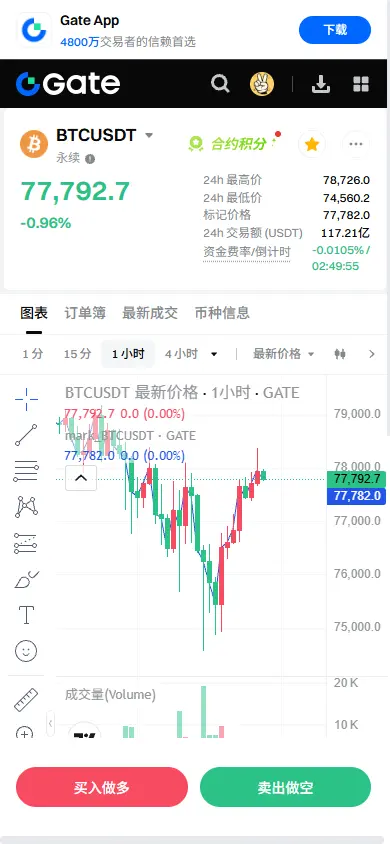
$BTC Price decline accompanied by high open interest, indicating the market is at a critical decision point—it's necessary to determine whether this is a healthy correction or the main force is distributing.
🎯 Direction: Empty Position
Current Market Logic: Price is falling but open interest (OI) remains high, which is a typical signal of intensified bullish and bearish competition. Market logic suggests that judgment should be based on price action: if the price cannot quickly recover key support levels (such as the 77,500-78,000 ra
View Original$BTC Price decline accompanied by high open interest, indicating the market is at a critical decision point—it's necessary to determine whether this is a healthy correction or the main force is distributing.
🎯 Direction: Empty Position
Current Market Logic: Price is falling but open interest (OI) remains high, which is a typical signal of intensified bullish and bearish competition. Market logic suggests that judgment should be based on price action: if the price cannot quickly recover key support levels (such as the 77,500-78,000 ra
- Reward
- like
- Comment
- Repost
- Share
ACCOUNT CLOSEDCZ IS GOING TO JAIL AND GOING TO FALL LIKE FTX
- Reward
- like
- Comment
- Repost
- Share
🔥🔥🔥🔥🔥🔥Justin Sun says he’ll buy up to $100M of #Bitcoin for TRON’s treasury. He says the strategy aims to capitalize on lower $BTC prices. 💛#crypto

- Reward
- like
- Comment
- Repost
- Share
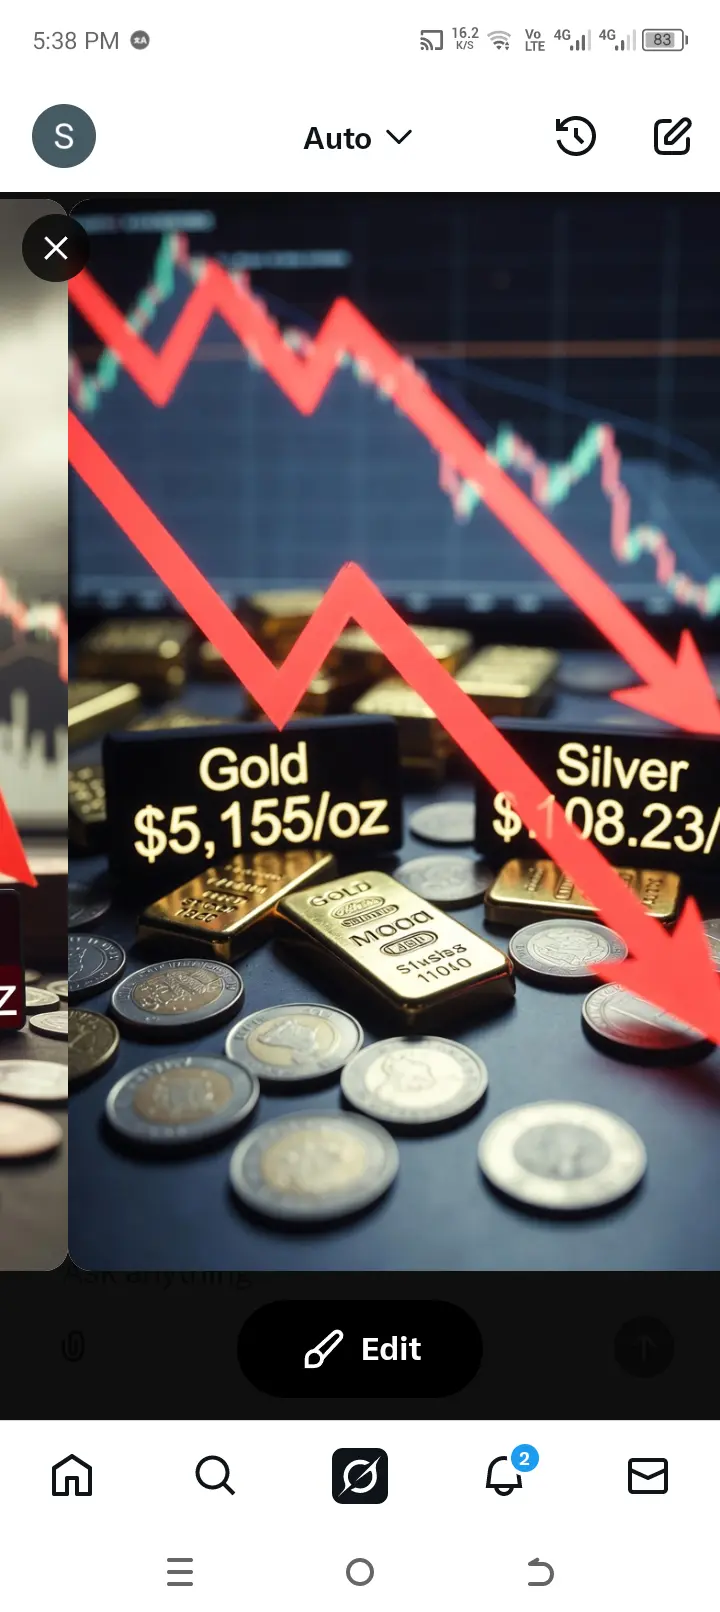
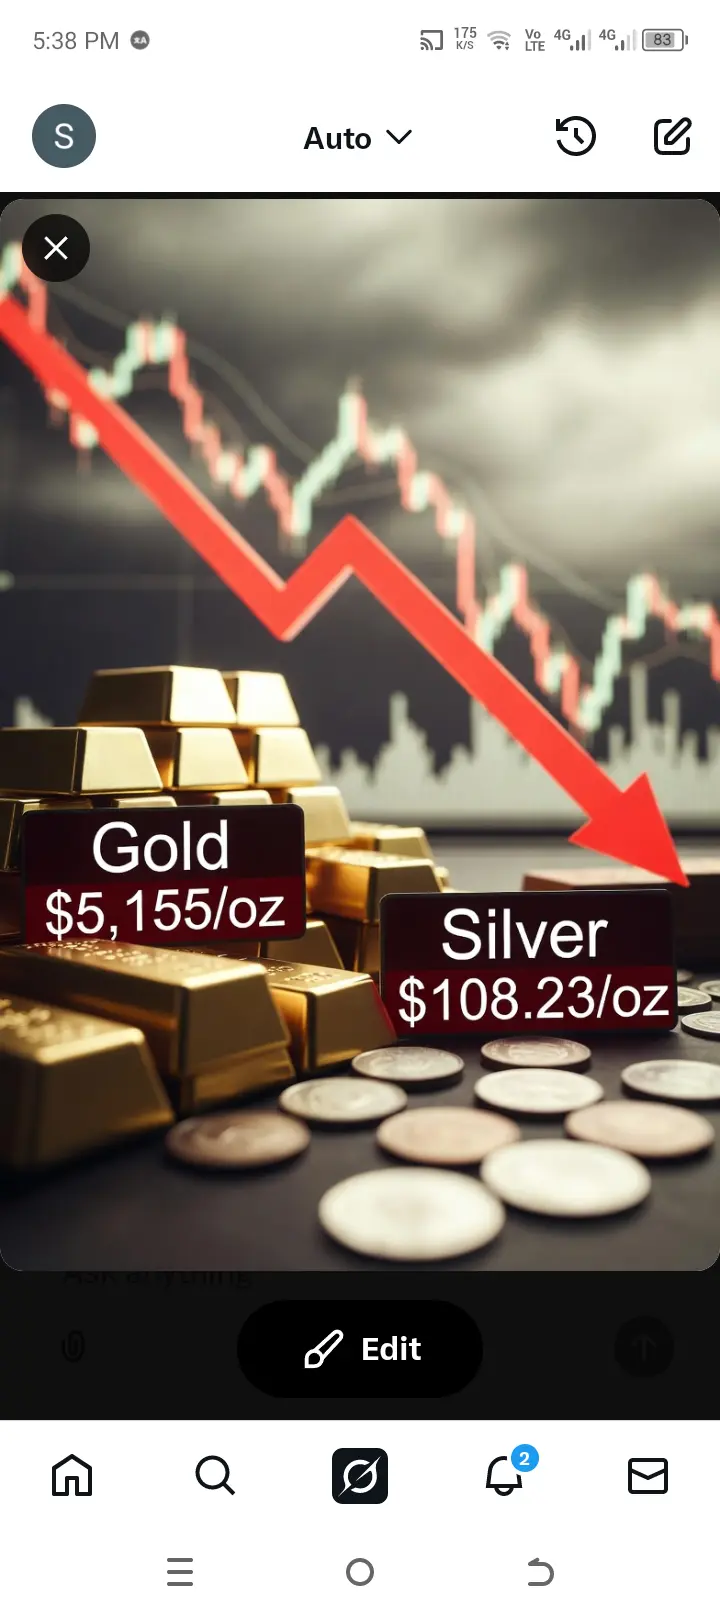
#PreciousMetalsPullBack 📉 Metals Market Update: Overnight Risk-Off Moves
Risk assets faced a sharp pullback overnight, and precious metals were not immune:
Gold: Slid $300 to $5,155/oz
Silver: Dropped nearly 8% to $108.23/oz
💭 What this tells us:
Market sentiment is shifting toward caution, with traders reducing exposure to both equities and some safe-haven metals.
Volatility spikes create both risk and opportunity — timing and structural context are key.
Macro factors, including geopolitical tensions, inflation expectations, and liquidity conditions, are likely influencing this sudden move.
- Reward
- 1
- 1
- Repost
- Share
Yusfirah:
2026 GOGOGO 👊CCB
长城币
Created By@GateUser-ff5981fc
Listing Progress
0.00%
MC:
$0.1
Create My Token
Gold and silver markets are surging, and the High-Multiplier Trading Challenge is officially live. Simply sign up to instantly claim 10 USDT, then start trading futures to unlock a variety of rewards... https://www.gate.com/id/campaigns/3968?ch=799&ref=VQVHBFPEUW&ref_type=132

- Reward
- 2
- Comment
- Repost
- Share
Li Xingye, the author of "Married Woman's Dating Guide," did he also get liquidated during this time of gold, silver, U.S. stocks, and cryptocurrency crashes? Or was it just a marketing stunt?
View Original
- Reward
- like
- Comment
- Repost
- Share
$BTCLong scenario.Sweep of April lows and range reclaim = market long.
- Reward
- like
- Comment
- Repost
- Share
JUST IN: 🇺🇸 White House to meet with #crypto firms and banks at 1 p.m. ET today to discuss market structure bill. #crypto
- Reward
- like
- Comment
- Repost
- Share

- Reward
- 2
- 2
- Repost
- Share
muhammadAshfaq:
hi dearView More
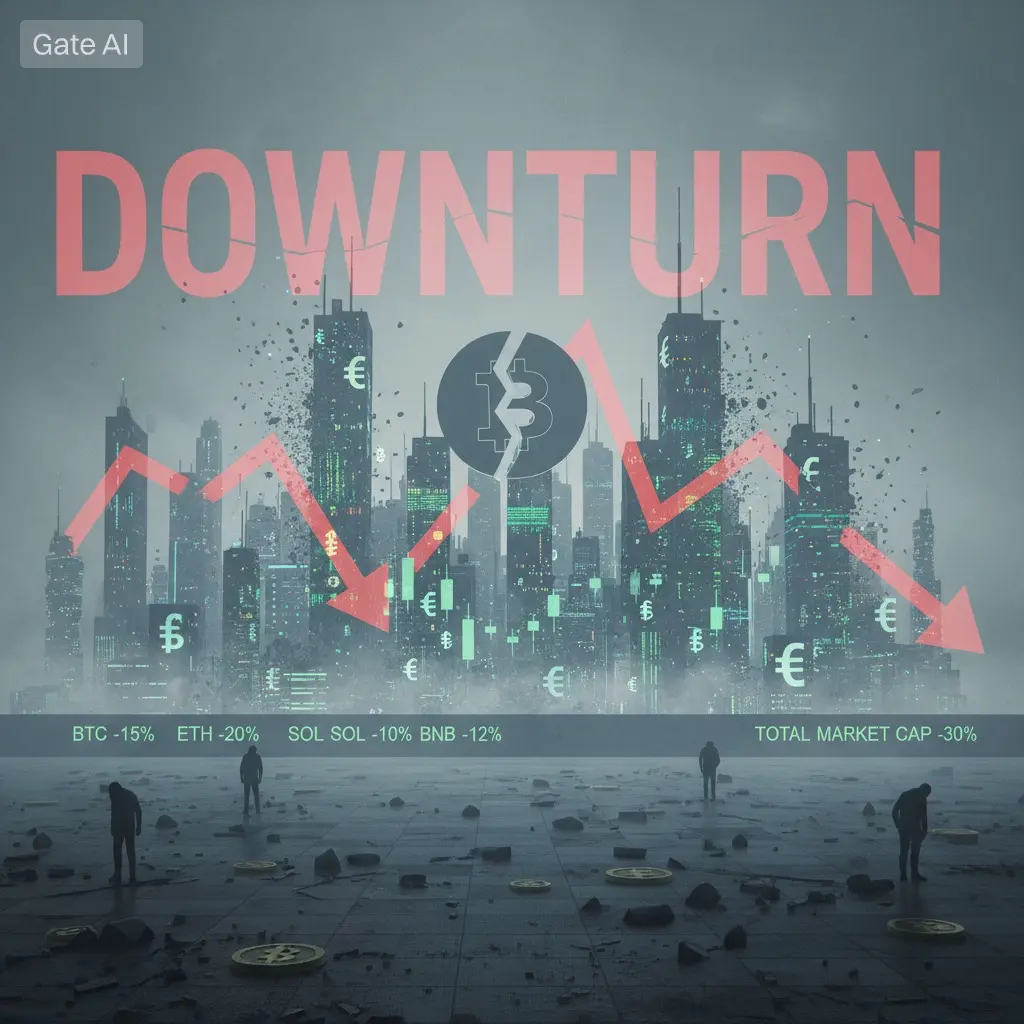
#CryptoMarketPullback
The crypto market is experiencing a noticeable pullback today, a move that comes after several weeks of strong upward momentum across Bitcoin and major altcoins. This correction appears to be a natural phase following recent rallies, as prices approached key resistance levels and traders began locking in profits. Rather than signaling weakness, this pullback reflects a healthy market reset, allowing overheated conditions to cool down and setting the stage for more sustainable price action. On the macro side, uncertainty around global interest rates, a firmer US dollar, a
The crypto market is experiencing a noticeable pullback today, a move that comes after several weeks of strong upward momentum across Bitcoin and major altcoins. This correction appears to be a natural phase following recent rallies, as prices approached key resistance levels and traders began locking in profits. Rather than signaling weakness, this pullback reflects a healthy market reset, allowing overheated conditions to cool down and setting the stage for more sustainable price action. On the macro side, uncertainty around global interest rates, a firmer US dollar, a
- Reward
- 2
- Comment
- Repost
- Share
#AIBT 来吧来吧!让我们携手共进,共同创造一个更加美好的AIBT。


- Reward
- like
- 1
- Repost
- Share
Galaaxs:
The grid robot is an automated trading strategy suitable for volatile markets, allowing for high sell and low buy operations. It is effective in the short, medium, and long term. You only need to set parameters such as price range and grid quantity, and the robot will operate automatically to perform arbitrage.
Once running, the robot will divide the funds into several equal parts according to the plan. As the market fluctuates, it continuously buys low and sells high to capture volatility profits.
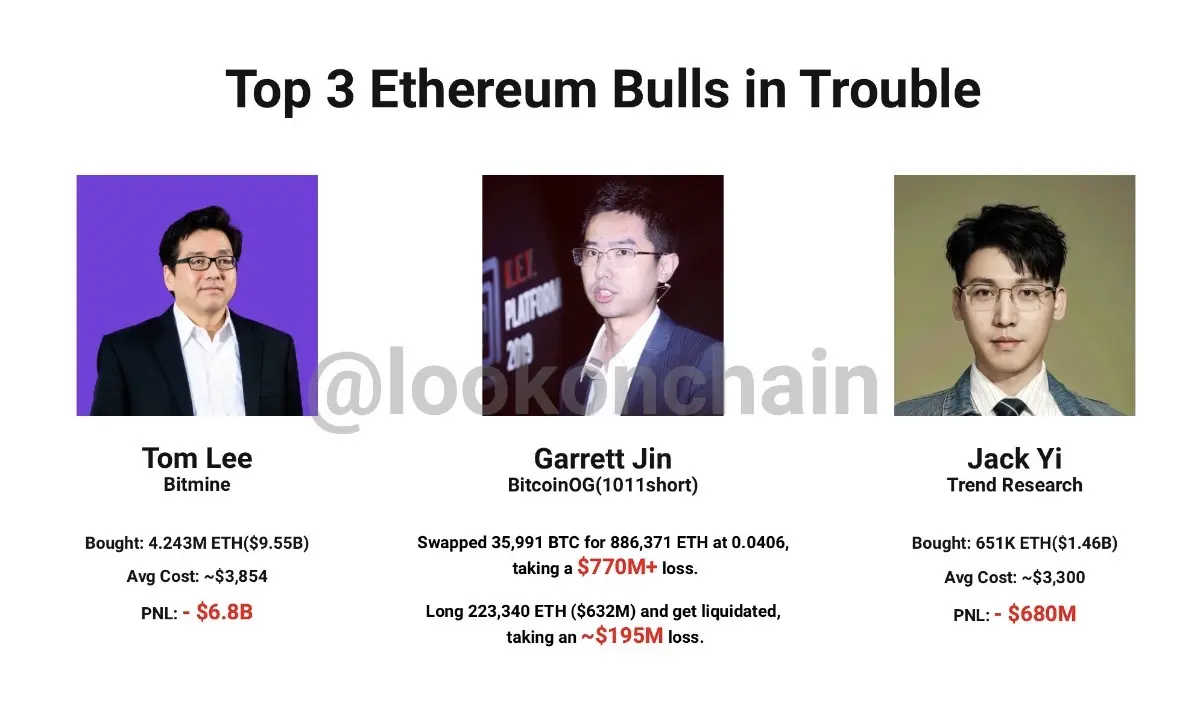
Tough times for ETH bullsUnexpected twist in cryptoHow those deep pocket guys didn\'t saw the upcoming dump thats so strange🙄😳Big question ❓❓ Who is selling when influencers, Institutions, Govt., Retailers are not?
ETH-3,4%
- Reward
- like
- Comment
- Repost
- Share
Load More
Join 40M users in our growing community
⚡️ Join 40M users in the crypto craze discussion
💬 Engage with your favorite top creators
👍 See what interests you
Trending Topics
View More378.7K Popularity
7.35K Popularity
7.17K Popularity
4.24K Popularity
2.83K Popularity
News
View MoreKorean regulatory agency expands AI system to track cryptocurrency manipulation activities
13 m
Bloomberg: SpaceX is in advanced talks to merge with xAI, and the merger announcement could be made as early as this week.
16 m
Opinion: The crypto bear market cycle is expected to reverse by 2026, with Bitcoin potentially bottoming out around $60,000.
26 m
Michael Saylor: Strategy has accumulated a total of 713,502 BTC, with an average purchase price of approximately $76,052.
29 m
Spot gold prices briefly surged past $4,800 per ounce, breaking through the short-term resistance level.
40 m
Pin