Can L1s Compete Against BTC as Cryptomoney?
The following is an excerpt from @ MessariCrypto‘s upcoming “The Crypto Theses 2026.” The full report will be available on December 18, 2025. Make sure to subscribe to Messari so you don’t miss it:
Cryptomoney Drives the Industry
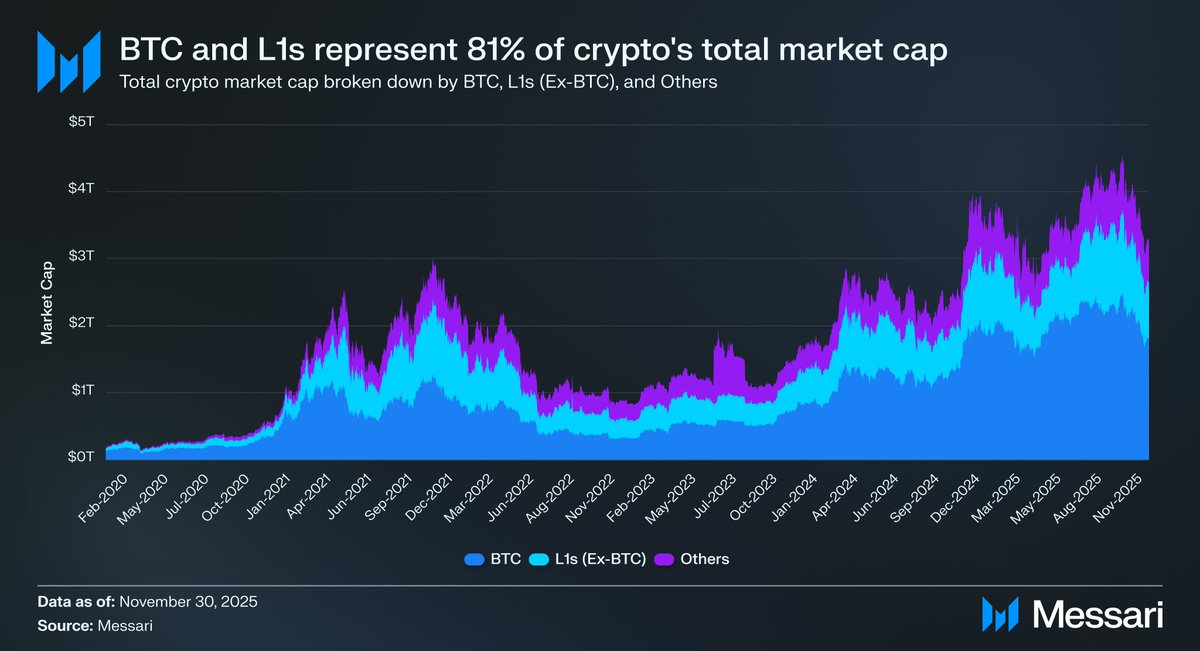
Refocusing the conversation on cryptomoney is important because that is ultimately what most capital in this industry is trying to gain exposure to. The total crypto market cap sits at $3.26 trillion. BTC accounts for $1.80 trillion of that, or 55%. Of the remaining $1.45 trillion, roughly $0.83 trillion is concentrated in alternative Layer-1s (L1s). Taken together, about $2.63 trillion, roughly 81% of all capital in crypto, is allocated to assets the market either already treats as money or believes could accrue a monetary premium.
Given that, whether you’re a trader, investor, capital allocator, or builder, understanding how the market assigns and withdraws monetary premium is essential. Nothing in crypto moves valuations more than the market’s willingness (or unwillingness) to treat an asset as money. For that reason, forecasting where monetary premiums will accrue in the future is arguably the single most important input to portfolio construction in this industry.
Up to this point, we’ve focused mainly on BTC, but it’s also worth discussing the other $0.83 trillion of assets that may or may not be money. As mentioned earlier, we anticipate that BTC will continue to capture market share from gold and other non-sovereign stores of wealth in the coming years. But where does that leave L1s? Does a rising tide lift all boats, or does BTC partly make up the ground on gold by pulling monetary premium away from alternative L1s?
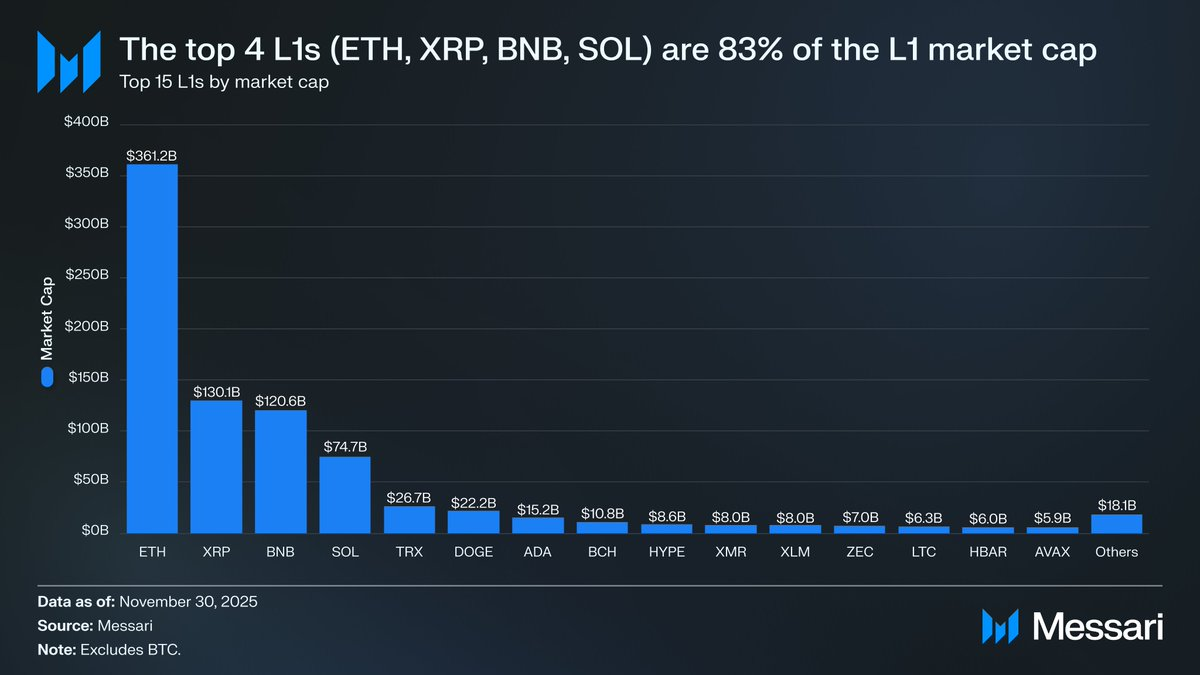
First, it’s helpful to look at where L1 valuations stand today. The top four L1s, ETH ($361.15 billion), XRP ($130.11 billion), BNB ($120.64 billion), and SOL ($74.68 billion), combine for a market cap of $686.58 billion, accounting for 83% of the alternative L1 segment. After the top four, valuations drop off quickly (TRX sits at $26.67 billion), but interestingly, the long tail is still sizable. L1s outside of the top 15 collectively hold $18.06 billion in market cap, representing 2% of the total alternative L1 market cap.
Importantly, L1 market caps are not a pure reflection of an implied monetary premium. There are three main L1 valuation frameworks:
(i) Monetary Premium,
(ii) Real Economic Value (REV), and
(iii) Demand for Economic Security,
Therefore, a project’s market cap is not solely the result of the market treating it as money.
Monetary Premium, Not Revenue, Drives L1 Valuations
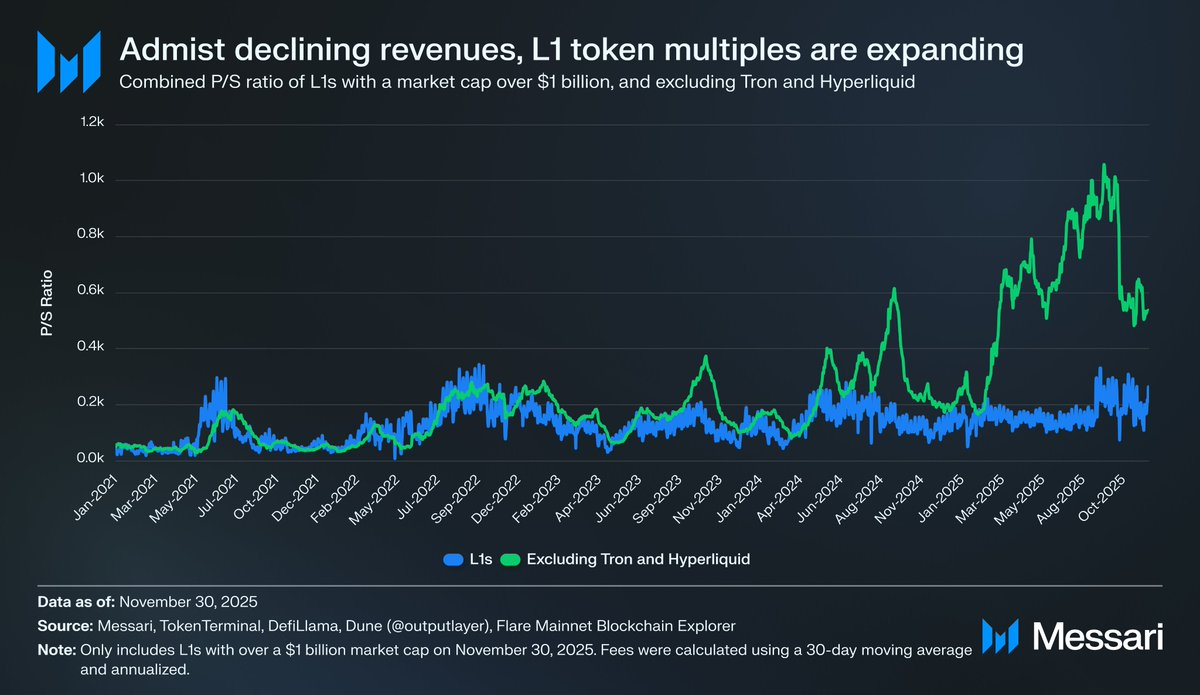
Despite these competing valuation frameworks, the market is increasingly valuing L1s through a monetary-premium lens rather than a revenue-driven one. Over the past few years, the collective price-to-sales (P/S) ratio of all L1s with a market cap above $1 billion has remained relatively stable, generally ranging from 150x-200x. However, this headline number is misleading because it includes TRON and Hyperliquid. Over the last 30 days, TRX and HYPE generated 70% of the revenue in this group but account for only 4% of the market cap.
Once you remove those two outliers, the real story becomes clear: L1 valuations have been rising even as revenues have been falling. The adjusted P/S ratio has consistently trended higher:
- Nov. 30, 2021 - 40x
- Nov. 30, 2022 - 212x
- Nov. 30, 2023 - 137x
- Nov. 30, 2024 - 205x
Nov. 30, 2025 - 536x
A REV-based interpretation could argue that the market is simply pricing in future revenue growth. But, this explanation falls apart under basic scrutiny. Among this same basket of L1s (still excluding TRON and Hyperliquid), revenues have declined in every year except one:
2021 - $12.33 billion
- 2022 - $4.89 billion (down 60% YoY)
- 2023 - $2.72 billion (down 44% YoY)
- 2024 - $3.55 billion (up 31% YoY)
2025 - $1.70 billion annualized (down 52% YoY)
In our view, the simplest and most straightforward explanation is that these valuations are being driven by monetary premiums, rather than by current or future revenues.
L1s Consistently Underperform Bitcoin
If L1 valuations are being driven by expectations of a monetary premium, then the next step is to understand what actually shapes those expectations. A simple way to test this is to compare the price performance to that of BTC. If monetary premium expectations are mostly just a reflection of BTC’s price movements, then these assets should behave like beta to BTC. On the other hand, if monetary premium expectations were driven by something unique to each L1, we would expect a much weaker correlation with BTC and far more idiosyncratic performance.
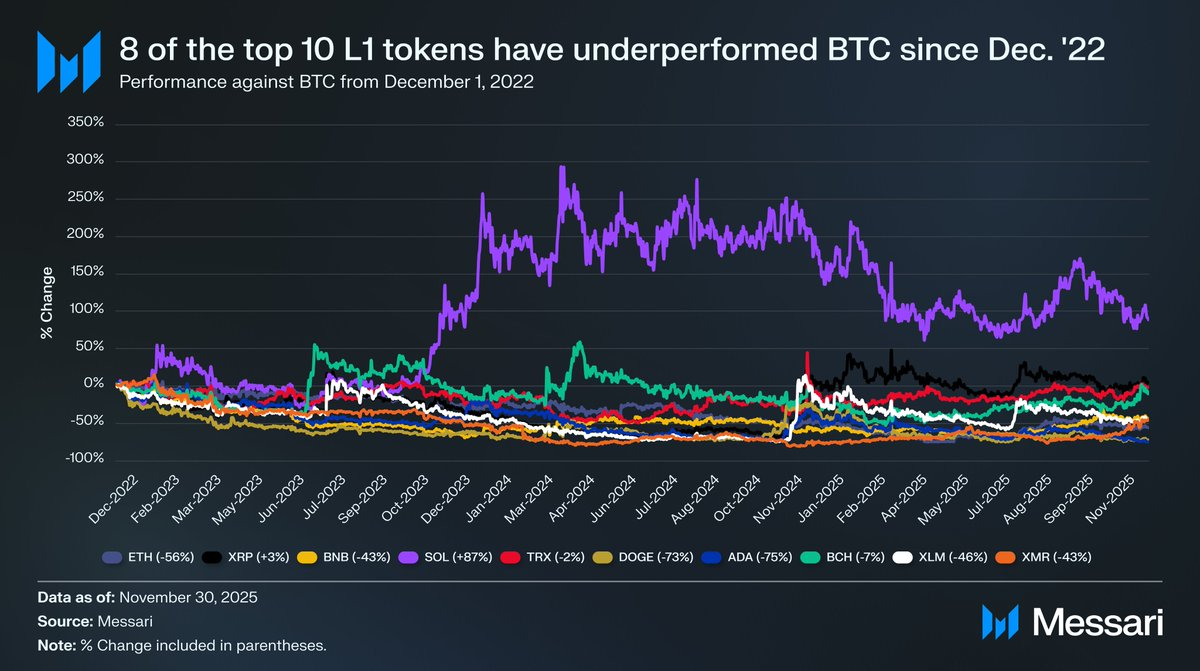
As a proxy for L1s, we examined the performance of the top ten L1 tokens (excluding HYPE) against BTC since December 1, 2022. These ten assets account for roughly 94% of the L1 market cap, so they provide a representative picture of the sector. Over this period, eight of the ten underperformed BTC on an absolute basis. Six of them lagged by 40% or more. Only two assets outperformed BTC: XRP and SOL. XRP’s outperformance was just 3%, which we won’t over-index on, given XRP’s historically retail-driven flows. The only asset with meaningful outperformance was SOL, which outperformed BTC by 87%.
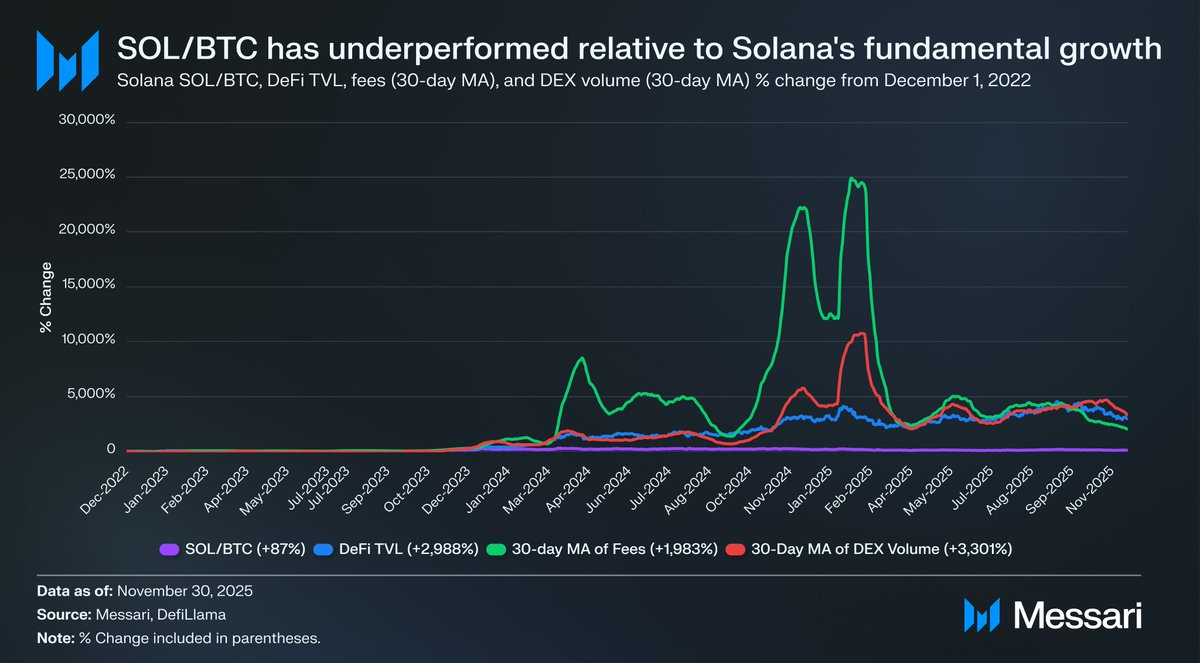
Diving deeper into SOL’s outperformance, it actually appears that it may have underperformed. Over the same period that SOL outperformed BTC by 87%, Solana’s fundamentals went parabolic. DeFi TVL increased by 2,988%, fees by 1,983%, and DEX volume by 3,301%. By any reasonable measure, Solana’s ecosystem has grown anywhere from 20x to 30x since the end of 2022. Yet SOL, the asset meant to capture that growth, only managed to outperform BTC by 87%.
Read that again.
To generate meaningful outperformance against BTC, an L1 didn’t need its ecosystem to grow by 200-300%. It needed 2,000-3,000% growth just to produce high-double-digit outperformance.
Based on all the above, we believe that while L1s are still being valued on the hope of future monetary premiums, the market’s confidence in those expectations is quietly eroding. Meanwhile, the market is not losing faith in BTC’s monetary premium, and if anything, BTC’s lead against L1s is widening.
And while cryptomoney doesn’t technically need fees or revenue to justify its valuation, those metrics do matter for L1s. Unlike BTC, their core narrative depends on building an ecosystem (applications, users, throughput, economic activity, etc.) that supposedly supports the token. However, if an L1’s ecosystem is showing year-over-year declines in usage, partly reflected by falling fees and revenue, then that L1 loses the one competitive advantage it had over BTC. Without real economic growth, the cryptomoney story for these L1s becomes increasingly difficult for the market to believe.
Going Forward
Going forward, we don’t expect this trend to reverse in 2026 or in the years to come. With a few possible exceptions, we expect alternative L1s to continue to lose market share to BTC. Their valuations, driven largely by expectations of a future monetary premium, will steadily compress as the market increasingly recognizes that BTC has the strongest claim to cryptomoney of them all. While Bitcoin will face challenges in the years ahead, those issues are too far out and too dependent on unknown variables to offer meaningful support to the monetary premiums of competing L1 assets today.
For L1s, the burden of proof has shifted. Their narratives are no longer compelling when set against BTC, and they can’t rely on broad market euphoria to justify their valuations indefinitely. The window where “we might be money someday” was enough to support trillion-dollar aspirations is closing. Investors now have a decade of data demonstrating that L1 monetary premiums only hold up during periods of extreme platform growth. Outside of those rare bursts, L1s consistently trail BTC, and when the growth fades, the monetary premium begins to fade with it.
Disclaimer:
- This article is reprinted from [AvgJoesCrypto]. All copyrights belong to the original author [AvgJoesCrypto]. If there are objections to this reprint, please contact the Gate Learn team, and they will handle it promptly.
- Liability Disclaimer: The views and opinions expressed in this article are solely those of the author and do not constitute any investment advice.
- Translations of the article into other languages are done by the Gate Learn team. Unless mentioned, copying, distributing, or plagiarizing the translated articles is prohibited.
Share
Content


Related Articles

The Future of Cross-Chain Bridges: Full-Chain Interoperability Becomes Inevitable, Liquidity Bridges Will Decline

Solana Need L2s And Appchains?

Sui: How are users leveraging its speed, security, & scalability?

Navigating the Zero Knowledge Landscape

What is Tronscan and How Can You Use it in 2025?