1. What are Bollinger Bands?
In cryptocurrency trading, Bollinger Bands are a widely used technical analysis indicator consisting of three lines that help evaluate price volatility and potential market trends. The three lines are:
Middle Band: Typically a 20-day Simple Moving Average (SMA), representing the asset's average price level.
Upper Band: Calculated as the middle band + 2 standard deviations. Standard deviation measures price volatility, so the upper band reflects the upper limit or high-volatility area of the price.
Lower Band:Calculated as the middle band – 2 standard deviations. The lower band reflects the lower limit or low-volatility area of the price.
Bollinger Bands help identify potential entry and exit opportunities, and whether the market is overheated (overbought) or oversold. When the price touches the upper band — market may be overheated (possible sell signal). When the price touches the lower band — market may be oversold (possible buy signal).
The thickness or width of the Bollinger Bands also provides information about market volatility. When the bands widen, it indicates increased market volatility; when the bands narrow, it signals reduced volatility, and may suggest an upcoming price breakout.
It is important to note that Bollinger Bands should not be used as a standalone buy/sell indicator. Due to the high volatility of crypto assets and uncertainty of the cryptocurrency market, traders commonly combine Bollinger Bands with other indicators (such as Relative Strength Index [RSI], Moving Average Convergence Divergence [MACD], etc.) to form a more comprehensive and reliable trading strategy.
2. Bollinger Bands Strategy Overview
This strategy combines Bollinger Bands + Moving Averages (MA), where Bollinger Bands provide the main signal and moving averages serve as secondary confirmation, i.e. short at the upper band, long at the lower band.
Entry Conditions
Long entry: The closing price touches the lower Bollinger Band, and the short-term MA is below the long-term MA.
Short entry: The closing price touches the upper Bollinger Band, and the short-term MA is above the long-term MA.
Exit Conditions
Long exit: Closing price touches the upper Bollinger Band.
Short exit: Closing price touches the lower Bollinger Band.
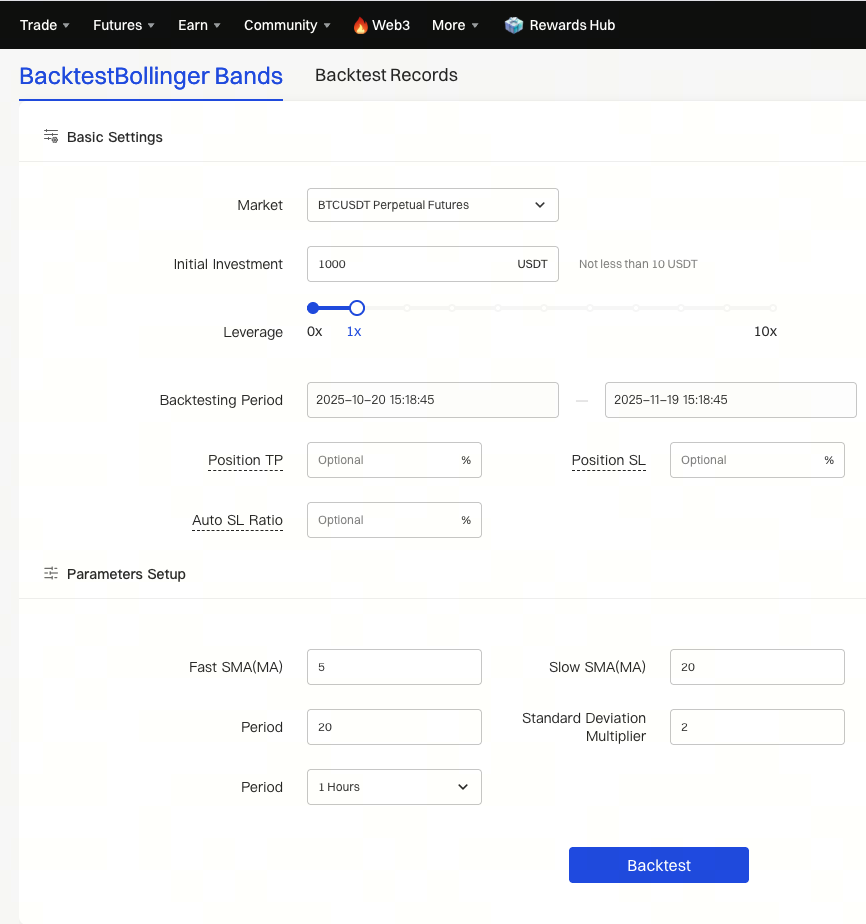
3. Bollinger Bands Parameter Explanation
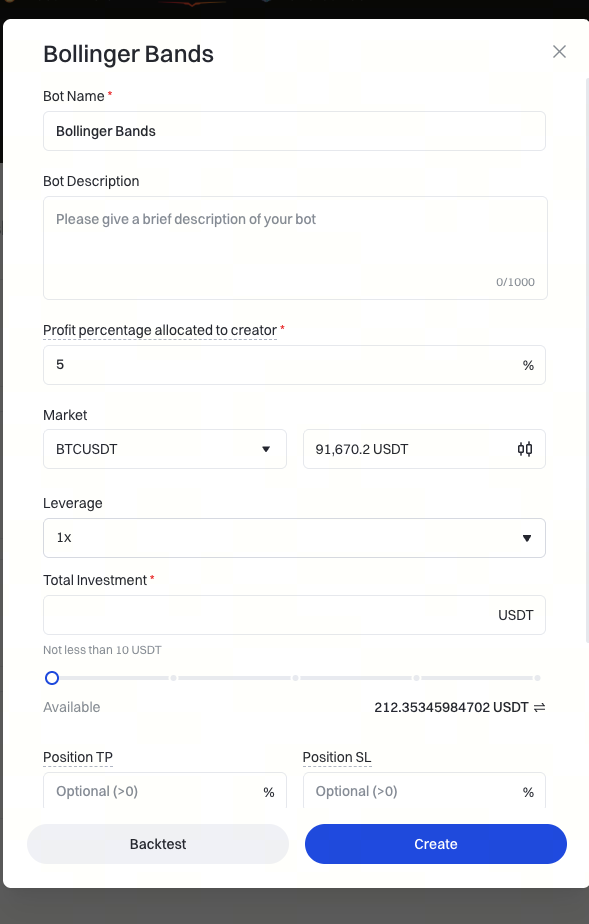
Leverage Multiplier: The leverage multiple used by the user for investment, mainly for calculating order quantity.
Total Investment Amount: Total funds allocated as margin for the strategy.
Auto Stop-Loss Ratio: When the strategy's loss reaches this ratio, all positions are closed.
Fast MA: Standard MA parameter, required integer value.
Slow MA: Standard MA parameter, required integer value.
Bollinger Band Period: Required integer value.
Bollinger Band Deviation Multiplier: Required integer value.
Period: Standard MA parameter. Required. Options: 1 minute, 5 minutes, 15 minutes, 30 minutes, 1 hour, 4 hours, 8 hours, 1 day. Default is 1 hour.
Order Quantity: Number of contracts to be placed when the signal is triggered. Optional; defaults to blank.
Default Contract Fee: 0.00075
Inverse Contracts:
S = (Margin ✖️ Latest Price) / (2 ✖️ 0.00075 + (1/Leverage))
size = s / Contract Size
Linear Contracts:
S = (Margin) / (2 ✖️ 0.00075 + (1/Leverage)) ✖️ Latest Price
size = s / Contract Size
The actual order quantity placed by the user will be the minimum of the default calculated value and the user-set value.
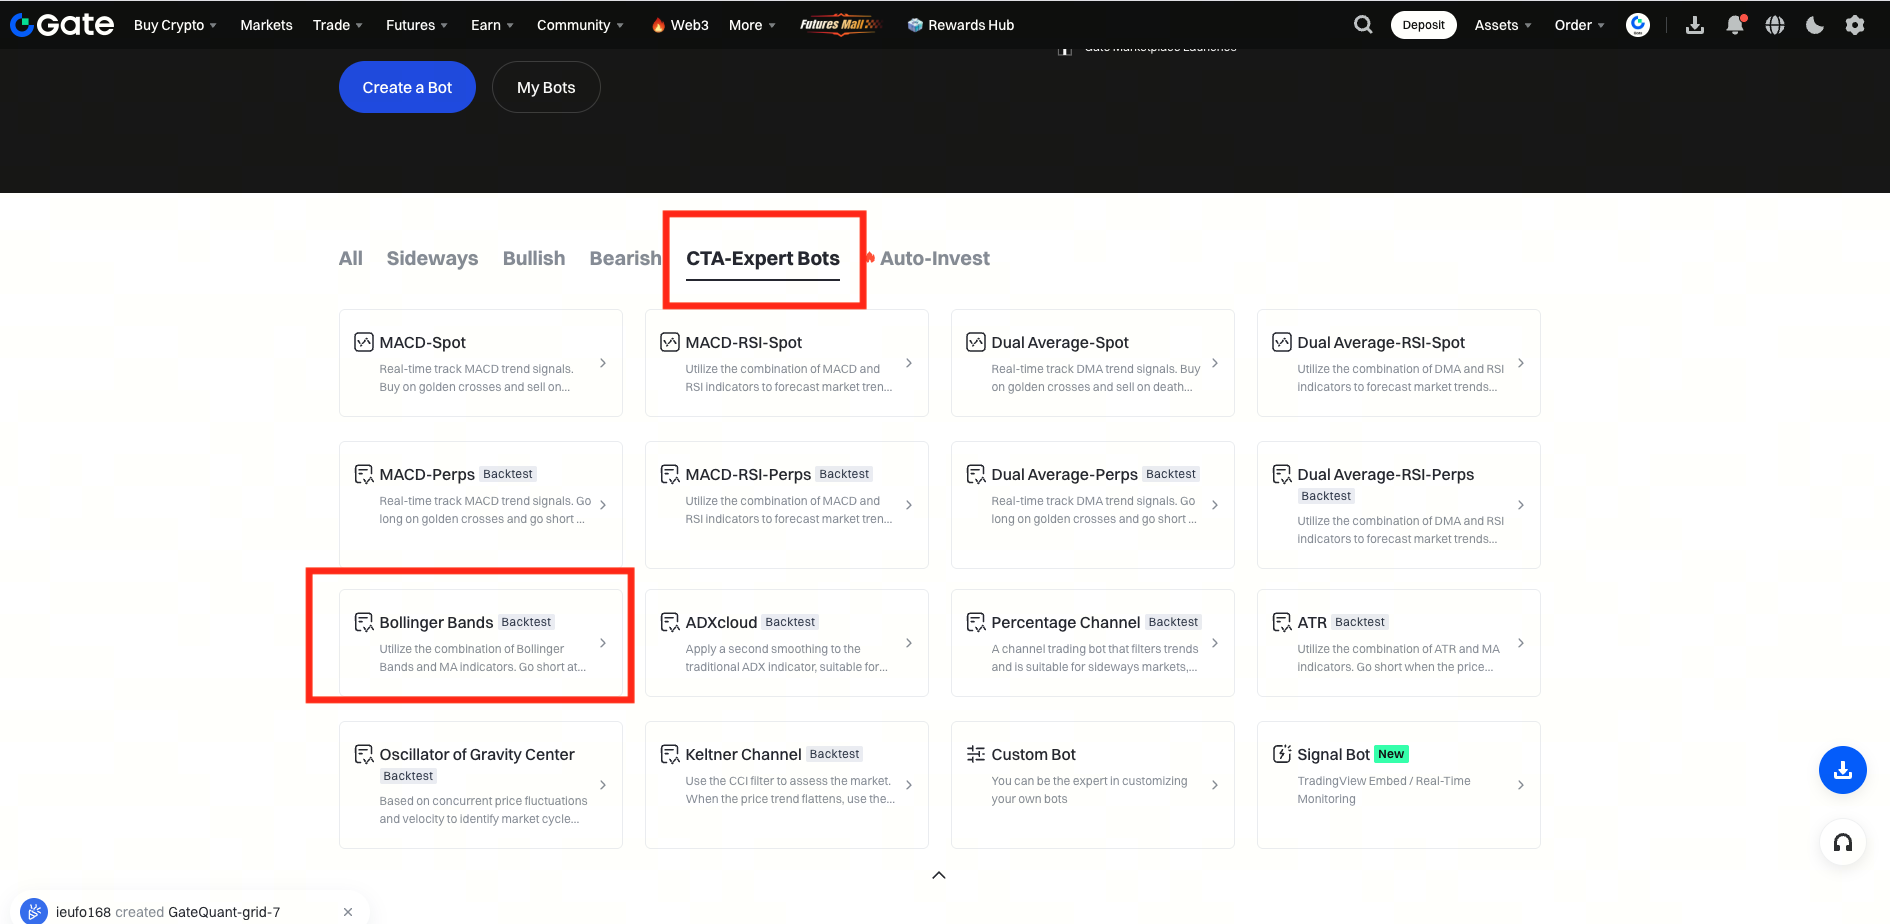
4. How to Create a Bollinger Bands Strategy?
4.1 Creation Process
Web:
Trading Bot – Create New Bot – CTA – Expert Bot – Bollinger Bands – Backtest – Set Parameters – Create.
Strategy Backtesting: Click the "Backtest" button in the image above. In the next screen, enter the desired parameters, then click the "Backtest" button below the chart. The system will automatically backtest the data (default is within one month). After filling in the relevant parameters, click the Create button to generate a backtest record under "Backtest Records" for reference.
Gate reserves all rights of final interpretation for this product.
For further assistance, please visit the official Gate support page or contact the customer service team.
