2025 TITN Price Prediction: Expert Analysis and Market Forecast for Titan Coin's Future Value

Introduction: TITN's Market Position and Investment Value
THORWallet (TITN) is a non-custodial DeFi wallet designed to bring decentralized finance to users globally, offering seamless cross-chain swaps, earning opportunities, asset management, and a multicurrency Swiss bank account functionality. As the fastest-growing cross-chain mobile interface by swap volume, THORWallet has established itself as a significant player in the decentralized finance ecosystem. As of December 2025, TITN's market capitalization has reached $164.67 million, with a circulating supply of approximately 42.5 million tokens and a current price hovering around $0.1647. This innovative asset is playing an increasingly crucial role in enabling accessible decentralized financial experiences for smartphone users worldwide.
This article will comprehensively analyze TITN's price trajectory and market dynamics, combining historical patterns, market supply and demand factors, ecosystem development, and macroeconomic conditions to provide investors with professional price forecasts and practical investment strategies for the coming period.
THORWallet (TITN) Market Analysis Report
I. TITN Price History Review and Current Market Status
TITN Historical Price Evolution
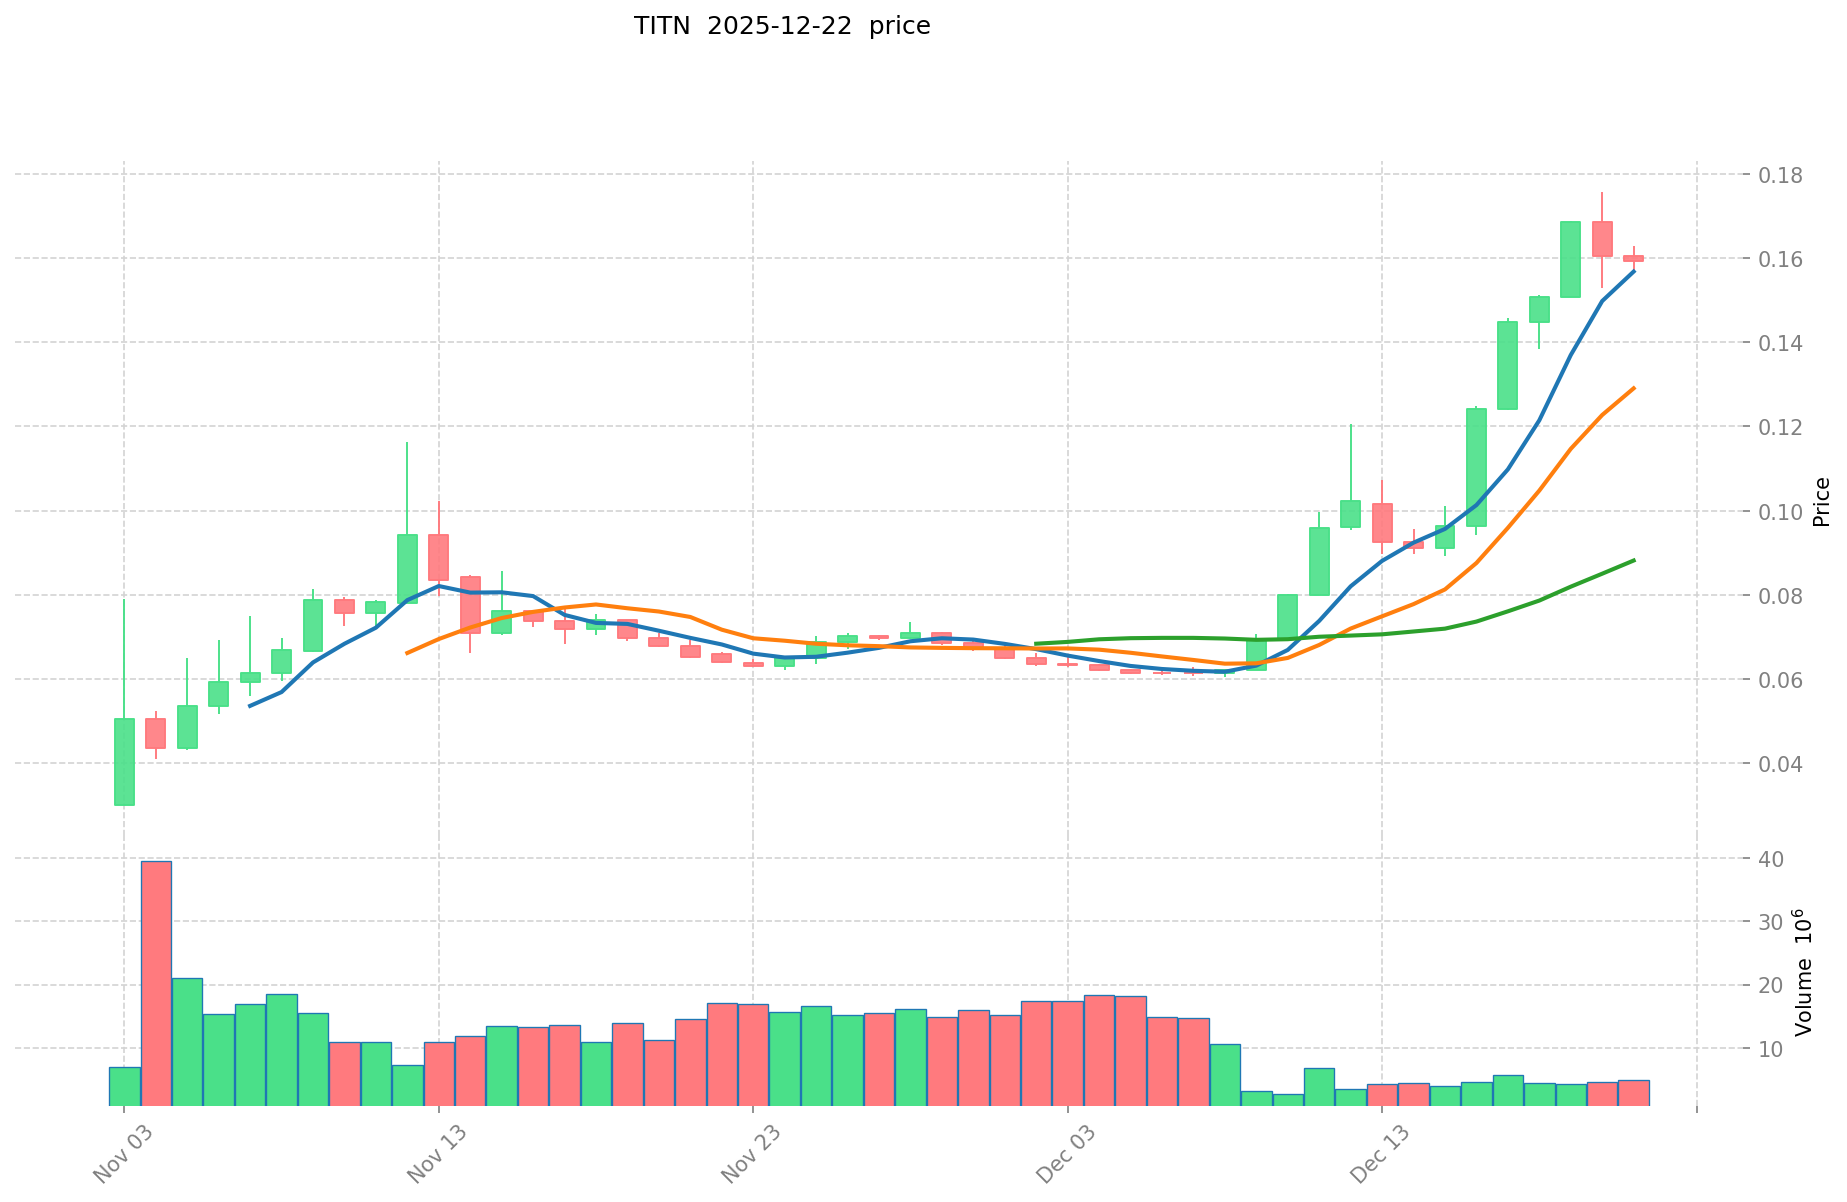
Based on available data, THORWallet (TITN) was launched on September 3, 2025, marking the beginning of its market journey. The token has experienced notable price movements since its inception:
- November 3, 2025: TITN reached its all-time low of $0.03, representing the initial market consolidation phase
- December 20, 2025: TITN achieved its all-time high of $0.17573, demonstrating significant appreciation of approximately 485% from the lowest point
- Current Period (December 23, 2025): The token is trading at $0.16467, reflecting a slight pullback from its peak
TITN Current Market Position
As of December 23, 2025, 02:26:20 UTC, TITN demonstrates the following market characteristics:
Price Metrics:
- Current Price: $0.16467
- 24-Hour Price Range: $0.1567 - $0.16636
- 24-Hour Change: +4.35%
- 7-Day Change: +65.36%
- 30-Day Change: +156.38%
- 1-Year Change: +99.17%
Market Capitalization & Supply:
- Current Market Cap: $6,998,475
- Fully Diluted Valuation: $164,670,000
- Circulating Supply: 42,500,000 TITN (4.25% of total supply)
- Total Supply: 1,000,000,000 TITN
- Market Dominance: 0.0050%
Trading Activity:
- 24-Hour Trading Volume: $790,206.19
- Token Holders: 1,837
- Primary Blockchain: BASE EVM
Recent Price Performance: The token has demonstrated strong upward momentum over the past month, gaining 156.38% in 30 days and 65.36% over the past week. Short-term volatility remains moderate, with a 4.35% increase in the last 24 hours and minimal 0.01% change in the past hour.
Click to view current TITN market price
TITN Market Sentiment Indicator
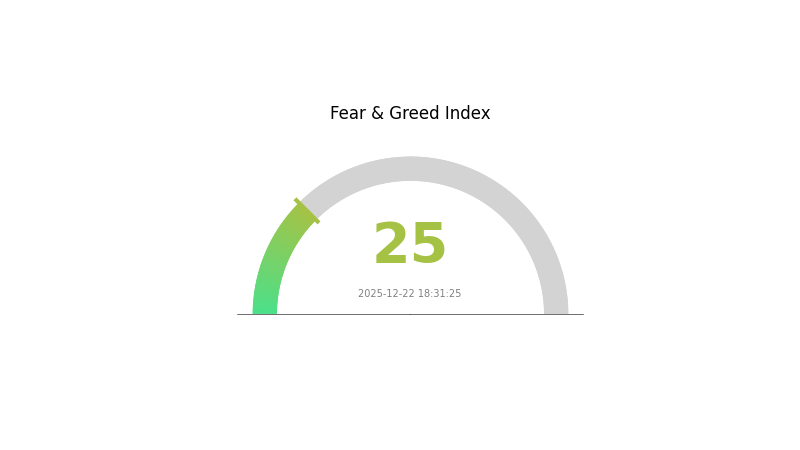
2025-12-22 Fear and Greed Index: 25 (Extreme Fear)
Click to view the current Fear & Greed Index
The crypto market is currently experiencing extreme fear, with the Fear and Greed Index at 25. This reading indicates heightened market anxiety and significant selling pressure across digital assets. When fear reaches such extremes, it often signals oversold conditions that may present contrarian opportunities for long-term investors. However, market participants should remain cautious and conduct thorough research before making investment decisions. Monitor key support levels and consider dollar-cost averaging strategies during these volatile periods. On Gate.com, you can track real-time market sentiment and adjust your portfolio strategy accordingly.
TITN Holdings Distribution
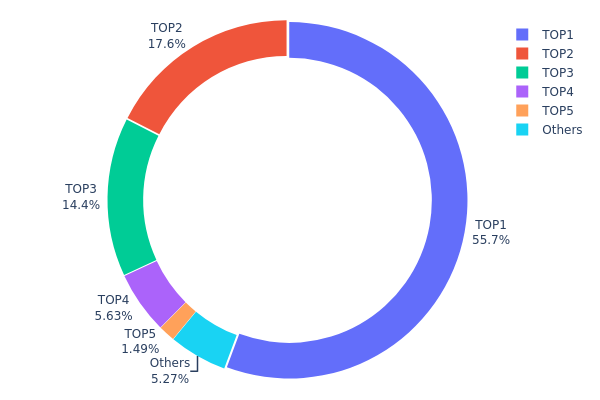
The address holdings distribution represents the concentration of TITN tokens across different blockchain addresses, providing crucial insights into the decentralization level and ownership structure of the token. This metric tracks the top token holders and their respective percentages of total supply, enabling analysts to assess market concentration risk and potential liquidity dynamics.
TITN exhibits significant concentration characteristics, with the top three addresses collectively controlling 87.60% of the total token supply. The leading address (0x68fb...7bcea9) alone dominates with 55.69% of holdings, representing the largest single concentration point. This extreme concentration in the top holder raises concerns regarding potential centralization risks. The second and third largest addresses hold 17.55% and 14.36% respectively, further consolidating control among a minimal number of entities. Beyond the top five addresses, which account for 94.71% of total supply, the remaining tokens are dispersed across numerous smaller addresses, with the "Others" category representing only 5.29% of holdings.
Such pronounced concentration creates considerable structural vulnerabilities within the TITN ecosystem. The market exhibits limited decentralization, with decision-making power and price influence concentrated among few address holders. This distribution pattern elevates the risk of significant price volatility, as coordinated movements by top holders could substantially impact market dynamics. The shallow liquidity outside the top holders' positions may constrain trading efficiency and increase slippage for retail participants, while the substantial holdings by major addresses present potential for market manipulation or sudden distribution events that could exert downward pressure on token valuation.
For real-time TITN holdings data, visit Gate.com Crypto Market Data
| Top | Address | Holding Qty | Holding (%) |
|---|---|---|---|
| 1 | 0x68fb...7bcea9 | 506982.68K | 55.69% |
| 2 | 0x269e...2b5327 | 159770.31K | 17.55% |
| 3 | 0xf6a3...24fef6 | 130811.50K | 14.36% |
| 4 | 0x786b...005b53 | 51227.07K | 5.62% |
| 5 | 0x0b35...48f7a3 | 13579.61K | 1.49% |
| - | Others | 47943.22K | 5.29% |
II. Core Factors Affecting TITN's Future Price
Supply Mechanism
- Fixed Supply: TITN has a capped total supply, with scarcity expected to drive long-term price appreciation.
- Historical Pattern: Under similar mechanisms, limited supply has previously supported price increases in other cryptocurrencies.
Technology Development and Ecosystem Building
- THORWallet Product Development: Progress in THORWallet product development and feature releases directly influences TITN token utility and adoption.
- Ecosystem Applications: The expansion of ecosystem partnerships and integration of TITN within the THORWallet platform affects token demand and market sentiment.
Macroeconomic Environment
- Overall Cryptocurrency Market Trends: TITN's price trajectory is significantly influenced by broader cryptocurrency market movements, investor sentiment driven by news and social media, and overall market confidence.
- Regulatory Dynamics: Changes in the regulatory environment, including potential ETF approvals and government policy adjustments, impact market accessibility and institutional participation.
- Market Sentiment: Investor confidence, media coverage, and social media discussions play important roles in price determination.
III. 2025-2030 TITN Price Forecast
2025 Outlook
- Conservative Forecast: $0.1285 - $0.1647
- Base Case Forecast: $0.1647 - $0.1779
- Optimistic Forecast: $0.1779 (requiring sustained market momentum and increased adoption)
2026-2027 Mid-term Outlook
- Market Phase Expectations: Recovery and consolidation phase with gradual upward trajectory, characterized by increasing institutional interest and ecosystem development
- Price Range Predictions:
- 2026: $0.0891 - $0.2210
- 2027: $0.1863 - $0.2177
- Key Catalysts: Platform expansion, strategic partnerships, improved market liquidity, and growing user adoption across decentralized applications
2028-2030 Long-term Outlook
- Base Case Scenario: $0.1593 - $0.2856 (assuming steady ecosystem growth and moderate market expansion)
- Optimistic Scenario: $0.2068 - $0.3004 (assuming accelerated adoption rates and positive regulatory developments)
- Bull Case Scenario: $0.2159 - $0.4045 (assuming breakthrough technological innovations and mainstream institutional adoption)
- 2030-12-31: TITN reaching $0.4045, representing a 65% cumulative appreciation from current levels and establishing the asset as a significant component within its market segment
| 年份 | 预测最高价 | 预测平均价格 | 预测最低价 | 涨跌幅 |
|---|---|---|---|---|
| 2025 | 0.17789 | 0.16471 | 0.12847 | 0 |
| 2026 | 0.22097 | 0.1713 | 0.08908 | 4 |
| 2027 | 0.21771 | 0.19614 | 0.18633 | 19 |
| 2028 | 0.28556 | 0.20692 | 0.15933 | 25 |
| 2029 | 0.30041 | 0.24624 | 0.20684 | 49 |
| 2030 | 0.40452 | 0.27333 | 0.21593 | 65 |
THORWallet (TITN) Professional Investment Strategy and Risk Management Report
IV. TITN Professional Investment Strategy and Risk Management
TITN Investment Methodology
(1) Long-term Holding Strategy
-
Target Investors: DeFi enthusiasts, cross-chain users, and long-term cryptocurrency believers who trust THORWallet's infrastructure development
-
Operation Recommendations:
- Accumulate TITN tokens during market dips, leveraging dollar-cost averaging to reduce entry price volatility
- Hold tokens long-term (12+ months) to benefit from potential ecosystem expansion and increased adoption of cross-chain swap features
- Monitor THORWallet's product roadmap updates, particularly the upcoming perpetual trading feature launch
-
Storage Plan:
- For smaller holdings, utilize Gate Web3 Wallet for convenient access to cross-chain features while maintaining security
- For larger holdings, consider cold storage solutions with regular security audits
- Enable multi-signature authentication where available for enhanced asset protection
(2) Active Trading Strategy
-
Technical Analysis Indicators:
- Moving Averages (20-day and 50-day MA): Monitor price trends and identify support/resistance levels at $0.1567 (24h low) and $0.16636 (24h high)
- Relative Strength Index (RSI): Track overbought/oversold conditions, particularly relevant given the 4.35% 24-hour price movement
- Volume Analysis: Utilize the daily volume data ($790,206) to identify breakout opportunities and validate price movements
-
Swing Trading Key Points:
- Capitalize on the significant 7-day performance of +65.36% by identifying consolidation patterns before major moves
- Set clear profit targets at resistance levels ($0.17573 historical high) and stop-losses at psychological support zones
- Consider the limited trading liquidity (single exchange listing) and adjust position sizes accordingly to manage slippage
V. TITN Risk Management Framework
(1) Asset Allocation Principles
- Conservative Investors: 1-2% portfolio allocation - Suitable for those seeking exposure to DeFi wallets with controlled risk exposure
- Active Investors: 3-5% portfolio allocation - Appropriate for investors comfortable with higher volatility but maintaining diversification
- Professional Investors: 5-10% portfolio allocation - For experienced traders with dedicated risk management infrastructure
(2) Risk Hedging Solutions
- Stablecoin Reserves: Maintain 30-50% of allocated capital in stablecoins to capitalize on market downturns and reduce impermanent loss exposure
- Portfolio Diversification: Spread investments across multiple blockchain-based DeFi projects to mitigate single-project concentration risk
- Dollar-Cost Averaging (DCA): Execute systematic purchases over extended periods rather than lump-sum investments to reduce timing risk
(3) Secure Storage Solutions
- Hot Wallet Recommendations: Gate Web3 Wallet provides real-time access to TITN tokens with integrated security features and cross-chain functionality
- Cold Storage Approach: Utilize hardware wallets or paper wallets for the majority of holdings, accessing only necessary amounts through hot wallets for active trading
- Security Precautions:
- Never share private keys or seed phrases with third parties
- Enable two-factor authentication on all exchange and wallet accounts
- Regularly verify contract addresses before transactions to avoid phishing attacks
- Keep software and device firmware updated with latest security patches
VI. TITN Potential Risks and Challenges
TITN Market Risks
- Low Liquidity Risk: With only single exchange listing and relatively modest 24-hour volume of $790,206, TITN faces potential liquidity constraints that could result in significant slippage during large trades
- Market Concentration Risk: Circulating supply of 42.5 million tokens against 1 billion total supply means only 4.25% of tokens are currently circulating, creating potential dilution risk from future token releases
- Price Volatility Risk: Historical performance shows 156.38% 30-day gains and 99.17% 1-year gains, indicating extreme volatility unsuitable for risk-averse investors
TITN Regulatory Risks
- DeFi Regulatory Uncertainty: Evolving global regulations around non-custodial wallets and decentralized finance platforms could impact THORWallet's operations and token utility
- Cross-Chain Compliance Challenges: Operating across multiple blockchain networks creates complex regulatory compliance requirements that vary by jurisdiction
- Token Classification Risk: Regulatory bodies may reclassify TITN tokens, potentially affecting their tradability and utility in certain regions
TITN Technical Risks
- Smart Contract Vulnerabilities: As a DeFi platform, THORWallet faces ongoing risks from undiscovered security flaws or exploits in smart contract code
- Cross-Chain Bridge Risk: The core functionality depends on reliable cross-chain bridges, which remain subject to technical failures and security breaches
- Scalability Challenges: Increased network congestion could impact transaction speeds and economics on the BASE network where TITN operates
VII. Conclusion and Action Recommendations
TITN Investment Value Assessment
THORWallet (TITN) represents an emerging player in the competitive DeFi wallet landscape, characterized by impressive short-term performance metrics (+65.36% over 7 days) and strategic positioning in cross-chain asset management. However, the token exhibits significant risks including concentrated liquidity, early-stage market adoption challenges, and regulatory uncertainty inherent to DeFi protocols. The project's long-term value depends critically on execution of its perpetual trading feature roadmap and sustained growth in cross-chain transaction volume. Investors should view TITN as a speculative, high-risk allocation suitable only for portfolios with substantial risk capacity.
TITN Investment Recommendations
✅ Beginners: Start with minimal allocations (0.5-1% of portfolio) through Gate.com to gain exposure while learning DeFi mechanics. Prioritize security education before custody decisions.
✅ Experienced Investors: Consider 3-5% allocations with systematic DCA strategies during support levels. Utilize technical analysis tools to identify optimal entry/exit points around the $0.1567-$0.16636 range.
✅ Institutional Investors: Conduct thorough due diligence on THORWallet's development roadmap, smart contract audits, and regulatory compliance status. Consider structured positions with dedicated risk management and diversification across multiple DeFi protocols.
TITN Trading Participation Methods
- Spot Trading on Gate.com: Purchase TITN tokens directly during market weakness, utilizing limit orders to achieve better entry prices and reduce slippage impact
- Dollar-Cost Averaging: Execute recurring purchases on a fixed schedule (weekly or monthly) to systematically build positions regardless of short-term price movements
- Technical-Driven Trading: Monitor price action around resistance ($0.17573) and support ($0.1567) levels, executing swing trades when volume confirms directional moves
Cryptocurrency investment carries extreme risk. This report does not constitute investment advice. All investors should make decisions based on individual risk tolerance and should consult professional financial advisors. Never invest more than you can afford to lose.
FAQ
What is the target price of Titan in 2025?
Based on current market analysis, Titan's target price for 2025 is estimated between $14.00 and $20.00, with an average forecast showing modest growth from present levels.
Is it good to invest in Titan?
Yes, Titan demonstrates strong market fundamentals with solid trading volume and consistent performance. The project shows promising growth potential, making it an attractive investment opportunity for those seeking exposure to the Web3 sector.
What is the prediction for Titan stock?
Analysts predict Titan stock will reach 4,266.62 INR by 2026, with estimates ranging from 3,450.00 to 4,700.00 INR based on current market analysis and technical indicators.
Is Titan overvalued?
Titan shows premium valuation metrics, but its strong fundamentals and growth prospects justify current pricing. Long-term investors view it as fairly valued for sustained expansion in the crypto ecosystem.
Share
Content
Introduction: TITN's Market Position and Investment Value
I. TITN Price History Review and Current Market Status
II. Core Factors Affecting TITN's Future Price
III. 2025-2030 TITN Price Forecast
IV. TITN Professional Investment Strategy and Risk Management
V. TITN Risk Management Framework
VI. TITN Potential Risks and Challenges
VII. Conclusion and Action Recommendations
FAQ
How to Buy Cryptocurrency


Trending Cryptocurrencies


2025 VXT Price Prediction: Analyzing Market Trends and Potential Growth Factors

2025 KZEN Price Prediction: Analyzing Market Trends and Potential Growth for the Emerging Cryptocurrency

Is Boson (BOSON) a good investment? A Comprehensive Analysis of the Protocol's Potential and Market Performance
2025 PHTR Price Prediction: Can Palantir Technologies Reach $50 Per Share by Year-End?

Sei Network 2025 Development Status and Investment Opportunity Analysis

Analysis of the Development Status and Investment Opportunities of the SEI Ecosystem in 2025

Crypto RSI Heatmap

Ethereum Maintains 62% NFT Market Share Despite Growing Competition
CryptoQuant On-Chain Analysis Tools: Bitcoin Market Insights and Whale Tracking for Crypto Traders in 2026

Mist Browser (Ethereum DApp Browser)

Moo Deng (MOODENG) — The Viral Hippo Taking Over Crypto