2025 GME Price Prediction: Will GameStop Stock Reach New Heights or Face Further Decline?

Introduction: GME's Market Position and Investment Value
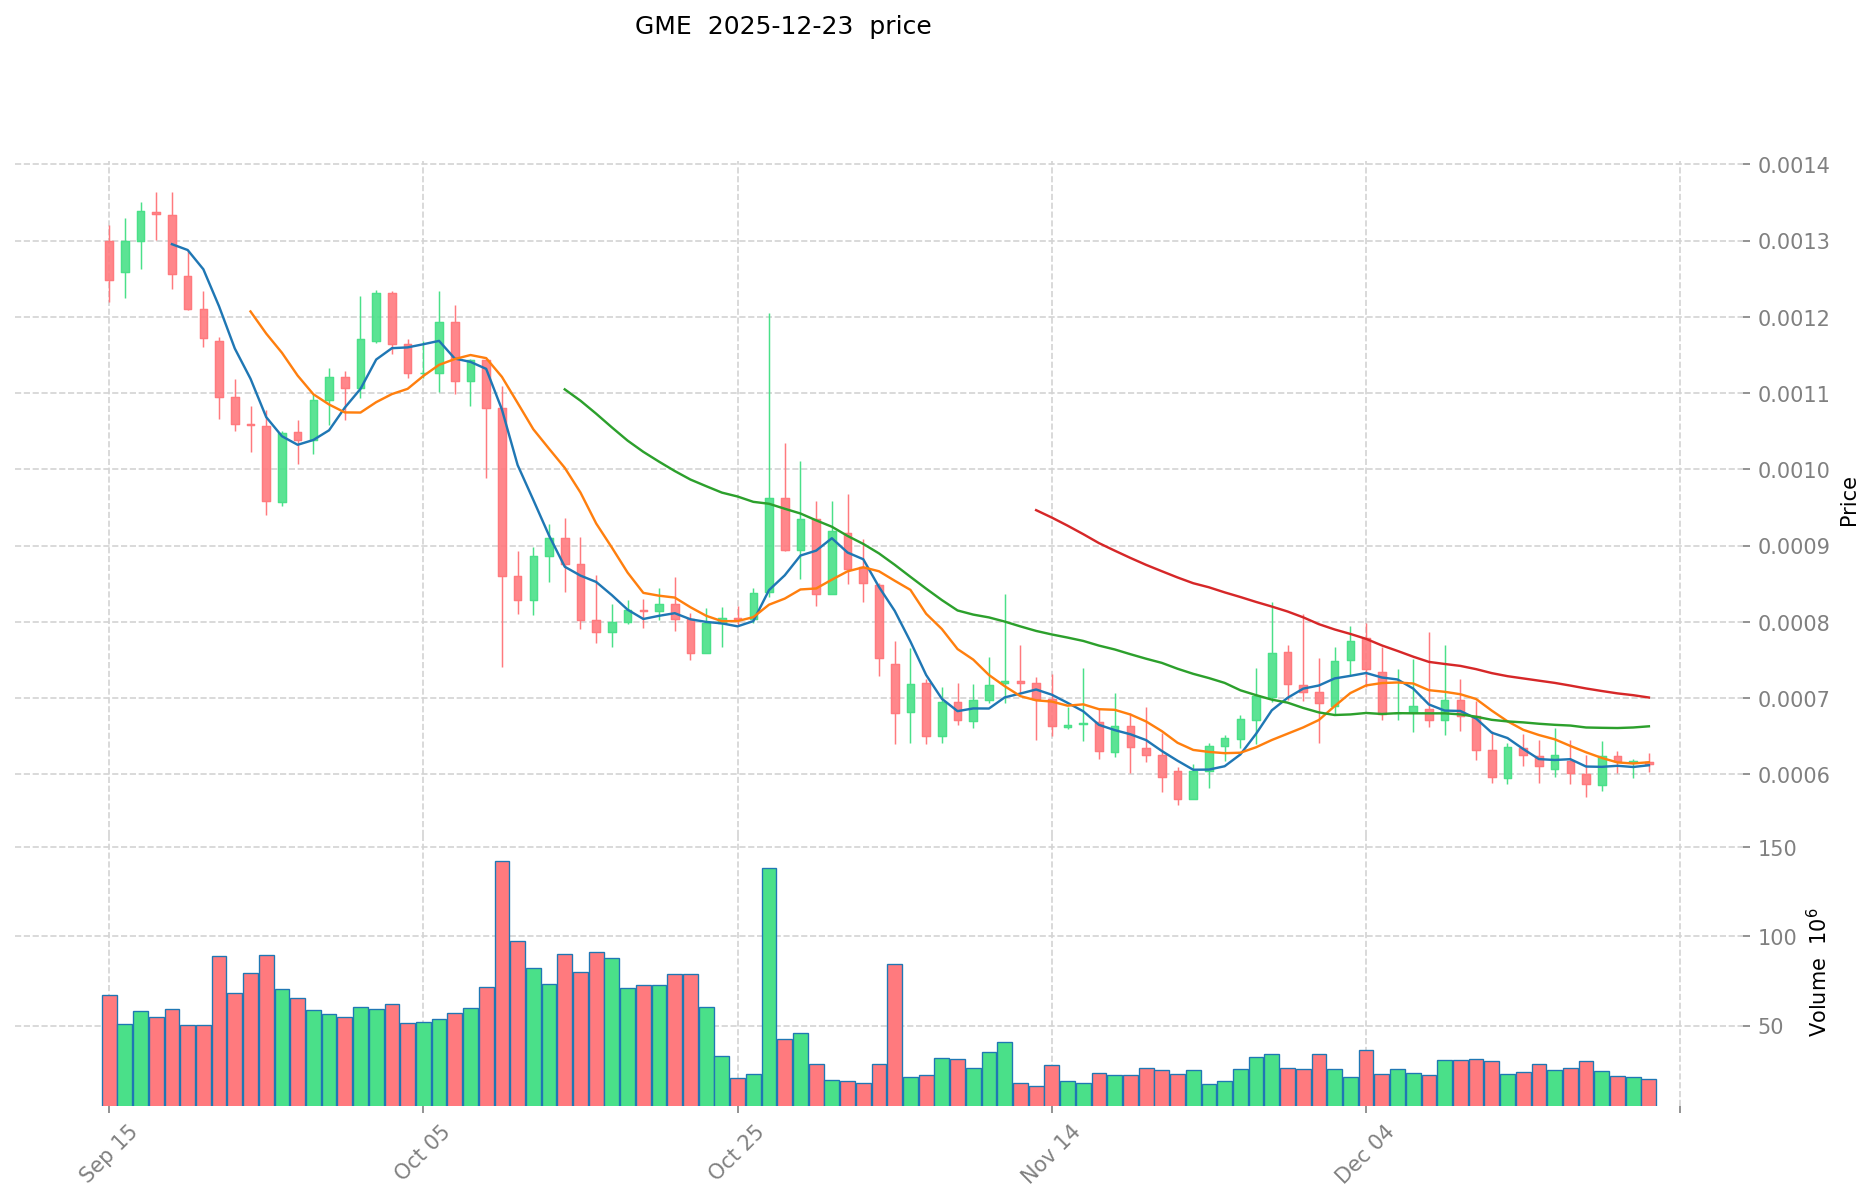
GME (GME), a community coin on the Solana network that parodies GameStop, has been gaining attention in the crypto market since its launch in January 2024. As of December 2025, GME has achieved a market capitalization of approximately $4.15 million with a circulating supply of approximately 6.89 billion tokens, maintaining a price around $0.0006. This emerging asset continues to demonstrate its presence within the Solana ecosystem.
This article will comprehensively analyze GME's price trends through 2030, combining historical patterns, market supply and demand dynamics, and ecosystem developments to provide investors with professional price forecasts and practical investment strategies.
GME (GameStop) Market Analysis Report
I. GME Price History Review and Current Market Status
GME Historical Price Evolution
GME is a community token on the Solana (SOL) network that mimics GameStop. Since its launch on January 27, 2025, the token has experienced significant price volatility:
- All-Time High (ATH): $0.03248, reached on June 7, 2024
- All-Time Low (ATL): $0.0005591, reached on November 22, 2025
- Year-to-Date Performance: -84.27% decline from the peak, demonstrating substantial long-term downward pressure
GME Current Market Status
As of December 24, 2025, GME is trading at $0.0006033, reflecting recent market dynamics:
Price Performance Metrics:
- 24-Hour Change: -1.08% ($0.0006033 current price)
- 7-Day Change: -3.11%
- 30-Day Change: -1.42%
- 1-Hour Change: +0.030% (minor short-term recovery)
- 24-Hour Trading Range: $0.0005914 (low) to $0.0006165 (high)
Market Capitalization & Supply:
- Market Cap: $4,153,803.45 USD
- Fully Diluted Valuation (FDV): $4,153,848.10 USD
- Market Cap to FDV Ratio: 100% (indicating full dilution)
- Circulating Supply: 6,885,137,498.71 GME tokens (99.9989% of total supply)
- Total Supply: 6,885,211,501 GME tokens
- Market Dominance: 0.00013%
Trading & Liquidity:
- 24-Hour Trading Volume: $12,250.09 USD
- Number of Exchanges: 12
- Total Holders: 46,498
Market Sentiment:
- Current market sentiment reflects extreme fear (VIX at 24), indicating bearish market conditions
Click to view current GME market price
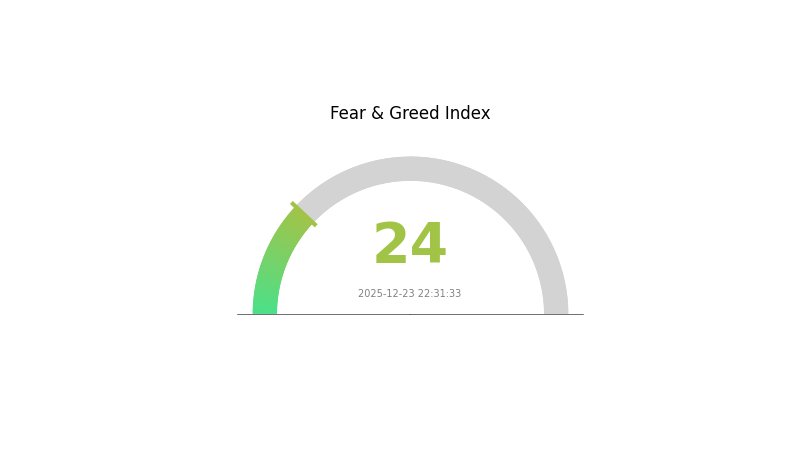
GME Market Sentiment Index
2025-12-23 Fear and Greed Index: 24 (Extreme Fear)
Click to view the current Fear & Greed Index
The Fear and Greed Index has dropped to 24, signaling extreme fear in the GME market. This significant decline reflects heightened investor anxiety and pessimistic market sentiment. When the index reaches such low levels, it typically indicates that assets may be oversold, potentially creating opportunities for contrarian investors. However, extreme fear also suggests heightened volatility and risk. Investors should exercise caution, conduct thorough research, and consider their risk tolerance before making investment decisions during periods of extreme market fear.
GME Holding Distribution
The address holding distribution chart illustrates how GME tokens are allocated across different blockchain addresses, serving as a critical metric for assessing token concentration and market structure. By analyzing the top holders and their proportional stakes, this distribution provides insights into the degree of decentralization, potential risks of market manipulation, and the overall health of the token's ecosystem.
Current data reveals a moderately concentrated holding pattern. The top five addresses collectively control approximately 29.68% of total GME supply, with the largest holder accounting for 16.59%. While this concentration level is not uncommon in emerging tokenomic structures, it does warrant attention. The second-largest holder maintains a significantly smaller position at 5.44%, suggesting a gradual decline in holdings rather than extreme dominance by a single entity. Notably, the remaining addresses account for 70.32% of the token supply, indicating that the majority of GME distribution is dispersed across a broader holder base.
This distribution pattern presents a balanced risk profile. The concentration among top five addresses suggests potential liquidity provision and market-making capabilities, which can enhance trading efficiency. However, the substantial portion held by dispersed addresses mitigates excessive centralization risks. The current structure demonstrates reasonable decentralization without severe fragmentation, supporting relatively stable market dynamics. This holding distribution reflects a healthy tokenomic foundation, though continuous monitoring of top holder movements remains essential for detecting potential liquidity events or market interventions that could influence price stability.
Click to view current GME Holding Distribution

| Top | Address | Holding Qty | Holding (%) |
|---|---|---|---|
| 1 | 5Q544f...pge4j1 | 1142187.87K | 16.59% |
| 2 | u6PJ8D...ynXq2w | 374385.14K | 5.44% |
| 3 | ASTyfS...g7iaJZ | 230785.57K | 3.35% |
| 4 | 4gXs8o...Dat8tH | 161029.30K | 2.34% |
| 5 | 5PAhQi...cnPRj5 | 134875.62K | 1.96% |
| - | Others | 4837750.31K | 70.32% |
II. Core Factors Influencing GME's Future Price
Institutional and Retail Investor Dynamics
-
Retail Investor Concentration: GameStop has become a symbol of retail investor coordination, particularly through the r/WallStreetBets community on Reddit. Retail traders have demonstrated the ability to drive significant price movements through concentrated buying, especially in call options with short expiration dates and out-of-the-money strikes.
-
Short Squeeze Mechanics: Historically, GME experienced an extreme short squeeze in January 2021 when short positions exceeded 100% of float. This triggered cascading effects: as retail investors accumulated call options, market makers (options sellers) were forced to hedge their short Gamma exposure by continuously purchasing shares, amplifying the rally. In extreme trading sessions, certain near-term call options saw daily volumes exceeding 100,000 contracts, with option costs rising from single-digit percentages to tens of percentage points relative to underlying share price.
-
Influencer Impact: Keith Gill (known as u/DeepFuckingValue on Reddit and Roaring Kitty on YouTube) has played a pivotal role since 2019 in maintaining narrative around GME. Whenever he makes public statements or positions updates, options and spot trading volumes often experience disproportionate spikes, with stock price movements decoupling from fundamental logic.
Market Sentiment and Valuation Dynamics
-
Dual Valuation Components: GME's current price reflects two distinct layers. The first component is fundamental: with trailing twelve-month (TTM) earnings per share of $0.76 and a price-to-earnings ratio oscillating between 20-30x (significantly higher than traditional brick-and-mortar retailers), the market has assigned a clear transformation premium for the collectibles-driven business model, inventory optimization, and sustained profitability. The second component is speculative: a residual "meme premium" that reflects social media sentiment, options positioning, and expectation of further volatility events.
-
Social Media Correlation: Stock price volatility demonstrates strong correlation with discussion volume on r/WallStreetBets, specialized GME forums, and X (formerly Twitter). In 2025, instances of 30-50% intra-week moves by GME and similar meme stocks have become commonplace, driven primarily by sentiment shifts, position structure changes, and expectation revisions rather than material changes in revenue or profitability.
-
Information Noise: The majority of GME market discussion originates from social platforms including r/WallStreetBets, X, and TikTok. While some reflects genuine market dynamics and trading flows, substantial portions consist of emotional expression, memes, and fragmented information. During bullish or euphoric periods, social sentiment tends to overwhelm rational analysis, causing investors to chase FOMO while neglecting fundamental risks and position management.
Business Model Transformation
-
Revenue Structure Shift: GameStop is transitioning from a traditional physical game retailer to a collectibles-and-niche-culture focused hub. The collectibles segment demonstrates high growth, offsetting structural decline in physical game software sales. Recent quarterly results show improved profitability driven by hardware sales recovery, collectibles margin expansion, and cost controls, though some profit increases derive from non-recurring items including digital asset fair value adjustments.
-
Cryptocurrency Asset Allocation: The company has allocated portions of its cash reserves to Bitcoin holdings. This creates additional complexity: GME's stock price volatility now partially correlates with cryptocurrency market movements. Days when Bitcoin experiences sharp corrections often coincide with notable GME declines, adding a new dimension of market risk beyond traditional equity or retail sentiment factors.
Price Volatility Characteristics
-
Extreme Intra-Period Fluctuations: GME commonly exhibits double-digit daily percentage moves during earnings windows and sentiment-driven events. In extreme circumstances, multi-day price swings can reach several dozen percentage points, necessitating rigorous position sizing and strict loss-limiting protocols for participants.
-
Decoupling from Fundamentals: During peak meme cycles, price movements frequently bear no relationship to quantifiable business metric changes. The coordination of retail traders, options market mechanics (Gamma squeezes), short-covering cascades, and social momentum can overwhelm any single fundamental development.
Three、2025-2030 Year GME Price Forecast
2025 Outlook
- Conservative Prediction: $0.00058-$0.00076
- Neutral Prediction: $0.0006 (average)
- Bullish Prediction: $0.00076 (maintaining current support levels)
2026-2028 Mid-term Outlook
- Market Phase Expectation: Gradual recovery and consolidation phase with steady upward momentum, characterized by incremental price appreciation and market stabilization.
- Price Range Forecast:
- 2026: $0.00051-$0.00087 (13% upside potential)
- 2027: $0.00069-$0.0009 (29% upside potential)
- 2028: $0.00074-$0.00093 (39% upside potential)
- Key Catalysts: Improved market sentiment, institutional adoption expansion, ecosystem development maturation, and increased trading volume on platforms like Gate.com.
2029-2030 Long-term Outlook
- Base Case: $0.00064-$0.00111 by 2029 (47% appreciation potential, assuming sustained market recovery and moderate institutional interest)
- Bullish Case: $0.00095-$0.00141 by 2030 (65% appreciation potential, assuming accelerated adoption and broader market recovery cycles)
- Transformational Case: $0.00141+ by 2030 (assuming breakthrough technological developments, significant mainstream adoption, and favorable regulatory environment shifts)
Note: All price forecasts are based on historical volatility patterns and market cycle analysis. Actual price movements may vary significantly based on macroeconomic conditions, regulatory changes, and broader cryptocurrency market sentiment.
| 年份 | 预测最高价 | 预测平均价格 | 预测最低价 | 涨跌幅 |
|---|---|---|---|---|
| 2025 | 0.00076 | 0.0006 | 0.00058 | 0 |
| 2026 | 0.00087 | 0.00068 | 0.00051 | 13 |
| 2027 | 0.0009 | 0.00078 | 0.00069 | 29 |
| 2028 | 0.00093 | 0.00084 | 0.00074 | 39 |
| 2029 | 0.00111 | 0.00089 | 0.00064 | 47 |
| 2030 | 0.00141 | 0.001 | 0.00095 | 65 |
GME Investment Strategy and Risk Management Report
IV. GME Professional Investment Strategy and Risk Management
GME Investment Methodology
(1) Long-Term Holding Strategy
- Target Investors: Community-oriented participants and speculative traders interested in Solana-based meme tokens
- Operational Recommendations:
- Accumulate during price dips, particularly when GME trades near its all-time low of $0.0005591
- Set clear profit-taking targets based on historical resistance levels (previous ATH: $0.03248)
- Maintain a diversified portfolio allocation to manage concentration risk in community tokens
(2) Active Trading Strategy
-
Market Sentiment Indicators:
- Current market emotion score: 1 (neutral/bearish)
- Monitor 24-hour volume trends ($12,250 daily average) for liquidity conditions
- Track 7-day (-3.11%) and 30-day (-1.42%) performance against hourly movements (+0.030%)
-
Range Trading Considerations:
- Identify support levels near recent lows ($0.0005914 - 24h low)
- Resistance zones near 24-hour highs ($0.0006165)
- Monitor volatility patterns given the -84.27% year-over-year decline
GME Risk Management Framework
(1) Portfolio Allocation Principles
- Conservative Investors: 0.5-1% of total crypto portfolio allocation
- Active Traders: 1-3% for tactical position building
- Speculative Participants: 2-5% with strict stop-loss discipline
(2) Risk Hedging Strategies
- Position Sizing: Limit individual trades to no more than 1% of total trading capital
- Stop-Loss Implementation: Set automated stops at 15-20% below entry points to protect against sudden liquidation events
(3) Secure Storage Solutions
- Wallet Management: Use Gate.com's Web3 wallet for convenient trading and secure token storage
- Self-Custody Protocol: For long-term holdings beyond active trading, transfer tokens to secure self-custody solutions with proper backup procedures
- Security Precautions: Never share private keys, enable two-factor authentication on all exchange accounts, and maintain offline backup of critical access information
V. GME Potential Risks and Challenges
GME Market Risks
- Extreme Volatility: The token has experienced -84.27% losses over one year, indicating significant price instability unsuitable for risk-averse investors
- Liquidity Concerns: Daily trading volume of $12,250 suggests limited liquidity, which could result in significant slippage on larger trades
- Community Token Dependency: As a parody/community coin on Solana, GME lacks fundamental utility or cash flow backing, relying entirely on speculative interest and community sentiment
GME Regulatory Risks
- Meme Token Classification: Community coins face increasing regulatory scrutiny, with potential classification as securities in certain jurisdictions
- Platform Compliance: Continued availability on exchanges depends on regulatory approval and compliance standards
- Market Manipulation Concerns: Community tokens are susceptible to pump-and-dump schemes and coordinated trading activity
GME Technical Risks
- Solana Network Dependency: Token performance is tied to Solana blockchain stability and network congestion
- Smart Contract Vulnerabilities: Any undiscovered vulnerabilities in the token's smart contract could result in total loss of value
- Exchange Listing Risk: Delisting from trading platforms could dramatically reduce liquidity and create illiquidity traps for holders
VI. Conclusion and Action Recommendations
GME Investment Value Assessment
GME represents a speculative community token with extreme volatility and limited fundamental value proposition. The -84.27% year-over-year decline and current market emotion score of 1 (neutral/bearish) suggest cautious sentiment. This token is primarily suited for experienced traders comfortable with high-risk, high-volatility assets rather than long-term wealth preservation. Its $4.15 million market cap reflects minimal institutional interest and suggests it remains a retail-driven speculative asset.
GME Investment Recommendations
✅ Beginners: Avoid direct exposure; if interested in community tokens, start with only 0.1-0.5% portfolio allocation and treat as educational speculation rather than core investment
✅ Experienced Traders: Consider tactical range-trading strategies between identified support ($0.0005591) and resistance levels ($0.03248), utilizing strict 15-20% stop-losses and position sizing discipline
✅ Institutional Investors: Generally unsuitable due to minimal liquidity, speculative nature, and regulatory uncertainties surrounding meme token classification
GME Trading Participation Methods
- Direct Trading on Gate.com: Access GME trading pairs with competitive fees and advanced trading tools
- Community Engagement: Monitor official channels (website: gmestop.co, Twitter: @gmecoinsol) for updates and community sentiment
- Risk Management Protocols: Implement automated order execution with predetermined stop-loss and take-profit levels before entering any position
Cryptocurrency investment carries extreme risk. This report does not constitute investment advice. Investors should make decisions based on their individual risk tolerance and financial situation. Consult with professional financial advisors before making investment decisions. Never invest more than you can afford to lose completely.
FAQ
Can GME reach $1000?
Yes, GME has potential to reach $1000. With strong community support, retail investor momentum, and possible strategic company pivots, a $1000 target remains achievable within favorable market conditions.
What is the AI prediction for GME stock?
AI models project GME stock to reach $22.91 in 2026 and $18.59 in 2030, based on current market data extrapolation and alternative data analysis with an AI stability score of 43.
How high can GME go in 2025?
Based on current forecasts, GME could potentially reach a high of $316.82 in 2025. This represents significant upside potential for investors tracking this volatile asset through 2025.
Is GameStop a buy hold or sell?
GameStop stock currently carries a consensus rating of sell. Analysts generally recommend against buying at present levels, given weak fundamentals and declining retail investor interest in the stock.
Share
Content
Introduction: GME's Market Position and Investment Value
I. GME Price History Review and Current Market Status
II. Core Factors Influencing GME's Future Price
Three、2025-2030 Year GME Price Forecast
IV. GME Professional Investment Strategy and Risk Management
V. GME Potential Risks and Challenges
VI. Conclusion and Action Recommendations
FAQ
How to Buy Cryptocurrency


Trending Cryptocurrencies


2025 MOODENG Price Prediction: Analyzing Market Trends and Potential Growth Factors for the Emerging Cryptocurrency

Is BOOK OF MEME (BOME) a good investment?: A Comprehensive Analysis of Risk, Potential Returns, and Market Viability for 2024

Expert Insights on BONK Coin Investment Strategies

Is Slerf (SLERF) a good investment?: A Comprehensive Analysis of Risk, Potential Returns, and Market Viability

Is Pain (PAIN) a good investment?: A Comprehensive Analysis of Market Potential, Risks, and Future Prospects

Is just buy $1 worth of this coin (1DOLLAR) a good investment?: A Comprehensive Analysis of Micro-Investment Potential and Risk Factors in Penny Cryptocurrencies
Crypto RSI Heatmap

Ethereum Maintains 62% NFT Market Share Despite Growing Competition
CryptoQuant On-Chain Analysis Tools: Bitcoin Market Insights and Whale Tracking for Crypto Traders in 2026

Mist Browser (Ethereum DApp Browser)

Moo Deng (MOODENG) — The Viral Hippo Taking Over Crypto