| Che cos'è TradingView?
· TradingView è uno strumento di analisi tecnica completo e potente che include funzionalità come grafici a candele che mostrano l’andamento dei prezzi, grafici di profondità, indicatori tecnici, strumenti di disegno e diversi intervalli temporali.
· Gate offre agli utenti tre tipi di grafici: il grafico Professionale, il grafico Semplice e il grafico di Profondità. I grafici a candele Professionale e Semplice forniscono una panoramica delle tendenze di mercato, mentre il grafico di Profondità mostra il volume degli ordini di acquisto e vendita presenti nel book ordini. Il grafico Professionale offre inoltre funzionalità aggiuntive, come strumenti di disegno e indicatori tecnici, per supportare l’analisi, e consente anche di personalizzare l’intervallo temporale. Anche il grafico Semplice permette la personalizzazione dell’intervallo temporale.
| Il Grafico Professionale
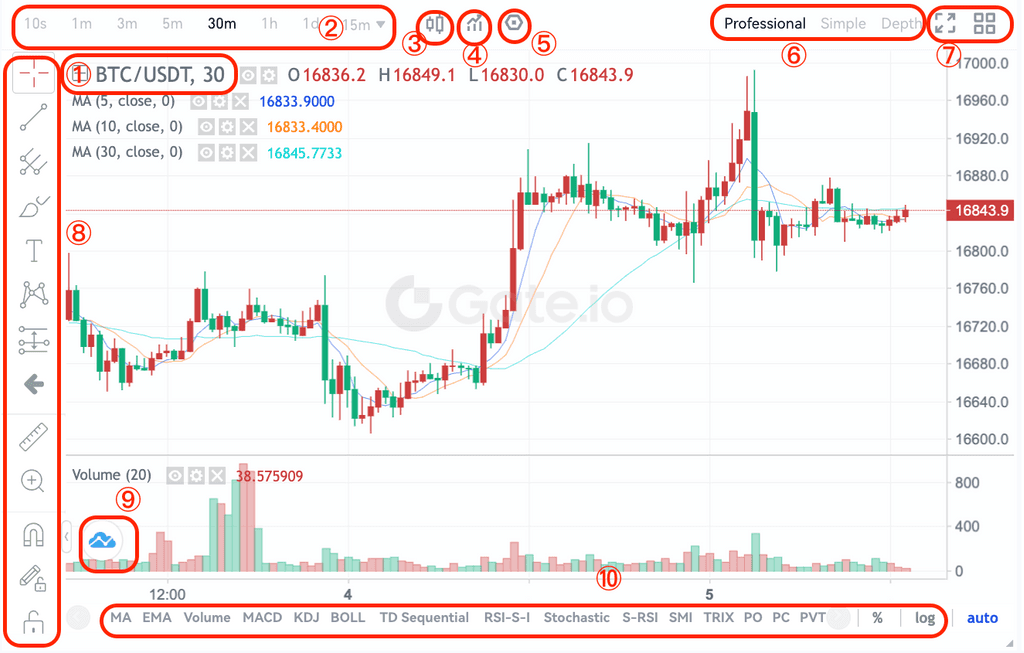
(1)- Coppia di trading
(2)- Intervallo temporale
· Puoi selezionare l’intervallo temporale necessario per analizzare l’andamento dei prezzi in un determinato periodo.
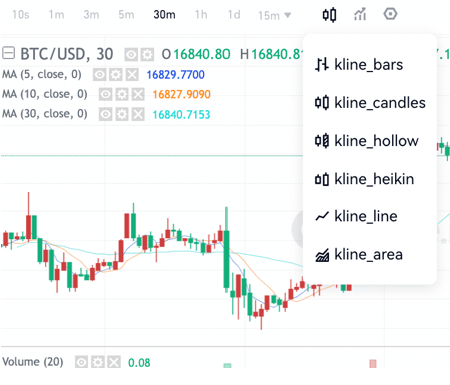
(3)- Opzioni di diversi tipi di grafici a candele
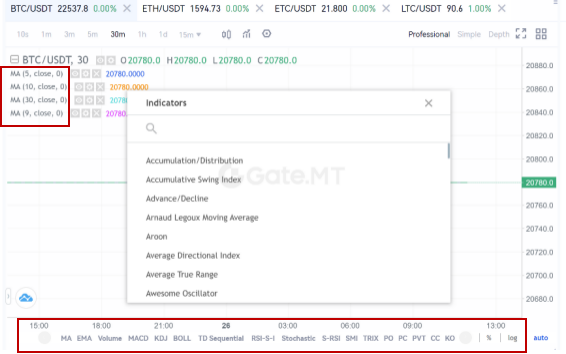
(4)- Indicatori tecnici
· Clicca sul pulsante per visualizzare un elenco di indicatori tecnici. Seleziona quello di cui hai bisogno e verrà mostrato sul grafico. Puoi anche cliccare in basso al grafico per selezionare.
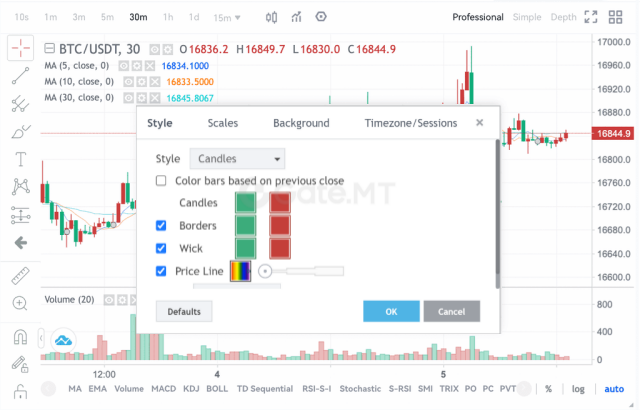
(5)- Impostazioni del grafico
· Puoi personalizzare lo stile, le scale, lo sfondo e il fuso orario/sedute del grafico a candele.
(6)- Scegli tra il Grafico Professionale, il Grafico Semplice e il Grafico di Profondità in base alle tue esigenze.
(7)- Clicca sull’icona a sinistra per abilitare la visualizzazione a schermo intero del grafico a candele. Clicca sull’icona a destra per scegliere tra la modalità a 1 grafico e quella a 4 grafici.
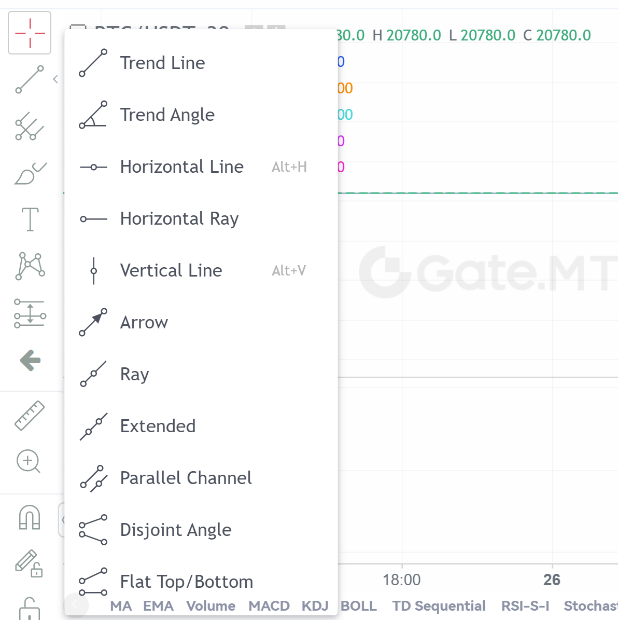
(8)- Strumenti di disegno
(9)- Clicca qui per accedere al sito ufficiale di TradingView
(10)- Indicatori tecnici nella parte inferiore del grafico
| Che cos'è il grafico a candele?
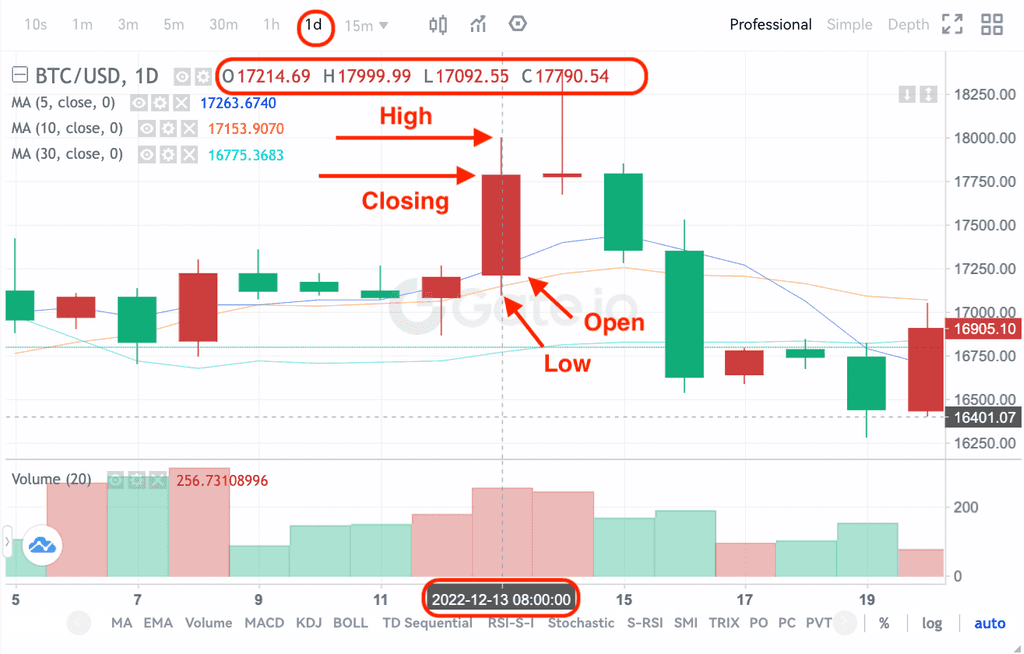
· Un grafico a candele è un tipo di grafico dei prezzi utilizzato nell’analisi tecnica che mostra i prezzi massimi, minimi, di apertura e di chiusura di uno strumento finanziario per un determinato periodo. È ampiamente utilizzato nell’analisi tecnica di azioni, futures, metalli preziosi, criptovalute, ecc.
· I prezzi massimo, minimo, di apertura e di chiusura sono i quattro dati chiave di un grafico a candele che mostrano l’andamento complessivo del prezzo. In base ai diversi intervalli temporali, esistono grafici a candele di un minuto, un’ora, un giorno, una settimana, un mese, un anno e così via.
· Quando il prezzo di chiusura è superiore al prezzo di apertura, la candela sarà rossa/bianca (supponendo rosso per rialzo e verde per ribasso, che può variare in base alle diverse consuetudini), suggerendo che il prezzo è rialzista; mentre la candela sarà verde/nera quando il confronto dei prezzi è opposto, indicando un prezzo ribassista.
· Prendiamo come esempio il grafico a candele giornaliero del 31-12-2022, in cui il rosso rappresenta il rialzo e il verde il ribasso. I prezzi massimo, minimo, di apertura e di chiusura sono indicati nell’immagine qui sotto. Inoltre, i quattro prezzi specifici sono anche elencati sulla destra della coppia di trading.
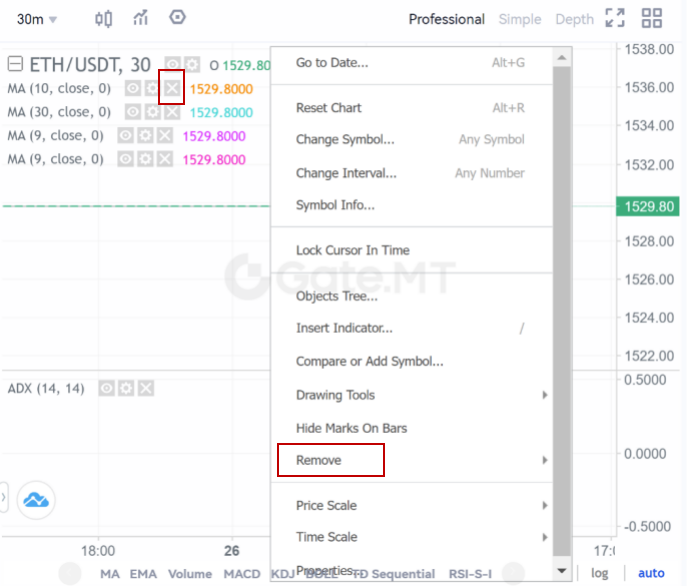
| Come rimuovere gli indicatori tecnici e come resettare?
· Se desideri rimuovere gli indicatori tecnici visualizzati sul grafico, puoi fare clic con il tasto destro sul grafico e selezionare “rimuovi” per eliminare tutti gli indicatori o gli strumenti di disegno. In alternativa, puoi semplicemente cliccare sull’icona “rimuovi”. Puoi anche resettare il grafico cliccando su “Reset Chart”.