Is Koma Inu (KOMA) a good investment?: Analyzing the potential risks and rewards of this emerging meme coin in the crypto market

Introduction: Investment Position and Market Prospects of Koma Inu (KOMA)
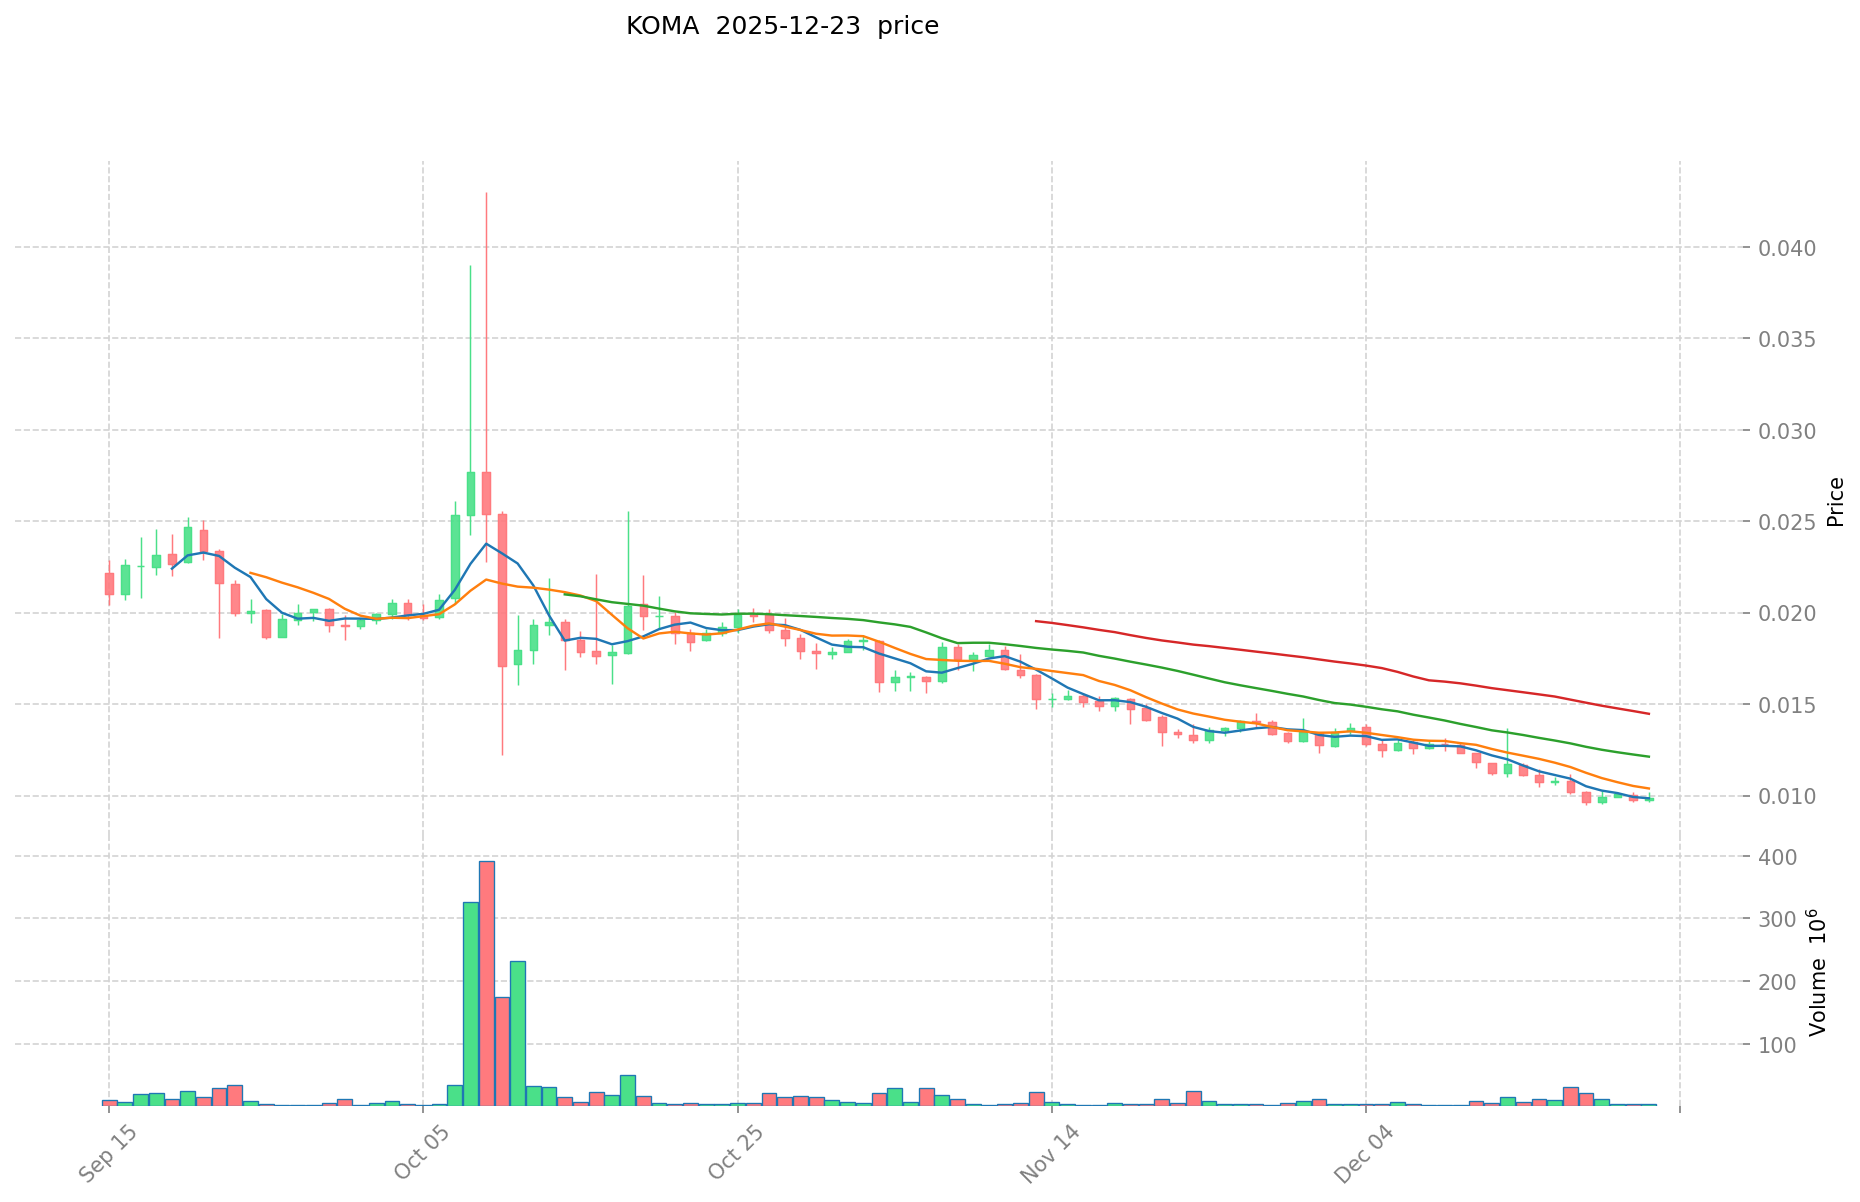
Koma Inu (KOMA) is a dog-themed token built on the BNB Smart Chain (BSC) with a focus on community-driven decentralization and charitable initiatives. As of December 23, 2025, KOMA has achieved a market capitalization of $6,025,610.09 with a circulating supply of approximately 605,954,353 tokens. The token is currently trading at $0.009944, reflecting significant volatility since its inception. With its distinctive positioning as "son of Shib and protector of BNB," KOMA has gradually become a focal point in discussions about meme coin investments and community-driven cryptocurrency projects. This article provides a comprehensive analysis of KOMA's investment value, historical price trends, future price forecasts, and associated investment risks to serve as a reference for investors evaluating the question: "Is Koma Inu (KOMA) a good investment?"
Koma Inu (KOMA) Research Report
I. Koma Inu (KOMA) Historical Price Review and Current Investment Value
Historical Price Performance and Investment Returns
All-Time High (ATH):
- ATH Price: $0.20185
- ATH Date: December 25, 2024
- Current Price vs. ATH: Down 90.74% from peak
All-Time Low (ATL):
- ATL Price: $0.00946
- ATL Date: December 18, 2025
Current Market Status (December 23, 2025)
Key Price Metrics:
- Current Price: $0.009944
- 24-hour Change: +1.77%
- 7-day Change: -6.45%
- 30-day Change: -25.50%
- 1-year Change: -92.30%
Market Capitalization & Valuation:
- Market Cap: $6,025,610.09
- Fully Diluted Valuation (FDV): $9,944,000.00
- Market Cap/FDV Ratio: 60.60%
- Market Dominance: 0.00030%
Trading Activity:
- 24-hour Trading Volume: $42,007.13
- 24-hour High: $0.01021
- 24-hour Low: $0.009664
- Trading Exchanges: 12
Supply Metrics:
- Circulating Supply: 605,954,353.43 tokens
- Total Supply: 1,000,000,000 tokens
- Max Supply: 1,000,000,000 tokens
- Circulation Ratio: 60.59%
Community Metrics:
- Token Holders: 45,530
Market Sentiment:
- Market Emotion Index: 1 (indicating neutral to negative sentiment)
For real-time KOMA market prices and updates, visit Gate KOMA Price
II. Project Overview
Token Name: Koma Inu (KOMA)
Blockchain: BNB Smart Chain (BSC) - BEP-20 standard
Project Description: Koma is positioned as the son of Shib and protector of BNB. It is a dog-themed token built around community-driven decentralization and charitable objectives.
Official Channels:
- Website: https://komabnb.com
- Twitter/X: https://x.com/komabnb
- Smart Contract: 0xd5eaaac47bd1993d661bc087e15dfb079a7f3c19 (BSC)
- Contract Explorer: https://bscscan.com/token/0xd5eaaac47bd1993d661bc087e15dfb079a7f3c19
III. Token Economics
Launch & Initial Pricing:
- Publication Date: October 8, 2024
- Launch Price: $0.001
- Price Appreciation from Launch: +894.4% (to ATH of $0.20185)
Current Valuation Assessment:
- Current Price vs. Launch Price: -893.56% (significant decline from ATH)
- Token Ranking (by market cap): #1433
Disclaimer: This report is compiled from available market data as of December 23, 2025. Past performance does not guarantee future results. Token valuations are subject to high volatility and significant risk. This analysis is for informational purposes only and does not constitute investment advice.
Koma Inu (KOMA) Investment Analysis Report
Report Date: December 23, 2025
Token: Koma Inu (KOMA)
Current Price: $0.009944
Market Cap: $6,025,610.09
I. Executive Summary
Koma Inu is a dog-themed token built on the Binance Smart Chain (BSC) with a focus on community-driven decentralization and charity initiatives. As of December 23, 2025, KOMA ranks #1433 in market capitalization with a circulating supply of 605.95 million tokens out of a maximum supply of 1 billion tokens. The token has experienced significant price volatility, trading 60.8% below its all-time high of $0.20185 (reached on December 25, 2024) and showing a year-to-date decline of -92.30%.
II. Core Factors Affecting KOMA Investment Viability
Supply Mechanism and Token Economics
The token operates with the following supply structure:
- Total Supply: 1,000,000,000 KOMA
- Circulating Supply: 605,954,353.43 KOMA (60.60% of total supply)
- Circulation Ratio: 60.59%
- Fully Diluted Valuation: $9,944,000.00
The relatively concentrated circulating supply percentage indicates that significant token inflation may occur as additional tokens enter circulation, potentially exerting downward pressure on price appreciation.
Market Liquidity and Trading Activity
- 24-Hour Volume: $42,007.13
- Number of Exchanges: 12 trading venues
- Active Holders: 45,530 addresses
- Market Dominance: 0.00030%
The token demonstrates modest trading liquidity with daily volume representing approximately 0.70% of market capitalization. The presence on 12 exchanges provides reasonable accessibility, though the relatively low volume-to-market-cap ratio suggests limited institutional interest and potential liquidity constraints during significant price movements.
Price Performance and Technical Indicators
Recent Price Movement:
- 1-Hour Change: +0.44%
- 24-Hour Change: +1.77%
- 7-Day Change: -6.45%
- 30-Day Change: -25.50%
- 1-Year Change: -92.30%
Key Price Levels:
- All-Time High: $0.20185 (December 25, 2024)
- All-Time Low: $0.00946 (December 18, 2025)
- 24-Hour High: $0.01021
- 24-Hour Low: $0.009664
The token has declined substantially from its recent all-time high, exhibiting significant downward pressure over medium to long-term periods. The recent all-time low within the current month suggests continued volatility and selling pressure.
III. Investment Outlook Assessment
Market Sentiment Analysis
Technical analysis from multiple sources indicates mixed to bearish sentiment regarding KOMA's investment prospects:
- Bearish Forecasts: Multiple quantitative technical indicators suggest a bearish outlook for 2025, with some analysts citing the token's trading 50.8% below its 200-day simple moving average as a bearish signal
- Technical Signals: A 7-day Relative Strength Index (RSI) of 21.5 indicates oversold conditions, which may suggest either a potential rebound or continued weakness depending on fundamental support
Risk Factors for Investors
-
Extreme Volatility: The 92.30% decline over one year demonstrates significant price instability unsuitable for risk-averse investors
-
Limited Fundamental Information: The project description emphasizes community and charity aspects rather than technical innovation or distinct use cases that differentiate it from other dog-themed tokens
-
Modest Market Capitalization: At approximately $6 million in market capitalization, KOMA remains a micro-cap asset with limited institutional adoption and market liquidity
-
High Token Dilution Risk: With only 60.60% of tokens currently circulating, the potential entry of additional tokens into circulation could exert downward price pressure
IV. Project Overview
Token Name: Koma Inu (KOMA)
Blockchain Network: Binance Smart Chain (BEP-20)
Contract Address: 0xd5eaaac47bd1993d661bc087e15dfb079a7f3c19
Launch Date: October 8, 2024
Initial Price: $0.001
Project Description: Koma is positioned as "the son of Shib and protector of BNB," describing itself as a dog-themed token built around community-driven decentralization and charitable initiatives.
Official Channels:
- Website: https://komabnb.com
- Twitter/X: https://x.com/komabnb
- BSC Explorer: https://bscscan.com/token/0xd5eaaac47bd1993d661bc087e15dfb079a7f3c19
V. Conclusion
Koma Inu represents a speculative micro-cap cryptocurrency with significant price volatility and limited fundamental differentiation within the crowded dog-themed token category. While the token maintains operational status on multiple exchanges and possesses an active holder base, the substantial year-to-date decline, modest trading liquidity, and lack of distinctive technological or ecosystem developments present considerable investment risks.
The divergent price predictions from various analysts reflect the speculative nature and uncertainty surrounding KOMA's future value trajectory. Potential investors should carefully consider their risk tolerance and investment objectives before allocating capital to this asset class.
III. KOMA Future Investment Forecast and Price Outlook (Is Koma Inu(KOMA) worth investing in 2025-2030)
Short-term Investment Forecast (2025, short-term KOMA investment outlook)
- Conservative forecast: $0.0079 - $0.009875
- Neutral forecast: $0.009875 - $0.01106
- Optimistic forecast: $0.01106 - $0.01392
Mid-term Investment Outlook (2026-2028, mid-term Koma Inu(KOMA) investment forecast)
- Market phase expectations: The token is projected to experience gradual price appreciation through 2028, with increasing volatility and market participation as community-driven initiatives mature.
- Investment return forecast:
- 2026: $0.01107 - $0.01773 (expected 19% growth)
- 2027: $0.01007 - $0.02000 (expected 48% growth)
- 2028: $0.01375 - $0.02071 (expected 75% growth)
- Key catalysts: Community expansion, exchange listings, charitable initiatives, and BNB ecosystem integration
Long-term Investment Outlook (Is KOMA a good long-term investment?)
- Base scenario: $0.01275 - $0.02271 USD (assumes steady community growth and moderate market adoption through 2030)
- Optimistic scenario: $0.02271 - $0.03000 USD (assumes accelerated ecosystem development and increased institutional interest)
- Risk scenario: $0.00800 - $0.01200 USD (reflects potential market contraction or diminished community engagement)
Click to view KOMA long-term investment and price forecast: Price Forecast
2025-12-23 to 2030 Long-term Outlook
- Base scenario: $0.01275 - $0.02271 USD (corresponding to steady progress and mainstream application advancement)
- Optimistic scenario: $0.02271 - $0.03500 USD (corresponding to large-scale adoption and favorable market conditions)
- Transformative scenario: $0.05000 USD and above (if ecosystem achieves breakthrough progress and mainstream adoption)
- 2030-12-31 Predicted High: $0.02271 USD (based on optimistic development assumptions)
Disclaimer: This analysis is for informational purposes only and does not constitute investment advice. Cryptocurrency markets are highly volatile and subject to rapid changes. Past performance does not guarantee future results. Investors should conduct their own research and consult with financial advisors before making investment decisions.
| 年份 | 预测最高价 | 预测平均价格 | 预测最低价 | 涨跌幅 |
|---|---|---|---|---|
| 2025 | 0.01392375 | 0.009875 | 0.0079 | 0 |
| 2026 | 0.01773006875 | 0.011899375 | 0.01106641875 | 19 |
| 2027 | 0.01999987453125 | 0.014814721875 | 0.010074010875 | 48 |
| 2028 | 0.020714684861718 | 0.017407298203125 | 0.013751765580468 | 75 |
| 2029 | 0.020776480770339 | 0.019060991532421 | 0.010674155258156 | 91 |
| 2030 | 0.022707359212574 | 0.01991873615138 | 0.012747991136883 | 100 |
Koma Inu (KOMA) Research Report
I. Project Overview
Basic Information
Project Name: Koma Inu
Token Symbol: KOMA
Blockchain: BSC (BEP-20)
Current Price: $0.009944
Market Capitalization: $6,025,610.09
Fully Diluted Valuation: $9,944,000.00
Circulating Supply: 605,954,353.43 KOMA
Total Supply: 1,000,000,000 KOMA
Market Ranking: #1433
Last Updated: December 23, 2025
Project Description
Koma is a dog-themed token built on the BNB blockchain, positioning itself as "the son of Shib and protector of BNB." The project is centered around community-driven decentralization and charitable causes, with the stated goal of "making BNB great again."
II. Market Performance Analysis
Price Metrics
| Metric | Value |
|---|---|
| Current Price | $0.009944 |
| 24H High | $0.01021 |
| 24H Low | $0.009664 |
| All-Time High | $0.20185 (December 25, 2024) |
| All-Time Low | $0.00946 (December 18, 2025) |
Price Performance
Recent Price Movements:
- 1 Hour: +0.44%
- 24 Hours: +1.77%
- 7 Days: -6.45%
- 30 Days: -25.50%
- 1 Year: -92.30%
Trading Activity
- 24H Trading Volume: $42,007.13
- Market Dominance: 0.0003%
- Circulating Supply Ratio: 60.60%
- Number of Holders: 45,530
- Listed on 12 Exchanges
III. Investment Strategy and Risk Management
Investment Methodologies
Long-term Holding (HODL KOMA): Suitable for conservative investors seeking exposure to community-driven meme tokens on the BNB chain.
Active Trading: Applicable for traders utilizing technical analysis given the token's volatility patterns.
Risk Management
Asset Allocation Guidelines:
- Conservative Investors: Minimal allocation (<1% of portfolio)
- Aggressive Investors: Speculative allocation (<5% of portfolio)
- Professional Investors: Research-based tactical positioning
Risk Mitigation Strategies:
- Diversified portfolio composition across multiple blockchain ecosystems
- Use of stop-loss orders to manage downside exposure
- Position sizing appropriate to individual risk tolerance
Secure Storage:
- Hot wallets for active trading positions
- Hardware wallets or cold storage for long-term holdings
IV. Investment Risks and Challenges
Market Risks
- High Volatility: The token exhibits significant price fluctuations, with a 92.30% annual decline and recent drawdowns of 25.50% over 30 days.
- Liquidity Concentration: Relatively low trading volume ($42,007.13 in 24H) may result in slippage on larger positions.
- Price Manipulation Risk: Community-driven tokens can be susceptible to coordinated trading activity.
Regulatory Risks
- Uncertainty regarding regulatory treatment of community-driven tokens across different jurisdictions.
- Potential regulatory changes affecting BNB Chain operations.
Technical Risks
- Smart contract security considerations inherent to BEP-20 tokens.
- Network and platform-specific risks associated with the BNB Chain ecosystem.
V. Conclusion: Is Koma Inu a Good Investment?
Investment Value Summary
Koma Inu is a speculative, community-driven token with limited utility beyond its meme classification. The extreme negative performance over the past year (-92.30%) and significant drawdowns over shorter timeframes indicate high volatility and potential for substantial loss of capital. Current market conditions suggest limited fundamental valuation drivers.
Investor Guidance
⚠️ Disclaimer: Cryptocurrency investments carry substantial risk. This report is for informational purposes only and does not constitute investment advice.
Beginner Investors: Avoid or allocate only minimal, expendable capital. If participating, implement dollar-cost averaging with proper security practices.
Experienced Traders: Technical analysis and careful position sizing may be employed, recognizing the elevated risk profile typical of low-liquidity tokens.
Institutional Investors: Strategic allocation is not typically recommended given the speculative nature and limited market depth.
General Recommendation: Exercise extreme caution. Verify all contract addresses through official channels before transacting. Conduct independent research and consider only allocating capital you can afford to lose entirely.
Koma Inu (KOMA) Investment Analysis: Frequently Asked Questions
I. FAQ
Q1: What is Koma Inu (KOMA) and what blockchain does it operate on?
A: Koma Inu is a dog-themed token built on the BNB Smart Chain (BSC) using the BEP-20 standard. Launched on October 8, 2024, KOMA is positioned as "the son of Shib and protector of BNB" and focuses on community-driven decentralization and charitable initiatives. As of December 23, 2025, the token has a market capitalization of approximately $6,025,610.09 with a circulating supply of 605,954,353 tokens out of a total supply of 1 billion tokens.
Q2: What is the current price and recent price performance of KOMA?
A: As of December 23, 2025, KOMA trades at $0.009944. The token has experienced significant volatility, declining 92.30% over the past year and 25.50% over the past 30 days. KOMA reached an all-time high of $0.20185 on December 25, 2024, but has since retreated to near its all-time low of $0.00946 (recorded December 18, 2025). Recent short-term performance shows a 24-hour gain of +1.77% and a 7-day decline of -6.45%.
Q3: Is KOMA a good investment for 2025-2030?
A: KOMA is considered a highly speculative investment suitable only for risk-tolerant investors allocating expendable capital. Conservative investors should avoid or limit exposure to less than 1% of their portfolio. Price forecasts for 2030 range from $0.01275-$0.02271 (base scenario) to $0.02271-$0.03500 (optimistic scenario), though these projections carry significant uncertainty. The token's extreme volatility and limited fundamental differentiation present considerable downside risk.
Q4: What are the main risks associated with investing in KOMA?
A: Key investment risks include extreme price volatility (92.30% annual decline), limited trading liquidity with only $42,007.13 in 24-hour volume, modest market capitalization suggesting low institutional adoption, token dilution risk (only 60.60% of total supply currently circulating), regulatory uncertainty surrounding meme tokens, and the speculative nature of community-driven projects. Smart contract security risks and platform-specific BNB Chain vulnerabilities also warrant consideration.
Q5: What is the token supply structure and what does the circulation ratio indicate?
A: KOMA has a maximum supply of 1 billion tokens with 605,954,353 tokens currently circulating, representing a 60.60% circulation ratio. This means approximately 394 million tokens remain in reserve and could enter circulation, potentially causing price dilution. The relatively high circulation ratio indicates that substantial token inflation may occur, which could exert downward pressure on future price appreciation and create additional selling pressure.
Q6: How liquid is KOMA and on how many exchanges can it be traded?
A: KOMA demonstrates limited liquidity with 24-hour trading volume of $42,007.13, representing approximately 0.70% of its total market capitalization. The token is listed on 12 trading exchanges, providing reasonable accessibility but reflecting modest institutional interest. The low volume-to-market-cap ratio suggests potential slippage on larger positions and indicates that significant price movements could occur with relatively small order volumes.
Q7: What is the market sentiment and technical outlook for KOMA?
A: Current market sentiment is bearish to neutral, with a Market Emotion Index reading of 1 indicating negative positioning. Technical analysis reveals a 7-day Relative Strength Index (RSI) of 21.5, suggesting oversold conditions. Multiple analysts project a bearish outlook for 2025, with the token trading significantly below its 200-day simple moving average. However, oversold conditions may occasionally signal potential rebounds, though this should not be interpreted as investment endorsement.
Q8: What are the recommended investment strategies and risk management approaches for KOMA?
A: Conservative investors should avoid KOMA or limit allocation to minimal, expendable capital (<1% of portfolio) with dollar-cost averaging strategies. Aggressive investors may consider speculative positions (<5% of portfolio) with strict stop-loss orders and proper position sizing. All investors should store holdings in secure wallets (hardware wallets for long-term, hot wallets for active trading), verify contract addresses through official channels (0xd5eaaac47bd1993d661bc087e15dfb079a7f3c19 on BSC), and maintain diversified portfolio composition across multiple blockchain ecosystems to mitigate concentration risk.
Disclaimer: This analysis is for informational purposes only and does not constitute investment advice. Cryptocurrency markets are highly volatile and subject to rapid changes. Past performance does not guarantee future results. Investors should conduct independent research and consult with qualified financial advisors before making investment decisions. Only allocate capital that you can afford to lose entirely.
Share
Content
Introduction: Investment Position and Market Prospects of Koma Inu (KOMA)
I. Koma Inu (KOMA) Historical Price Review and Current Investment Value
II. Project Overview
III. Token Economics
I. Executive Summary
II. Core Factors Affecting KOMA Investment Viability
III. Investment Outlook Assessment
IV. Project Overview
V. Conclusion
Short-term Investment Forecast (2025, short-term KOMA investment outlook)
Mid-term Investment Outlook (2026-2028, mid-term Koma Inu(KOMA) investment forecast)
Long-term Investment Outlook (Is KOMA a good long-term investment?)
I. Project Overview
II. Market Performance Analysis
III. Investment Strategy and Risk Management
IV. Investment Risks and Challenges
V. Conclusion: Is Koma Inu a Good Investment?
I. FAQ
How to Buy Cryptocurrency


Trending Cryptocurrencies


Pepe Crypto Price Prediction: Will the Meme Coin Keep Climbing?

Top BNB Chain Meme Coin List: The Fun Side of the Binance Ecosystem

What Is the Current Market Cap and Trading Volume of TRUMP Token in 2025?

How Does Shiba Inu's Market Cap Compare to Other Major Cryptocurrencies in 2025?

What is the Current Market Overview of Giggle Fund (GIGGLE) in October 2025?

What Is the Current Market Overview for Giggle Fund (GIGGLE) in 2025?
Crypto RSI Heatmap

Ethereum Maintains 62% NFT Market Share Despite Growing Competition
CryptoQuant On-Chain Analysis Tools: Bitcoin Market Insights and Whale Tracking for Crypto Traders in 2026

Mist Browser (Ethereum DApp Browser)

Moo Deng (MOODENG) — The Viral Hippo Taking Over Crypto